
Dividend Growth on Canadian Stocks: +4.31% Alpha, Lowest Drawdown in Our Dataset (TSX Backtest)
We ran a dividend growth screen on Canadian stocks (TSX). 8.27% CAGR vs 3.95% for the TSX Composite, with 4.79% alpha, the lowest drawdown of any market tested (-20.70%), and a 0.423 Sharpe tied with the US.


Canada's dividend growers delivered the lowest max drawdown of any consistently-invested market we tested. Just -20.7%, against -35.82% for US dividend growers. The Sharpe ratio of 0.423 sits essentially tied with the US (0.436) at the top of the dataset, but the path is far smoother. Canadian banks, utilities, and pipelines don't just grow dividends. They grow them through crises.
Contents
- Method
- Results
- Annual Returns
- When It Works
- When It Struggles
- Limitations
- Run This Screen (Canada)
- Takeaway
- Part of a Series
- References
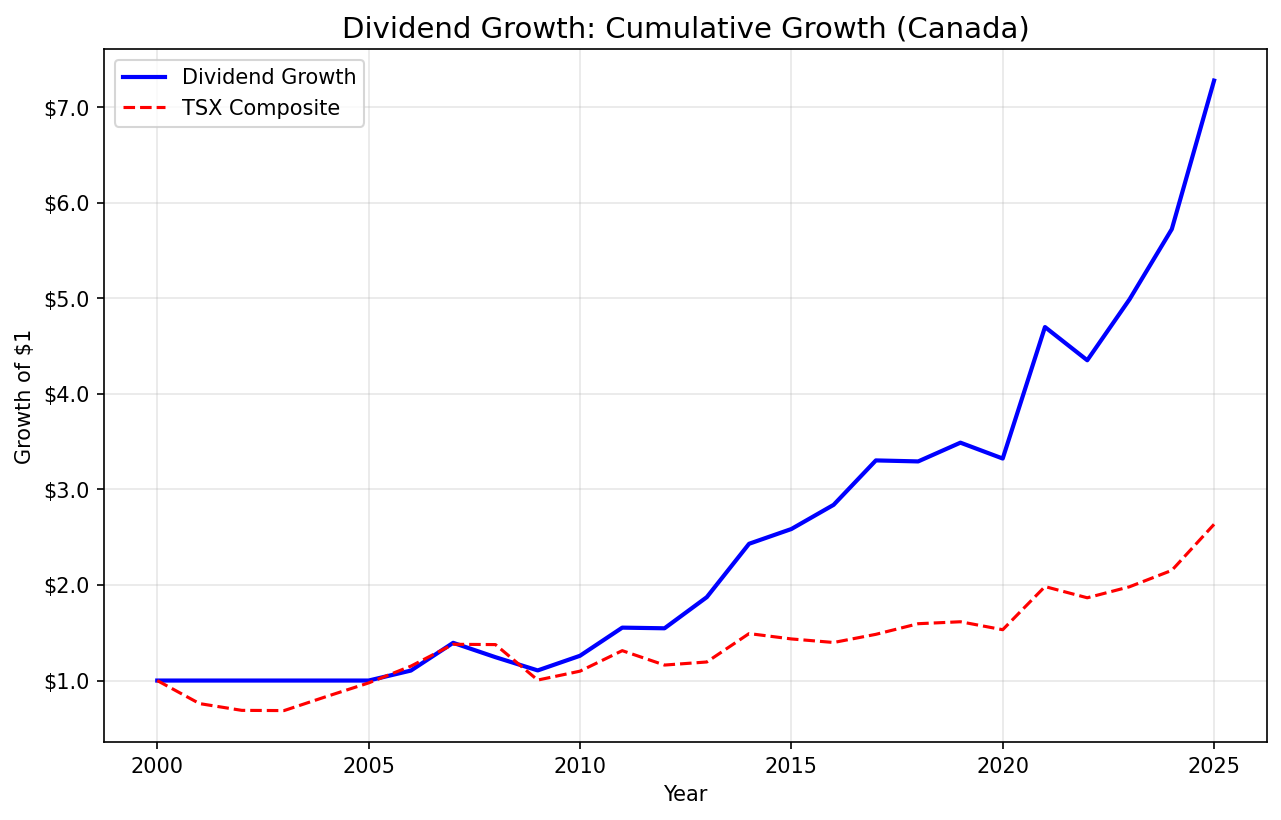
Over 25 years (2000-2024), a TSX portfolio of the longest dividend streak stocks returned 8.27% CAGR versus 3.95% for the TSX Composite. The 628% total return and 4.79% annualized alpha tell a strong outperformance story. Down capture of just 20.43% and a 76% win rate confirm this isn't a fluke. The risk numbers are what set Canada apart from every other market in this series.
Data: FMP financial data warehouse, 2000–2025. Updated June 2026.
Method
This is a regional extension of our US dividend growth backtest. The methodology is identical. If you want the full breakdown of how we count streaks, apply quality filters, and handle rebalancing, start there.
Canada-specific parameters:
| Parameter | Value |
|---|---|
| Universe | TSX (Toronto Stock Exchange) |
| Market cap minimum | C$500M |
| Streak requirement | 5+ consecutive years of annual dividend increases |
| Payout ratio | 0-80% |
| Free cash flow | Positive |
| Portfolio size | Top 30 by streak length |
| Weighting | Equal weight |
| Rebalance | Annual (July) |
| Period | 2000-2024 |
| Benchmark | TSX Composite (^GSPTSE) |
Code is open source: github.com/ceta-research/backtests
Results
| Metric | Portfolio | TSX Composite |
|---|---|---|
| CAGR | 8.27% | 3.95% |
| Total Return | 628% | -- |
| Sharpe Ratio | 0.423 | -- |
| Sortino Ratio | 1.218 | -- |
| Max Drawdown | -20.7% | -- |
| Calmar Ratio | 0.399 | -- |
| Beta | 0.671 | 1.0 |
| Alpha | 4.79% | -- |
| Up Capture | 114.15% | 100% |
| Down Capture | 20.43% | 100% |
| Win Rate | 76% | -- |
| Volatility | 13.64% | -- |
| Avg Stocks Held | 23.6 | -- |
| Cash Periods | 5/25 (20%) | -- |
Down capture of 20.43%. During years when the TSX Composite fell, this portfolio absorbed about a fifth of the decline. That single number explains the lowest drawdown in the dataset. You don't need to win big if you refuse to lose big.
Annual Returns
| Year | Portfolio | TSX Composite | Excess |
|---|---|---|---|
| 2000 | 0.0% (cash) | -24.1% | -- |
| 2001 | 0.0% (cash) | -9.3% | -- |
| 2002 | 0.0% (cash) | -0.3% | -- |
| 2003 | 0.0% (cash) | +21.4% | -- |
| 2004 | 0.0% (cash) | +17.1% | -- |
| 2005 | +10.4% | +18.0% | -7.6% |
| 2006 | +26.3% | +19.9% | +6.4% |
| 2007 | -10.8% | -0.2% | -10.6% |
| 2008 | -11.1% | -27.0% | +15.9% |
| 2009 | +13.9% | +9.3% | +4.6% |
| 2010 | +23.4% | +19.6% | +3.8% |
| 2011 | -0.4% | -11.5% | +11.0% |
| 2012 | +21.1% | +2.8% | +18.3% |
| 2013 | +29.8% | +24.9% | +4.9% |
| 2014 | +6.4% | -3.8% | +10.1% |
| 2015 | +9.8% | -2.6% | +12.4% |
| 2016 | +16.4% | +6.1% | +10.3% |
| 2017 | -0.3% | +7.5% | -7.8% |
| 2018 | +6.0% | +1.3% | +4.7% |
| 2019 | -4.8% | -5.2% | +0.4% |
| 2020 | +41.4% | +29.5% | +11.9% |
| 2021 | -7.4% | -5.9% | -1.5% |
| 2022 | +14.7% | +6.2% | +8.5% |
| 2023 | +14.7% | +8.7% | +6.1% |
| 2024 | +27.2% | +22.4% | +4.8% |
When It Works
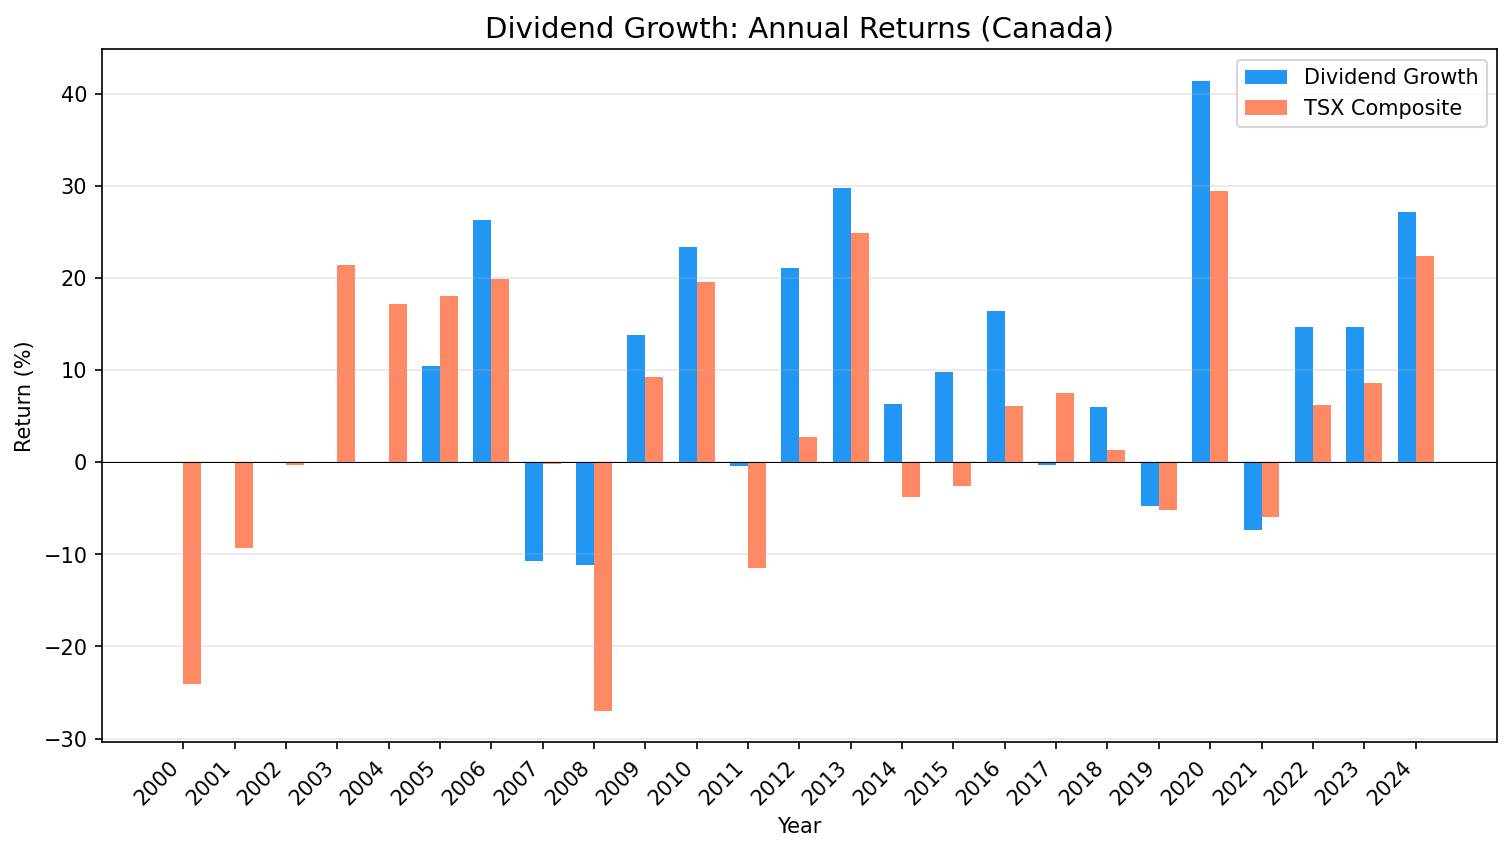
Bear markets. 2008 is the defining year. The TSX Composite lost -27.0%. This portfolio lost just -11.1%. That's +15.9% of excess return in a single year. 2011 was even more dramatic: TSX fell -11.5%, the portfolio held nearly flat at -0.4%, an +11.0% gap. Canadian banks entered the financial crisis with stricter capital requirements and less subprime exposure than US banks. They cut costs, not dividends.
Down markets broadly. With a 76% win rate and down capture of just 20.43%, the portfolio outperformed in roughly three out of four years. In 2014 (TSX -3.8%), the portfolio returned +6.4% for +10.1% excess. In 2015 (TSX -2.6%), it returned +9.8% for +12.4% excess. When the TSX struggles, dividend growers hold up.
Broad commodity and value cycles. 2012 produced the strategy's best single-year excess return: +18.3% (portfolio +21.1%, TSX +2.8%). Canadian dividend growers benefited from commodity strength and a rotation toward cash-generating businesses. 2008 (+15.9% excess), 2020 (+11.9% excess), and 2011 (+11.0% excess) showed similar patterns.
When It Struggles
Broad TSX rallies. When the TSX Composite surges, the portfolio can lag. 2007 was the worst relative year: -10.8% versus TSX -0.2%, a -10.6% gap. 2017 repeated the pattern: -0.3% versus TSX +7.5%, a -7.8% gap. The portfolio wasn't crashing. It was flat while the broader market pushed higher.
Oil price collapses. Energy is a large part of the TSX dividend universe. When oil prices fall sharply, pipeline companies and integrated producers get hit even if their dividends stay intact. 2019 is the clearest example of the strategy tracking the index rather than beating it: -4.8% versus TSX -5.2%, essentially flat against the benchmark (+0.4%). In energy-driven selloffs, the dividend screen moves with the TSX instead of dodging the decline.
Early-period misses. The five cash years (2000-2004) mean the portfolio sat out entirely while the TSX had a mixed run. The 2003 (+21.4%) and 2004 (+17.1%) TSX rallies were missed completely. Once invested, the 76% win rate and +4.31% excess CAGR more than compensate, but the early data gap is real.
Limitations
Currency. Both the portfolio and the TSX Composite benchmark are in CAD, so the comparison is apples-to-apples for Canadian investors. A USD-based investor would need to adjust for the CAD/USD exchange rate, which fluctuated from rough parity to 0.72 over this period.
Five cash years (2000-2004). The portfolio found fewer than 10 qualifying stocks on the TSX in the early years. FMP's Canadian fundamental data is sparser before 2005. The effective backtest starts in 2005 with 20 invested years, not 25. This means the 628% total return compounds over fewer active years than the headline period suggests.
Sector concentration. The TSX dividend growth universe clusters in financials (Big Five banks), utilities, pipelines, and telecom. These sectors have strong dividend cultures, but the portfolio is structurally underweight in technology, healthcare, and consumer discretionary. When those sectors lead, the strategy lags.
Annual rebalancing lag. July rebalancing with a 45-day data lag means positions are held for up to 12 months after the signal fires. If a company's fundamentals deteriorate mid-year, you're stuck until the next July. Canadian energy stocks in late 2018 and 2019 are the clearest example.
Survivorship. Companies that cut dividends and were delisted don't appear in the streak rankings. The stocks we see are the survivors. This inflates the apparent reliability of long streaks.
Run This Screen (Canada)
-- Dividend Growth Screen: Canada (TSX)
-- Run at: cetaresearch.com/data-explorer

WITH annual_div AS (
    SELECT symbol,
        EXTRACT(YEAR FROM CAST(date AS DATE)) AS yr,
        SUM(adjDividend) AS total_div
    FROM dividend_calendar
    WHERE adjDividend > 0
    GROUP BY symbol, EXTRACT(YEAR FROM CAST(date AS DATE))
),
growth AS (
    SELECT symbol, yr, total_div,
        LAG(total_div) OVER (PARTITION BY symbol ORDER BY yr) AS prev_div
    FROM annual_div
),
streak AS (
    SELECT symbol,
        SUM(CASE WHEN total_div > prev_div THEN 1 ELSE 0 END) AS years_increased,
        COUNT(*) AS total_years
    FROM growth WHERE prev_div IS NOT NULL
    GROUP BY symbol
    HAVING SUM(CASE WHEN total_div > prev_div THEN 1 ELSE 0 END) >= 5
)
SELECT s.symbol,
    p.companyName,
    s.years_increased,
    ROUND(p.marketCap / 1e9, 2) AS mktcap_B,
    ROUND(fr.dividendPayoutRatio * 100, 1) AS payout_pct,
    ROUND(cf.freeCashFlow / 1e6, 0) AS fcf_M
FROM streak s
JOIN profile p ON s.symbol = p.symbol
JOIN financial_ratios fr ON s.symbol = fr.symbol
    AND fr.period = 'FY'
JOIN cash_flow_statement cf ON s.symbol = cf.symbol
    AND cf.date = fr.date AND cf.period = 'FY'
WHERE p.exchange IN ('TSX')
    AND p.marketCap > 500000000
    AND fr.dividendPayoutRatio BETWEEN 0 AND 0.80
    AND cf.freeCashFlow > 0
QUALIFY ROW_NUMBER() OVER (PARTITION BY s.symbol ORDER BY fr.date DESC) = 1
ORDER BY s.years_increased DESC
LIMIT 30
Try this screen on Ceta Research
Takeaway
Canada produces the smoothest risk-adjusted outcome in our dividend growth series. A max drawdown of just -20.7%, the lowest of any consistently-invested market, a Sharpe of 0.423 (essentially tied with the US at the top of the dataset), and down capture of 20.43%. The absolute return (8.27% CAGR) more than doubles the TSX Composite's 3.95%, with 4.79% annualized alpha and a 76% win rate. The path to that return is dramatically smoother than the benchmark.
The TSX has a structural advantage for this strategy. Canadian banks are required to hold more capital than US banks. Pipelines operate under long-term take-or-pay contracts. Utilities sit in regulated monopolies. These businesses don't just pay dividends. They've built cultures around annual increases, and the regulatory environment protects their ability to do so. A beta of 0.671 against the TSX Composite confirms the portfolio captures gains without absorbing the index's full volatility.
For investors looking for dividend growth exposure with the lowest drawdown risk, the TSX is the standout exchange in our 25-year dataset.
Data: Ceta Research (FMP financial data warehouse). TSX, 2000-2024. Equal-weight top 30 by dividend streak, annual July rebalance. Past performance does not guarantee future results. Educational content only, not investment advice.
Part of a Series
This post is part of our dividend growth backtest series, testing the same strategy across multiple exchanges:
- Dividend Growth: US Stocks
- Dividend Growth: UK Stocks
- Dividend Growth: Germany
- Dividend Growth: India
- Dividend Growth: Switzerland
- Dividend Growth: Canada (this post)
- Dividend Growth: Global Comparison
References
- Lintner, J. (1956). "Distribution of Incomes of Corporations Among Dividends, Retained Earnings, and Taxes." American Economic Review, 46(2), 97-113.
- Arnott, R. & Asness, C. (2003). "Surprise! Higher Dividends = Higher Earnings Growth." Financial Analysts Journal, 59(1), 70-87.


