
Dividend Growth on Indian Stocks: 13.78% CAGR, +1.73% Excess vs Sensex (NSE Backtest)
We ran a dividend growth screen on NSE stocks. 13.78% CAGR vs 12.06% for the Sensex. Just -4.02% max drawdown. Down capture of -36.0%. Modest excess return, exceptional risk profile.


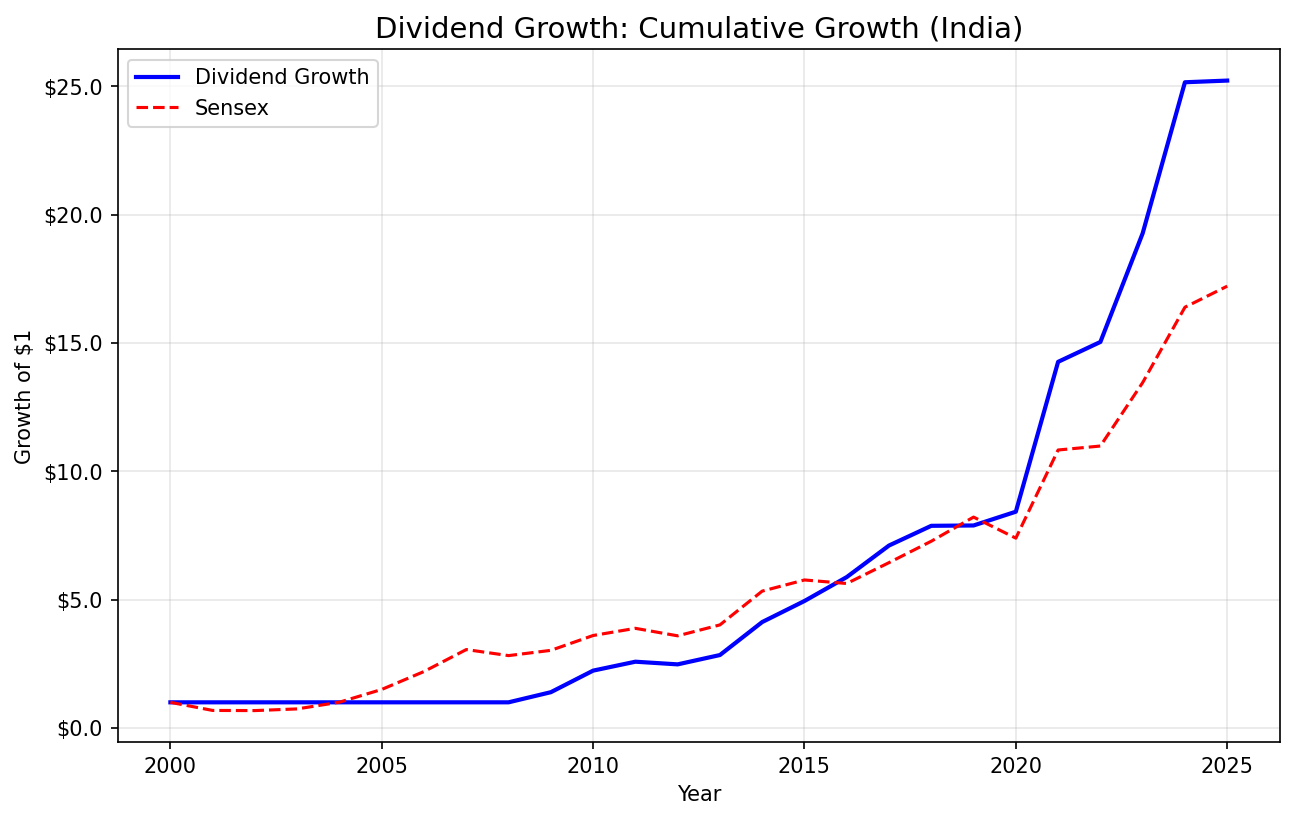
We screened NSE stocks for companies with 5+ consecutive years of rising dividends, then held the top 30 by streak length. The result: 13.78% CAGR vs 12.06% for the Sensex. Total return of 2,423%. The excess over the local benchmark is modest at +1.73%, but the risk profile tells a different story. Max drawdown was just -4.02%, and down capture came in at -36.0%. That negative number means the portfolio actually gained during periods when the Sensex fell. FMP data coverage for Indian stocks was limited before 2008, so the first eight years were cash periods. From 2008 onward, the strategy was consistently invested.
Contents
- Method
- Signal
- Results
- The Cash Period Story
- Annual Returns (Invested Years)
- When It Works
- When It Struggles
- Limitations
- Run This Screen (India)
- Part of a Series
- References
Data: FMP financial data warehouse, 2000–2025. Updated June 2026.
Method
Data source: Ceta Research (FMP financial data) Universe: NSE stocks with market cap > 20B INR (~$240M USD) Period: 2000-2025 (25 years, invested from 2008) Rebalancing: Annual (July)
Signal
| Filter | Threshold |
|---|---|
| Consecutive dividend increases | >= 5 years |
| Payout ratio | 0% to 80% |
| Free cash flow | > 0 |
| Market cap | > 20B INR (~$240M USD) |
Portfolio: Top 30 by streak length, equal weight. Cash if fewer than 10 qualify.
For full methodology, see our US analysis.
Results
| Metric | Strategy | Sensex |
|---|---|---|
| CAGR | 13.78% | 12.06% |
| Total Return | 2,423% | -- |
| Max Drawdown | -4.02% | -- |
| Sharpe Ratio | 0.361 | -- |
| Sortino Ratio | 1.583 | -- |
| Calmar Ratio | 3.428 | -- |
| Win Rate (vs Sensex) | 68% | -- |
| Up Capture | 89.24% | -- |
| Down Capture | -36.0% | -- |
| Beta | 0.319 | -- |
| Alpha | 5.51% | -- |
| Volatility | 20.17% | -- |
| Cash Periods | 8/25 (32%) | -- |
| Avg Stocks | 19.7 | -- |
The headline CAGR of 13.78% barely edges the Sensex at 12.06%. But look at the risk numbers. A Calmar of 3.428 with max drawdown of just -4.02% is exceptional. The Sortino of 1.583 shows clean downside-adjusted returns. Beta of 0.319 means this portfolio moves at a third the pace of the Sensex, with volatility of 20.17%. The strategy turned $1 into $25.23 over 17 invested years, with far less pain than the index.
The Cash Period Story
Eight cash periods (2000-2007) all fall at the start of the backtest window. FMP coverage for Indian dividend data doesn't begin in earnest until 2008. This is a data availability issue, not a signal failure. From 2008 onward, India averages 19.7 qualifying stocks per period. The dividend growth signal is well-suited to the Indian market, where many large-cap companies have established multi-year traditions of rising payouts backed by strong domestic demand.
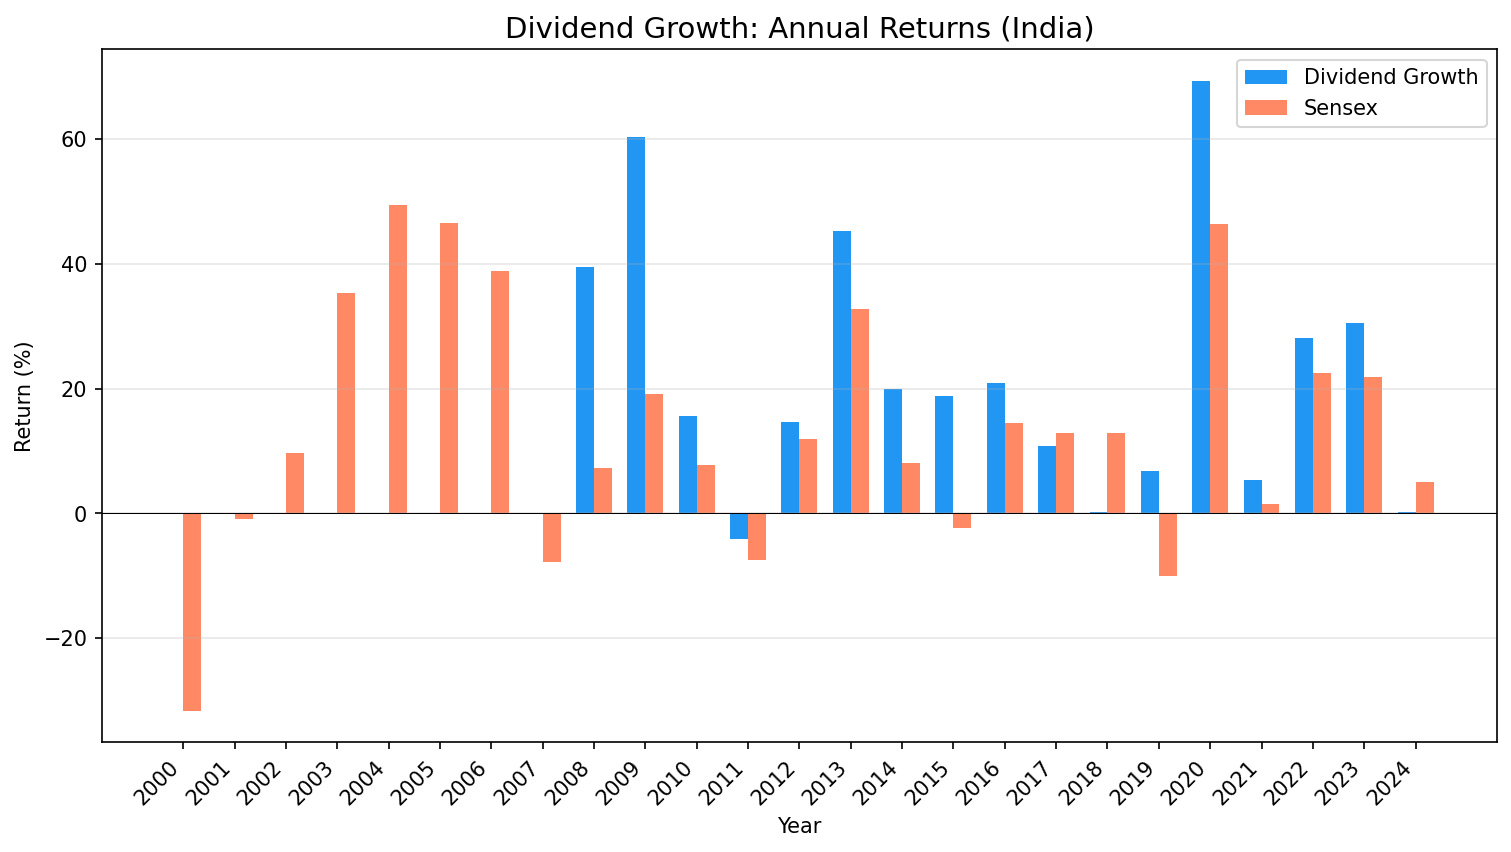
Annual Returns (Invested Years)
| Year | Strategy | Sensex | Excess |
|---|---|---|---|
| 2008 | +39.5% | +7.3% | +32.2% |
| 2009 | +60.3% | +19.1% | +41.1% |
| 2010 | +15.6% | +7.8% | +7.8% |
| 2011 | -4.0% | -7.5% | +3.5% |
| 2012 | +14.7% | +11.9% | +2.8% |
| 2013 | +45.2% | +32.8% | +12.5% |
| 2014 | +19.9% | +8.1% | +11.7% |
| 2015 | +18.8% | -2.4% | +21.2% |
| 2016 | +20.9% | +14.4% | +6.5% |
| 2017 | +10.8% | +12.9% | -2.1% |
| 2018 | +0.2% | +12.9% | -12.7% |
| 2019 | +6.8% | -10.0% | +16.8% |
| 2020 | +69.3% | +46.4% | +22.9% |
| 2021 | +5.4% | +1.4% | +4.0% |
| 2022 | +28.1% | +22.5% | +5.7% |
| 2023 | +30.5% | +21.8% | +8.7% |
| 2024 | +0.3% | +5.0% | -4.7% |
When It Works
2008: The portfolio returned +39.5% while the Sensex managed just +7.3%. That's +32.2% excess. Indian companies with long dividend growth streaks tend to be cash-rich, domestically focused businesses that outperform during uncertain periods.
2009, 2013, 2020: All returned 45% or more. Recovery and bull market years reward companies with proven capital discipline. 2020 stands out at +69.3% vs the Sensex's +46.4%. When markets re-rate quality, these names lead the way.
Down markets (2011, 2015, 2019): The portfolio gained in two of the three years the Sensex posted losses. Down capture of -36.0% means the portfolio tends to gain when the Sensex falls. This is where the strategy earns its keep, not in headline returns but in protecting capital.
When It Struggles
2018: The weakest relative year, with +0.2% vs the Sensex's +12.9%. Growth and momentum dominated Indian markets during this stretch. Traditional dividend growers lagged as investors chased higher-growth names in IT and consumer discretionary sectors.
2017 and 2024: Mild underperformance against the Sensex. After strong multi-year runs, some mean reversion is typical. The +0.3% in 2024 trailed the Sensex's +5.0%, but the gap was modest and the strategy avoided any drawdown.
Limitations
Data coverage before 2008: FMP India data is sparse before 2008. The 8 cash periods reflect data gaps, not strategy failure. Effective results cover 2008-2024 (17 invested years).
BSE removed: Earlier versions included both BSE and NSE. We removed BSE due to dual-listing overlap, which inflated the universe with duplicate companies. NSE-only gives a cleaner signal.
Market microstructure: Indian markets have different trading hours, settlement cycles, and transaction costs than US markets. Our cost model may understate friction for India-specific execution.
Run This Screen (India)
WITH annual_div AS (
    SELECT symbol,
        EXTRACT(YEAR FROM CAST(date AS DATE)) AS yr,
        SUM(adjDividend) AS total_div
    FROM dividend_calendar
    WHERE adjDividend > 0
        AND symbol IN (SELECT DISTINCT symbol FROM profile WHERE exchange IN ('NSE'))
    GROUP BY symbol, EXTRACT(YEAR FROM CAST(date AS DATE))
),
growth AS (
    SELECT symbol, yr, total_div,
        LAG(total_div) OVER (PARTITION BY symbol ORDER BY yr) AS prev_div
    FROM annual_div
),
last_break AS (
    SELECT symbol, MAX(yr) AS break_yr
    FROM growth
    WHERE prev_div IS NOT NULL AND total_div <= prev_div
    GROUP BY symbol
),
streak AS (
    SELECT g.symbol, COUNT(*) AS consecutive_years,
        MIN(g.yr) AS streak_from, MAX(g.yr) AS streak_to
    FROM growth g
    LEFT JOIN last_break lb ON g.symbol = lb.symbol
    WHERE g.prev_div IS NOT NULL
      AND g.total_div > g.prev_div
      AND (lb.break_yr IS NULL OR g.yr > lb.break_yr)
    GROUP BY g.symbol
    HAVING COUNT(*) >= 5
)
SELECT s.symbol, s.consecutive_years, s.streak_from, s.streak_to,
    ROUND(r.dividendPayoutRatioTTM * 100, 1) AS payout_pct,
    ROUND(k.marketCap / 1e9, 2) AS mktcap_bn,
    ROUND(c.freeCashFlow / 1e6, 0) AS fcf_mm
FROM streak s
JOIN financial_ratios_ttm r ON s.symbol = r.symbol
JOIN key_metrics_ttm k ON s.symbol = k.symbol
JOIN cash_flow_statement_ttm c ON s.symbol = c.symbol
WHERE r.dividendPayoutRatioTTM BETWEEN 0 AND 0.80
  AND c.freeCashFlow > 0
  AND k.marketCap > 20000000000
QUALIFY ROW_NUMBER() OVER (PARTITION BY s.symbol ORDER BY s.consecutive_years DESC) = 1
ORDER BY s.consecutive_years DESC, k.marketCap DESC
LIMIT 30
Data: Ceta Research (FMP financial data warehouse). Universe: NSE, market cap > 20B INR (~$240M USD). Benchmark: Sensex (^BSESN). Backtest: 2000-2025, annual July rebalance. Past performance does not guarantee future results. This is educational content, not investment advice.
Part of a Series
This is the India analysis. See also: - Dividend Growth on US Stocks - full methodology - Dividend Growth Across Global Exchanges - full comparison
References
- Lintner, J. (1956). "Distribution of Incomes of Corporations Among Dividends, Retained Earnings, and Taxes." American Economic Review, 46(2), 97-113.
- Arnott, R. & Asness, C. (2003). "Surprise! Higher Dividends = Higher Earnings Growth." Financial Analysts Journal, 59(1), 70-87.


