
Compounding Equity Screen UK: 10.02% CAGR With Almost No Drawdown

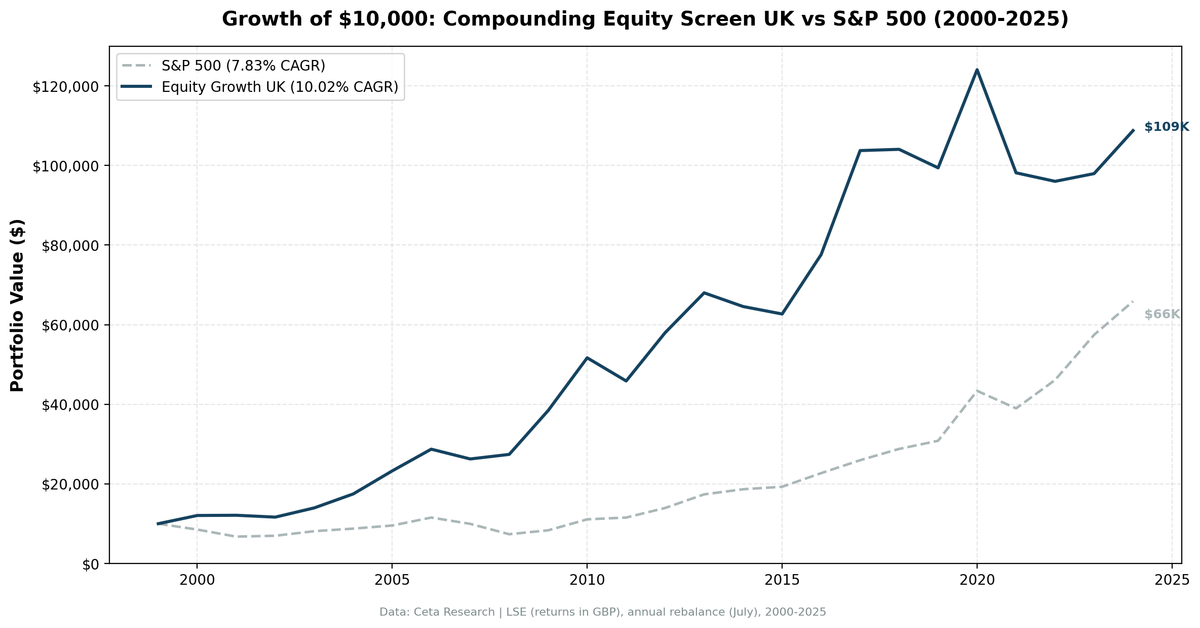
We backtested the Compounding Equity Screen on London Stock Exchange stocks from 2000 to 2025. The portfolio returned 10.02% annually vs 7.83% for the S&P 500. That +2.18% annual excess compounds meaningfully over time: $10,000 grew to $108,800 vs $65,900 for the S&P 500.
Contents
- Method
- The Signal
- What Research Shows
- The Screen
- Simple Screen (SQL)
- Advanced Screen (SQL)
- Results
- When It Works: Crisis Protection
- When It Fails
- Full Annual Returns
- Limitations
- Run It Yourself
- Backtest
- Takeaway
- References
But the excess return isn't the story. The risk profile is.
During five years when the S&P 500 fell, UK equity compounders moved just 4.7% as much as the benchmark. In the 2008 financial crisis, while SPY fell 26%, UK equity compounders returned +4.4%. During the dot-com crash in 2000 and 2001, they gained 20.6% and 0.5% respectively while the market lost 15% and 21%. A strategy that compounds book value in both good and bad markets turns out to be resilient when the bad markets arrive.
Method
- Data source: Ceta Research (FMP financial data warehouse)
- Universe: London Stock Exchange (LSE), market cap > £500M
- Period: 2000-2025 (25 annual rebalance periods)
- Rebalancing: Annual (July), equal weight top 30 by highest equity CAGR
- Benchmark: S&P 500 Total Return (SPY), returns in GBP
- Cash rule: Hold cash if fewer than 10 stocks qualify
- Transaction costs: Size-tiered model (0.1% mega-cap, 0.3% large-cap, 0.5% mid-cap)
- Data quality guards: Entry price > £1, single-period return capped at 200%
Financial data uses a 45-day lag from the rebalance date for point-in-time correctness. Full methodology: backtests/METHODOLOGY.md
The Signal
A company's shareholders' equity grows when it retains more earnings than it pays out. Consistent 10%+ equity CAGR over five years means the company is both profitable and disciplined about capital, it generates more than its cost of capital and deploys it back into the business.
The signal: find companies that have been compounding their own book value for five consecutive years, then buy the ones doing it fastest.
Filters:
| Criterion | Metric | Threshold | Why |
|---|---|---|---|
| Value creation | Shareholders' equity CAGR (5yr) | > 10% | Core compounding signal |
| Quality overlay | Return on Equity (TTM) | > 8% | Growth from operations, not dilution |
| Quality overlay | Operating Profit Margin (TTM) | > 8% | Pricing power, operational efficiency |
| Liquidity | Market Cap | > £500M | Investable stocks only |
Ranking: Top 30 by equity CAGR descending, equal weight. The 5-year CAGR window accepts 3.5 to 7.0 years to handle data gaps and irregular filing schedules, targeting the closest available filing to 5 years prior.
What Research Shows
Warren Buffett used book value per share CAGR as his primary metric for measuring Berkshire's intrinsic value growth for decades. The logic is direct: if retained earnings are deployed at returns above the cost of capital, book value grows and intrinsic value follows.
Asness, Frazzini and Pedersen (2019) in Quality Minus Junk show that consistent equity growth is a reliable quality signal, it separates businesses with durable competitive advantages from cyclical compounders and leveraged growers. The Gordon Growth Model formalizes it: sustainable growth rate = ROE × (1 − payout ratio). Companies compounding equity at 10%+ either have high ROE or high retention, both positive signals.
The UK market has historically been fertile ground for this signal. LSE is structurally different from US exchanges: less technology concentration, more consumer staples, industrials, and financial services. These sectors compound book value steadily rather than through burst-growth cycles. The result is a more predictable compounding profile that holds up under stress.
The Screen
Simple Screen (SQL)
WITH curr_eq AS (
 SELECT symbol, totalStockholdersEquity AS eq_curr, dateEpoch AS epoch_curr,
 ROW_NUMBER() OVER (PARTITION BY symbol ORDER BY dateEpoch DESC) AS rn
 FROM balance_sheet
 WHERE period = 'FY' AND totalStockholdersEquity > 0
),
prior_5yr AS (
 SELECT c.symbol,
 b.totalStockholdersEquity AS eq_prior,
 (c.epoch_curr - b.dateEpoch) / 31536000.0 AS years_gap,
 POWER(
 c.eq_curr / b.totalStockholdersEquity,
 1.0 / ((c.epoch_curr - b.dateEpoch) / 31536000.0)
 ) - 1 AS eq_cagr,
 ROW_NUMBER() OVER (
 PARTITION BY c.symbol
 ORDER BY ABS((c.epoch_curr - b.dateEpoch) / 31536000.0 - 5) ASC
 ) AS best_match
 FROM curr_eq c
 JOIN balance_sheet b ON c.symbol = b.symbol AND c.rn = 1
 AND b.period = 'FY' AND b.totalStockholdersEquity > 0
 AND b.dateEpoch < c.epoch_curr - 4 * 31536000
 AND b.dateEpoch > c.epoch_curr - 7 * 31536000
)
SELECT pr.symbol, p.companyName,
 ROUND(pr.eq_cagr * 100, 2) AS eq_cagr_pct,
 ROUND(pr.years_gap, 1) AS years_measured,
 ROUND(k.marketCap / 1e9, 2) AS mktcap_b
FROM prior_5yr pr
JOIN profile p ON pr.symbol = p.symbol
JOIN key_metrics_ttm k ON pr.symbol = k.symbol
WHERE pr.best_match = 1 AND pr.years_gap BETWEEN 3.5 AND 7.0
 AND pr.eq_cagr > 0.10
 AND p.exchange = 'LSE'
ORDER BY pr.eq_cagr DESC
LIMIT 30
This returns LSE stocks ranked by 5-year equity CAGR. The problem: it includes companies that grew equity through acquisitions or share issuances rather than operational earnings.
Advanced Screen (SQL)
WITH curr_eq AS (
 SELECT symbol, totalStockholdersEquity AS eq_curr, dateEpoch AS epoch_curr,
 ROW_NUMBER() OVER (PARTITION BY symbol ORDER BY dateEpoch DESC) AS rn
 FROM balance_sheet
 WHERE period = 'FY' AND totalStockholdersEquity > 0
),
prior_5yr AS (
 SELECT c.symbol,
 b.totalStockholdersEquity AS eq_prior,
 (c.epoch_curr - b.dateEpoch) / 31536000.0 AS years_gap,
 POWER(
 c.eq_curr / b.totalStockholdersEquity,
 1.0 / ((c.epoch_curr - b.dateEpoch) / 31536000.0)
 ) - 1 AS eq_cagr,
 ROW_NUMBER() OVER (
 PARTITION BY c.symbol
 ORDER BY ABS((c.epoch_curr - b.dateEpoch) / 31536000.0 - 5) ASC
 ) AS best_match
 FROM curr_eq c
 JOIN balance_sheet b ON c.symbol = b.symbol AND c.rn = 1
 AND b.period = 'FY' AND b.totalStockholdersEquity > 0
 AND b.dateEpoch < c.epoch_curr - 4 * 31536000
 AND b.dateEpoch > c.epoch_curr - 7 * 31536000
)
SELECT pr.symbol, p.companyName, p.sector,
 ROUND(pr.eq_cagr * 100, 2) AS eq_cagr_pct,
 ROUND(pr.years_gap, 1) AS years_measured,
 ROUND(k.returnOnEquityTTM * 100, 2) AS roe_pct,
 ROUND(f.operatingProfitMarginTTM * 100, 2) AS opm_pct,
 ROUND(k.marketCap / 1e9, 2) AS mktcap_b
FROM prior_5yr pr
JOIN profile p ON pr.symbol = p.symbol
JOIN key_metrics_ttm k ON pr.symbol = k.symbol
JOIN financial_ratios_ttm f ON pr.symbol = f.symbol
WHERE pr.best_match = 1 AND pr.years_gap BETWEEN 3.5 AND 7.0
 AND pr.eq_cagr > 0.10 AND pr.eq_cagr < 1.00
 AND k.returnOnEquityTTM > 0.08
 AND f.operatingProfitMarginTTM > 0.08
 AND k.marketCap > 500000000
 AND p.exchange = 'LSE'
 AND p.isActivelyTrading = true
ORDER BY pr.eq_cagr DESC
LIMIT 30
The ROE filter removes companies that grew equity through new share issuances rather than retained earnings. The operating margin filter removes low-quality compounders with thin economics. What remains is a set of LSE companies that have been earning real returns on capital and reinvesting them for five consecutive years.
Results
| Metric | Portfolio | S&P 500 |
|---|---|---|
| CAGR | 10.02% | 7.83% |
| Total Return | 988% | 559% |
| Max Drawdown | -22.6% | -36.3% |
| Volatility | 17.0% | 16.2% |
| Sharpe Ratio | 0.384 | 0.267 |
| Sortino Ratio | 0.924 | 0.453 |
| Calmar Ratio | 0.443 | 0.216 |
| Down Capture | 4.7% | -- |
| Up Capture | 91.5% | -- |
| Win Rate (vs SPY) | 52% | -- |
| Cash Periods | 0/25 | -- |
| Avg Stocks | 20.3 | -- |
$10,000 invested in July 2000 grew to $108,800. The same $10,000 in SPY grew to $65,900. The portfolio captured 91.5% of the upside and only 4.7% of the downside.
The Calmar ratio (CAGR divided by max drawdown) is 0.443 vs SPY's 0.216. Twice the risk-adjusted return per unit of peak-to-trough loss. The Sortino ratio, 0.924 vs 0.453, tells the same story from a different angle: return per unit of downside deviation was more than double the benchmark.
When It Works: Crisis Protection
The portfolio's most valuable property is what it doesn't do in bad markets.
2000-2001 (Dot-Com Bust): While the S&P 500 lost 31% cumulative over two years, UK equity compounders gained 21%.
| Year | Portfolio | S&P 500 | Excess |
|---|---|---|---|
| 2000 | +20.6% | -14.8% | +35.4% |
| 2001 | +0.5% | -20.8% | +21.2% |
Companies that had been growing book value steadily for five years had little exposure to the speculative tech expansion that was unwinding. Their earnings were real, their equity bases were solid, and their share prices reflected fundamentals rather than momentum.
2008 (Financial Crisis): This is the clearest demonstration of what down capture of 4.7% actually means.
| Year | Portfolio | S&P 500 | Excess |
|---|---|---|---|
| 2008 | +4.4% | -26.1% | +30.5% |
While banks collapsed and markets fell 26%, a portfolio of UK companies that had been compounding book value gained ground. These were businesses generating returns above cost of capital in sectors not exposed to leverage or financial contagion. The quality filter did exactly what it was supposed to do.
2009 (Recovery): The portfolio then captured the full recovery and more.
| Year | Portfolio | S&P 500 | Excess |
|---|---|---|---|
| 2009 | +40.3% | +13.4% | +26.8% |
Mid-Period Run (2009-2013): A sustained outperformance period, including a standout 2017.
| Year | Portfolio | S&P 500 | Excess |
|---|---|---|---|
| 2010 | +34.4% | +32.9% | +1.5% |
| 2012 | +26.5% | +20.9% | +5.6% |
| 2016 | +23.8% | +17.7% | +6.1% |
| 2017 | +33.7% | +14.3% | +19.3% |
When It Fails
2021-2023 (US Tech Rally Without UK Participation): The strategy's weakest period.
| Year | Portfolio | S&P 500 | Excess |
|---|---|---|---|
| 2021 | -20.9% | -10.2% | -10.7% |
| 2022 | -2.2% | +18.3% | -20.5% |
| 2023 | +2.0% | +24.6% | -22.6% |
The SPY returns here are July-to-July. The 2022-2023 period reflects the tech mega-cap rally post-AI announcements: GPT, Nvidia, the Magnificent Seven. UK equity compounders, predominantly in industrials, consumer staples, and services, didn't participate in this repricing. The portfolio generated flat-to-small gains while US tech stocks repriced dramatically upward.
This isn't a strategy failure. It's the other side of the low down capture: a portfolio that doesn't fall 26% in crises also doesn't fully capture speculative tech rallies. That's the trade-off.
Brexit Period (2018-2019): Brexit uncertainty weighed on LSE valuations broadly.
| Year | Portfolio | S&P 500 | Excess |
|---|---|---|---|
| 2018 | +0.3% | +10.9% | -10.6% |
| 2019 | -4.5% | +7.1% | -11.6% |
Fundamentals remained intact but re-rating compressed returns.
Full Annual Returns
| Year | Portfolio | S&P 500 | Excess |
|---|---|---|---|
| 2000 | +20.6% | -14.8% | +35.4% |
| 2001 | +0.5% | -20.8% | +21.2% |
| 2002 | -3.9% | +3.3% | -7.1% |
| 2003 | +19.9% | +16.4% | +3.5% |
| 2004 | +25.1% | +7.9% | +17.2% |
| 2005 | +33.1% | +8.9% | +24.3% |
| 2006 | +23.5% | +21.0% | +2.5% |
| 2007 | -8.6% | -13.7% | +5.1% |
| 2008 | +4.4% | -26.1% | +30.5% |
| 2009 | +40.3% | +13.4% | +26.8% |
| 2010 | +34.4% | +32.9% | +1.5% |
| 2011 | -11.3% | +4.1% | -15.4% |
| 2012 | +26.5% | +20.9% | +5.6% |
| 2013 | +17.2% | +24.5% | -7.3% |
| 2014 | -5.1% | +7.4% | -12.4% |
| 2015 | -2.9% | +3.4% | -6.3% |
| 2016 | +23.8% | +17.7% | +6.1% |
| 2017 | +33.7% | +14.3% | +19.3% |
| 2018 | +0.3% | +10.9% | -10.6% |
| 2019 | -4.5% | +7.1% | -11.6% |
| 2020 | +24.8% | +40.7% | -15.9% |
| 2021 | -20.9% | -10.2% | -10.7% |
| 2022 | -2.2% | +18.3% | -20.5% |
| 2023 | +2.0% | +24.6% | -22.6% |
| 2024 | +11.0% | +14.7% | -3.6% |
Note: All returns measured July-to-July (rebalance period). SPY returns are in local currency context.
Limitations
Concentration in 20 stocks. The average portfolio held 20.3 stocks, smaller than the 26-30 common in US screens. Equal weighting at this size means a single large-cap holding has ~5% weight. For large institutional allocations, this creates capacity constraints.
GBP returns. The screen runs in local currency. For USD-based investors, currency effects add another layer of volatility. GBP/USD fluctuations can compress or amplify returns by several percentage points per year.
Annual rebalancing lag. Rebalancing in July means the portfolio holds positions for a full year after formation. Companies can deteriorate between rebalances. Quarterly rebalancing would cost more in transaction fees without a clear improvement in the signal, since equity CAGR changes slowly.
No momentum tilt. The screen ranks by equity CAGR, not recent price performance. Strong momentum names may not appear. The 2023 result (-22.6% excess vs SPY) partly reflects this: stocks that repriced upward on AI enthusiasm may not have had five years of steady equity compounding.
Survivorship bias. Historical results are based on companies that existed and reported throughout the test period. Companies that went bankrupt or were acquired have limited impact due to data availability constraints, but this creates mild survivorship bias in early periods.
Part of a Series: US | India | Screen Global | Germany | Canada
Run It Yourself
Run this screen live on Ceta Research →
Backtest
git clone https://github.com/ceta-research/backtests.git
cd backtests

# UK backtest
python3 equity-growth/backtest.py --preset uk --output results.json --verbose

# All exchanges
python3 equity-growth/backtest.py --global --output results/exchange_comparison.json
Takeaway
UK equity compounders delivered 10.02% CAGR over 25 years, the only exchange in our 14-country test where this strategy outperformed the S&P 500. The excess return (+2.18% annually) mattered, but the down capture of 4.7% is the more important result.
A strategy that gained during the dot-com crash, gained during the 2008 financial crisis, and compounded at 10% annually for 25 years is doing something right. The signal isn't obscure: find companies that have been growing their own book value at 10%+ per year for five years, confirm the growth came from operations (not financial engineering), and hold them until next July.
Of the 14 exchanges tested, only the UK showed consistent outperformance. That's not a marketing claim, the other 13 exchanges are in the global comparison. UK equity structure, the dominance of non-tech quality compounders, and LSE's historical mix of sectors explain why the signal works here when it doesn't elsewhere.
Run It Yourself
Explore the data behind this analysis on Ceta Research. Query our financial data warehouse with SQL, build custom screens, and run your own backtests across 70,000+ stocks on 20 exchanges.
Data: Ceta Research (FMP financial data warehouse), 2000-2025. Universe: London Stock Exchange (LSE). Returns in GBP. Full methodology: METHODOLOGY.md. Past performance doesn't guarantee future results. This is educational content, not investment advice.
References
- Asness, C., Frazzini, A. & Pedersen, L. (2019). "Quality Minus Junk." Review of Accounting Studies, 24(1), 34-112.
- Buffett, W. (1977-2023). Berkshire Hathaway Annual Letters. Book value per share CAGR as primary performance metric.
- Gordon, M. & Shapiro, E. (1956). "Capital Equipment Analysis: The Required Rate of Profit." Management Science, 3(1), 102-110. Sustainable growth rate = ROE × (1 − payout ratio).
- Cooper, M., Gulen, H. & Schill, M. (2008). "Asset Growth and the Cross-Section of Stock Returns." Journal of Finance, 63(4), 1609-1651.


