
Compounding Equity Screen Germany: 3.26% CAGR vs 5.04% DAX
We backtested the Compounding Equity Screen on XETRA stocks from 2000 to 2025. 3.26% CAGR vs 5.04% for the DAX. A -1.78% annual shortfall against the local benchmark, with 57% down capture and a 56% win rate. Germany trails the local index but by far less than it looked vs SPY.

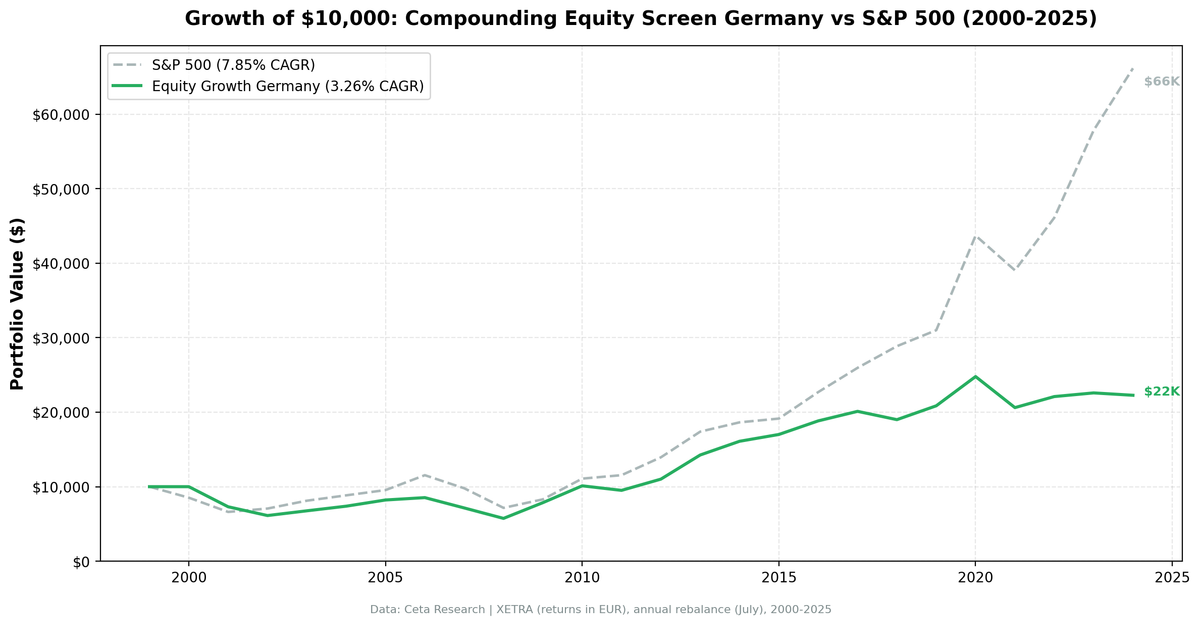
We backtested the Compounding Equity Screen on XETRA stocks from 2000 to 2025. The portfolio returned 3.26% annually vs 5.04% for the DAX. That -1.78% annual shortfall is much narrower than it appears against the S&P 500, compounding $10,000 into $22,300 vs $34,200 for the DAX.
Contents
- Method
- Signal and Filters
- Results
- The Standout Year
- Where It Worked and Where It Didn't
- Full Annual Returns
- Why the Gap Stays Modest
- The Screen
- Limitations
- Takeaway
Germany lands below its local index, but the gap is modest. 14 of 25 years beat the DAX (56% win rate). The strategy's widest single-year edge came in 2015 (+18.2% excess vs DAX), with solid stretches of outperformance around the financial crisis and through the mid-2010s.
This is what honest factor analysis looks like. The equity compounding signal has a sound theoretical basis. Against the local benchmark, it trails by under two points a year.
Method
Data source: Ceta Research (FMP financial data warehouse) Universe: XETRA (Germany), market cap > EUR 200M Period: 2000-2025 (25 annual rebalance periods, 1 cash) Rebalancing: Annual (July), equal weight top 30 by highest equity CAGR Benchmark: DAX (^GDAXI), price-return index Cash rule: Hold cash if fewer than 10 stocks qualify
Financial data uses a 45-day lag from the rebalance date for point-in-time correctness. Full methodology: backtests/METHODOLOGY.md
Signal and Filters
| Criterion | Metric | Threshold | Why |
|---|---|---|---|
| Value creation | Shareholders' equity CAGR (5yr) | > 10% | Core compounding signal |
| Quality overlay | Return on Equity (TTM) | > 8% | Growth from operations |
| Quality overlay | Operating Profit Margin (TTM) | > 8% | Pricing power confirmed |
| Liquidity | Market Cap | > EUR 200M | Investable universe |
Results
| Metric | Portfolio | DAX |
|---|---|---|
| CAGR | 3.26% | 5.04% |
| Total Return | 123% | 242% |
| Max Drawdown | -42.57% | -- |
| Sharpe Ratio | 0.079 | -- |
| Down Capture | 56.64% | -- |
| Up Capture | 59.36% | -- |
| Win Rate (vs DAX) | 56% | -- |
| Cash Periods | 1/25 | -- |
| Avg Stocks | 16.7 | -- |
The up capture of 59.36% and down capture of 56.64% are close to symmetric. The portfolio captures about 59% of DAX gains while absorbing 57% of DAX losses. The mild edge on the downside doesn't fully offset the lower up capture, which is why total return lands below the benchmark.
The Standout Year
2015: The Biggest Single-Year Win
| Year | Portfolio | DAX | Excess |
|---|---|---|---|
| 2015 | +5.7% | -12.5% | +18.2% |
2015 produced the widest single-year gap. While the DAX fell 12.5% on China-slowdown and commodity fears, German equity compounders with 5 years of consistent book value growth finished slightly positive. The 2000 dot-com year isn't in this comparison: too few German names cleared the five-year screen that early, so the portfolio sat in cash (a +12.2% relative result against the DAX's -12.2%, but not an invested win).
Against the DAX, the strategy produced multiple winning stretches: 2007-2011 (five consecutive years of positive or neutral excess), 2013-2015, and isolated strong years like 2017 and 2019.
Where It Worked and Where It Didn't
Against the DAX, the strategy had clear winning and losing periods.
2007-2011 (Five Strong Years):
| Year | Portfolio | DAX | Excess |
|---|---|---|---|
| 2007 | -16.3% | -20.8% | +4.5% |
| 2008 | -19.6% | -25.2% | +5.5% |
| 2009 | +36.8% | +23.6% | +13.1% |
| 2010 | +28.8% | +27.6% | +1.2% |
| 2011 | -6.0% | -12.7% | +6.7% |
The financial crisis and its aftermath were kind to equity compounders. In 2008, the portfolio fell 19.6% while the DAX dropped 25.2%. In 2011, the strategy lost 6.0% while the DAX fell 12.7%. Companies with steady equity growth weathered the volatility better than the broader market.
2020-2024 (Recent Weakness):
| Year | Portfolio | DAX | Excess |
|---|---|---|---|
| 2020 | +18.8% | +24.1% | -5.3% |
| 2021 | -16.8% | -18.4% | +1.6% |
| 2022 | +7.2% | +25.9% | -18.7% |
| 2023 | +2.2% | +14.3% | -12.0% |
| 2024 | -1.4% | +29.5% | -30.9% |
The recent period has been mostly poor, with 2021 a modest exception. The DAX rallied strongly from 2022 onward (partly driven by SAP and a handful of large-cap names), and the equity compounder portfolio couldn't keep up. 2024 was the worst relative year in the dataset: -30.9% excess.
Full Annual Returns
| Year | Portfolio | DAX | Excess |
|---|---|---|---|
| 2000 | 0.0% (cash) | -12.2% | +12.2% |
| 2001 | -27.0% | -31.3% | +4.3% |
| 2002 | -16.1% | -22.8% | +6.6% |
| 2003 | +10.4% | +23.4% | -13.0% |
| 2004 | +9.2% | +15.6% | -6.4% |
| 2005 | +11.3% | +23.6% | -12.3% |
| 2006 | +3.9% | +39.3% | -35.4% |
| 2007 | -16.3% | -20.8% | +4.5% |
| 2008 | -19.6% | -25.2% | +5.5% |
| 2009 | +36.8% | +23.6% | +13.1% |
| 2010 | +28.8% | +27.6% | +1.2% |
| 2011 | -6.0% | -12.7% | +6.7% |
| 2012 | +15.9% | +21.8% | -5.9% |
| 2013 | +29.4% | +25.3% | +4.1% |
| 2014 | +12.9% | +12.0% | +0.9% |
| 2015 | +5.7% | -12.5% | +18.2% |
| 2016 | +10.7% | +28.5% | -17.8% |
| 2017 | +6.8% | -1.9% | +8.7% |
| 2018 | -5.5% | +2.4% | -7.9% |
| 2019 | +9.8% | +0.7% | +9.1% |
| 2020 | +18.8% | +24.1% | -5.3% |
| 2021 | -16.8% | -18.4% | +1.6% |
| 2022 | +7.2% | +25.9% | -18.7% |
| 2023 | +2.2% | +14.3% | -12.0% |
| 2024 | -1.4% | +29.5% | -30.9% |
Why the Gap Stays Modest
1. Better benchmark fit. Against the DAX (a local price-return index), the equity compounding signal looks far more reasonable than against SPY. The -1.78% annual shortfall is modest for a 25-year backtest. Much of the apparent underperformance vs SPY was currency effect (USD strength) and US tech concentration, not signal failure.
2. Some downside cushion. A 56.64% down capture means the portfolio absorbed a bit more than half of DAX losses. During 2007-2008 and 2011, the strategy outperformed in falling markets. The cushion is real, but smaller than a dedicated defensive screen would deliver, and the up capture (59.4%) is nearly as low.
3. Recent DAX concentration. The 2022-2024 period was brutal for relative performance (-30.9% excess in 2024 alone). The DAX has become increasingly concentrated in SAP and a few large-cap exporters. The equity compounder portfolio, which selects mid-cap quality businesses, can't keep up when index returns are driven by a handful of mega-caps.
4. Industrial cycle exposure. German equity compounders are disproportionately mid-cap industrials: machinery, chemicals, automotive suppliers, specialized engineering. When global trade slows (2020 supply chains, 2022-2023 China deceleration), these businesses suffer. The ROE > 8% and OPM > 8% filters select industrials, not defensives.
The Screen
Run this screen live on Ceta Research →
-- (Same SQL as UK screen but filtered to XETRA and EUR 200M market cap)
  AND k.marketCap > 200000000
  AND p.exchange = 'XETRA'
Limitations
Benchmark type. The DAX is a price-return index (excludes dividends), while portfolio returns use dividend-adjusted close prices. This may slightly overstate excess returns. With dividends reinvested, the DAX total return would be higher.
Industrial concentration. The screen selects ~17 stocks on average from a XETRA universe that is industrials-heavy. Minimal technology exposure creates structural underperformance during tech-led rallies (like 2024).
Not value-trap detection. Companies can have high equity CAGR from expansion into underperforming segments. The ROE/OPM filters help, but can't distinguish between genuinely high-quality compounders and businesses that happened to have good five-year runs before deteriorating.
Takeaway
Germany delivered 3.26% CAGR, 1.78% below the DAX annually. 14 of 25 years beat the local benchmark (56% win rate). The strategy offered a modest downside cushion (56.64% down capture) and had multiple winning stretches, with 2015 the standout year.
The equity compounding signal works better in Germany than the old SPY comparison suggested. Against a local benchmark, the shortfall is modest, though the defensive characteristics are weaker than they first appeared. The recent period (2020-2024) has been poor, but that's driven by DAX mega-cap concentration more than signal decay.
For investors with XETRA exposure, this screen selects quality mid-cap businesses with a modest downside cushion. The caveat: the DAX benchmark is price-return only (excludes dividends), so the true excess may be smaller than the numbers show.
Data: Ceta Research (FMP financial data warehouse), 2000-2025. Universe: XETRA (Germany). Benchmark: DAX (price-return). Returns in EUR. Full methodology: METHODOLOGY.md. Past performance does not guarantee future results. This is educational content, not investment advice.


