
Compounding Equity Screen: Tested on 14 Exchanges, Five Beat Their Local Benchmarks
We backtested the Compounding Equity Screen across 14 exchanges worldwide from 2000 to 2025. Five markets outperform their local benchmarks (UK, Sweden, Switzerland, Japan, Canada). Only the UK also beats the S&P 500. The results reveal where equity compounding works and where it doesn't.

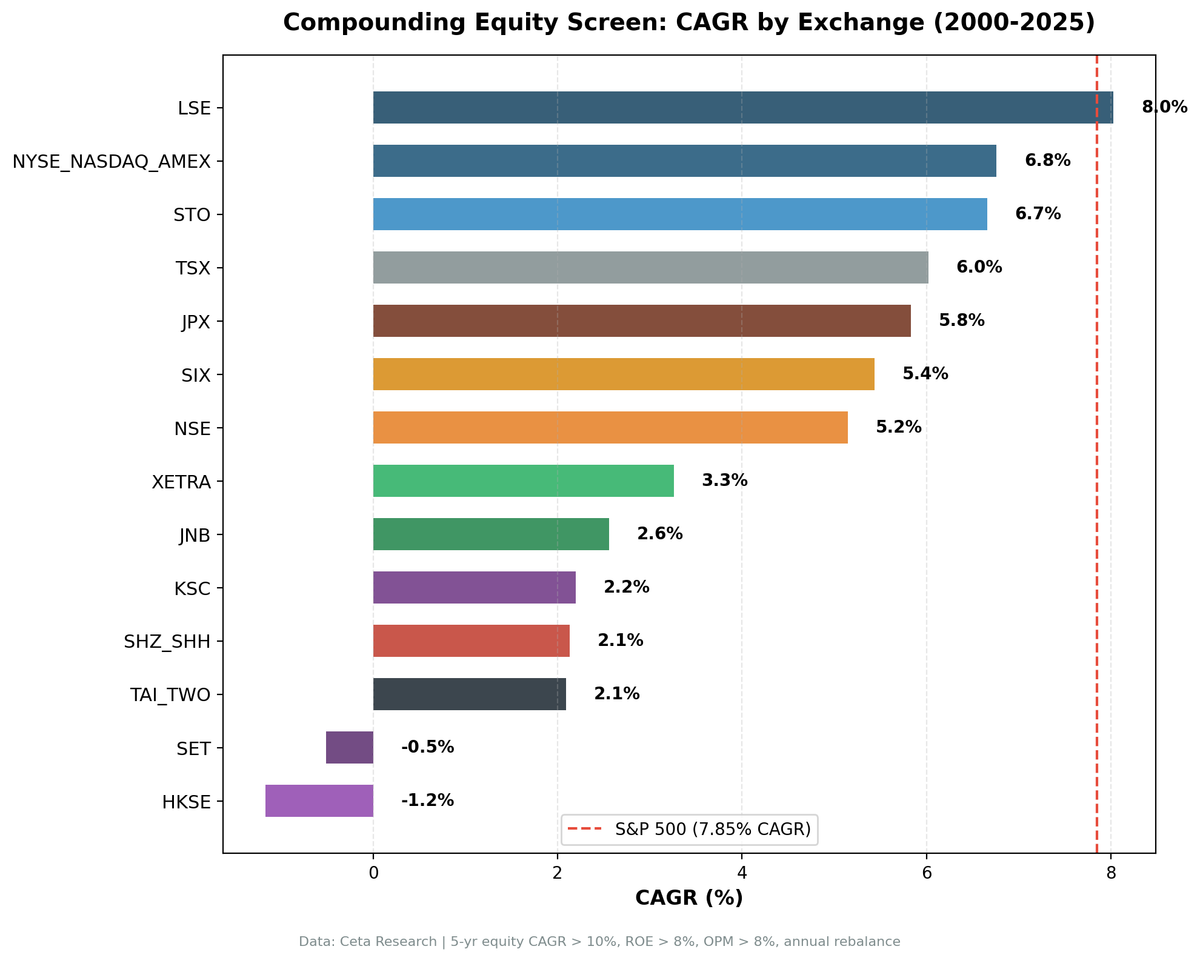
We ran the Compounding Equity Screen on 14 global exchanges from 2000 to 2025. Five of fourteen markets outperform their local price-return benchmark indices: UK (+6.80% vs FTSE 100), Sweden (+4.11% vs OMX 30), Switzerland (+3.70% vs SMI), Japan (+2.51% vs Nikkei 225), and Canada (+2.07% vs TSX Composite). Only the UK also beats the S&P 500 (total return).
Contents
- Method
- Results by Exchange
- UK: The Strongest Outperformer
- North America: Canada Outperforms TSX, US Trails SPY
- Europe: Three Different Stories
- Asia-Pacific: Japan Outperforms, India and Hong Kong Struggle
- The Pattern
- Run It Yourself
- Backtest
- Takeaway
- References
The UK (London Stock Exchange) delivered 8.03% CAGR with a down capture of 13.2%. The spread between best and worst was 9.2 percentage points of annual return.
Method
Data source: Ceta Research (FMP financial data warehouse) Universe: 14 exchanges (see table below), per-exchange market cap thresholds Period: 2000-2025 (25 annual rebalance periods) Rebalancing: Annual (July), equal weight top 30 by highest equity CAGR Benchmark: Local price-return index per exchange (e.g., FTSE 100 for UK, DAX for Germany). S. Africa falls back to SPY (no local index data in FMP). Note: local indices are price-return only (exclude dividends), while portfolio returns use dividend-adjusted close prices. This may slightly overstate excess returns. Cash rule: Hold cash if fewer than 10 stocks qualify Transaction costs: Size-tiered model per exchange Data quality guards: Entry price > minimum per exchange, single-period return capped at 200%
Financial data uses a 45-day lag from the rebalance date for point-in-time correctness. CAGR capped at 100% to filter hyperinflation artifacts. Turkey (IST) excluded due to lira inflation distorting equity CAGR. Average 64% CAGR in inspection data, rendering the signal meaningless.
Full methodology: backtests/METHODOLOGY.md
Results by Exchange
| Exchange | CAGR | Local Benchmark | vs Local | Benchmark Name |
|---|---|---|---|---|
| LSE (UK) | 8.03% | 1.23% | +6.80% | FTSE 100 |
| NYSE+NASDAQ+AMEX (US) | 6.76% | 7.85% | -1.09% | S&P 500 |
| STO (Sweden) | 6.66% | 2.55% | +4.11% | OMX 30 |
| TSX (Canada) | 6.02% | 3.95% | +2.07% | TSX Composite |
| JPX (Japan) | 5.83% | 3.31% | +2.51% | Nikkei 225 |
| SIX (Switzerland) | 5.44% | 1.74% | +3.70% | SMI |
| NSE (India) | 5.15% | 12.06% | -6.90% | Sensex |
| XETRA (Germany) | 3.26% | 5.04% | -1.78% | DAX |
| JNB (S. Africa) | 2.56% | 7.85% | -5.29% | S&P 500* |
| KSC (Korea) | 2.20% | 5.35% | -3.15% | KOSPI |
| SHZ+SHH (China) | 2.13% | 2.43% | -0.30% | Shanghai Comp |
| TAI+TWO (Taiwan) | 2.09% | 4.09% | -1.99% | TAIEX |
| SET (Thailand) | -0.51% | 5.13% | -5.64% | SET Index |
| HKSE (Hong Kong) | -1.17% | 1.64% | -2.81% | Hang Seng |
*S. Africa falls back to SPY (no local index data in FMP).
Run the global qualifying stock count →
UK: The Strongest Outperformer
The UK result stands apart from all other exchanges on excess return vs its local benchmark.
8.03% CAGR vs 1.23% for the FTSE 100. That +6.80% annual excess is the widest gap of any exchange. The UK is also the only market where the strategy beats the S&P 500 (total return).
13.2% down capture. When the FTSE 100 fell, UK equity compounders absorbed roughly an eighth of the losses. In 2008, the FTSE dropped 22.0% while UK equity compounders fell 10.2%. In 2000, the FTSE fell while UK equity compounders gained +21.3%.
Why does the UK work? LSE has historically been dominated by sectors where steady equity compounding is natural: consumer staples, industrials, diversified financial services, and real estate. These aren't high-multiple growth companies. They're businesses that generate consistent returns and reinvest them conservatively. The 10%+ equity CAGR signal selects the best of this group, and in UK market structure, the best of this group are genuinely defensive businesses.
See the full UK analysis: Compounding Equity Screen UK
North America: Canada Outperforms TSX, US Trails SPY
Canada (TSX) delivered 6.02% CAGR vs 3.95% for the TSX Composite, a +2.07% excess. Against its local benchmark, Canada is one of the five outperformers. The early period was strong (2001-2007 showed multiple years of double-digit excess), while 2008 was the worst year: -40.6% (full max drawdown, coinciding with the commodity collapse).
US (NYSE+NASDAQ+AMEX) delivered 6.76% CAGR vs 7.85% for the S&P 500, a -1.09% gap. The US was the market most visibly damaged by the mega-cap concentration effect. In 2023, when the Magnificent Seven drove most of the S&P 500's gain, the US equity compounder portfolio returned -4.8%. The strategy selects quality mid-caps, which can't compete when index returns are driven by a handful of trillion-dollar companies.
See the dedicated analyses: US | Canada
Europe: Three Different Stories
Sweden (STO): 6.66% CAGR vs 2.55% for OMX 30, a +4.11% excess. Sweden is the second-strongest outperformer against its local benchmark, though it had 7 cash periods in early years and a -45% max drawdown. The volatility is higher than comparable European markets, but the excess return compensates.
Switzerland (SIX): 5.44% CAGR vs 1.74% for the SMI, a +3.70% excess. One of the widest gaps after the UK and Sweden. Swiss equity compounders benefit from a market dominated by quality industrials and healthcare (Nestle, Roche, Novartis style businesses). The signal naturally selects companies that fit this market's structure.
Germany (XETRA): 3.26% CAGR vs 5.04% for the DAX, -1.78% below the local benchmark. Against the DAX, Germany looks far less bleak than it did against SPY. The strategy had a 56% win rate vs DAX (14 of 25 years), with a modest downside cushion (57% down capture). The 2007-2011 and 2013-2015 stretches were strong. Recent years (2020-2024) have been poor as the DAX became more concentrated.
See the dedicated analysis: Germany
Asia-Pacific: Japan Outperforms, India and Hong Kong Struggle
Japan (JPX): 5.83% CAGR vs 3.31% for the Nikkei 225, a +2.51% excess. Japan is one of the five markets that beat their local benchmark. The early cash periods (2000-2004) are largely data availability constraints. Japan's equity compounders had solid absolute returns in recent years and meaningfully outpaced the Nikkei.
India (NSE): 5.15% CAGR vs 12.06% for the Sensex, a -6.90% gap. Against its local benchmark, India is one of the weakest performers. The Sensex returned 12% annually, reflecting India's strong structural growth, and the equity compounder portfolio couldn't keep up. The 8 cash periods in 2000-2007 (before FY reporting depth was sufficient) also dragged the overall CAGR. Once invested (2008 onward), absolute performance was better, but the Sensex was a high bar.
Korea (KSC), Taiwan (TAI+TWO): Korea returned 2.20% vs 5.35% for KOSPI (-3.15% excess). Taiwan returned 2.09% vs 4.09% for TAIEX (-1.99%). Both had significant cash periods due to data start dates. Neither delivered consistent alpha against local benchmarks.
China (SHZ+SHH): 2.13% CAGR vs 2.43% for the Shanghai Composite, nearly neutral (-0.30%). The strategy tracked the local index closely. Two extraordinary outlier years (2006 and 2014) were driven by state-directed capital flows rather than fundamentals, but the signal didn't meaningfully differentiate from the broader market's boom-bust cycles.
Hong Kong (HKSE): -1.17% CAGR vs 1.64% for the Hang Seng, a -2.81% gap. Three consecutive years of severe losses (2021-2023) reflect the China tech crackdown, Evergrande collapse, and property sector deterioration. The quality screens (ROE > 8%, OPM > 8%) didn't protect against policy-driven sector destruction.
See India analysis: India
The Pattern
The data no longer shows a clean UK-vs-everyone divide. Five markets outperform their local benchmarks. What separates the winners from the losers?
Market structure matters. The five outperformers (UK, Sweden, Switzerland, Japan, Canada) share a common trait: their local indices are less concentrated in a few mega-caps. The equity compounding signal selects quality mid-caps, and those mid-caps compete better when the index isn't dominated by a handful of trillion-dollar companies. In the US and India, where index concentration is high, the strategy trails.
Sector composition. UK and Swiss equity compounders skew toward businesses with tangible assets, recurring revenues, and long operational histories. These sectors naturally produce steady book value growth without the boom-bust cycles of technology or commodities. The signal aligns with market structure in these countries.
Price-return benchmark caveat. Local indices are price-return only (they exclude dividends), while portfolio returns use dividend-adjusted prices. This means the true excess may be smaller than the numbers show, especially in markets with high dividend yields. The outperformance is real, but the magnitude should be taken with some caution.
The honest bottom line. Five of fourteen exchanges beat their local benchmarks. Only the UK also beats the S&P 500 (total return). The signal has real predictive power in markets where quality mid-caps represent a meaningful share of total returns. In concentrated markets (US, India) and policy-driven markets (China, Hong Kong), structural factors dilute the signal.
Run It Yourself
Run the global qualifying stock count →
Backtest
git clone https://github.com/ceta-research/backtests.git
cd backtests

# All exchanges global run
python3 equity-growth/backtest.py --global --output results/exchange_comparison.json --verbose

# Individual exchanges
python3 equity-growth/backtest.py --preset uk
python3 equity-growth/backtest.py --preset india
python3 equity-growth/backtest.py --preset canada
Takeaway
The Compounding Equity Screen outperformed local benchmarks in five of fourteen markets: UK (+6.80%), Sweden (+4.11%), Switzerland (+3.70%), Japan (+2.51%), and Canada (+2.07%). Only the UK also beats the S&P 500 total return.
The strongest results come from markets where quality mid-caps represent a meaningful share of index returns. In concentrated markets like the US (-1.09% vs SPY) and India (-6.90% vs Sensex), the signal can't overcome index-level mega-cap dominance. In policy-driven markets like Hong Kong (-2.81% vs Hang Seng), the signal can't protect against top-down sector destruction.
One caveat: local benchmarks are price-return only (they exclude dividends), so the true excess may be somewhat smaller. The UK remains the strongest application. Sweden, Switzerland, Japan, and Canada are worth monitoring.
Data: Ceta Research (FMP financial data warehouse), 2000-2025. Returns in local currency per exchange. Benchmarks: local price-return indices (exclude dividends). Full methodology: METHODOLOGY.md. Past performance does not guarantee future results. This is educational content, not investment advice.
References
- Asness, C., Frazzini, A. & Pedersen, L. (2019). "Quality Minus Junk." Review of Accounting Studies, 24(1), 34-112.
- Buffett, W. (1977-2023). Berkshire Hathaway Annual Letters.
- Gordon, M. & Shapiro, E. (1956). "Capital Equipment Analysis: The Required Rate of Profit." Management Science, 3(1), 102-110.


