momentum
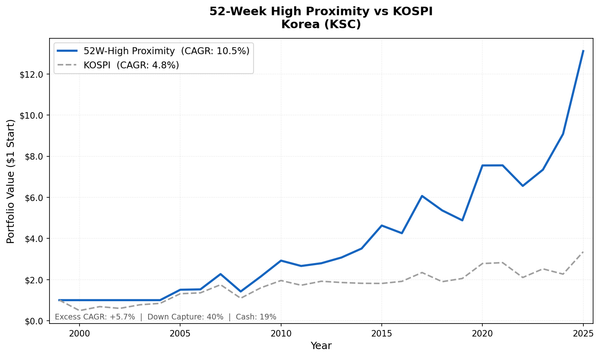
KOSPI's 52-Week High Screen: 11.4% CAGR, 39% Down Capture
We tested the 52-week high proximity strategy on Korean stocks (KSC) from 2000 to 2025. 10.51% CAGR, +5.70% vs KOSPI, 40.0% down capture. 2024 returned +23.7% when KOSPI fell 10.2%.

Building CetaResearch. Data analysis for policy, research, and startups.

momentum
We tested the 52-week high proximity strategy on Korean stocks (KSC) from 2000 to 2025. 10.51% CAGR, +5.70% vs KOSPI, 40.0% down capture. 2024 returned +23.7% when KOSPI fell 10.2%.
momentum
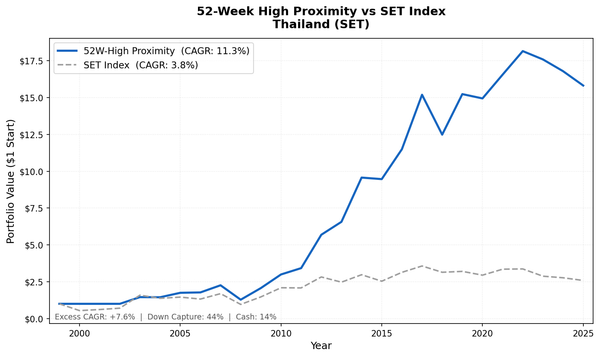
We tested the 52-week high proximity strategy on Thai stocks (SET) from 2000 to 2025. 11.32% CAGR, +7.56% vs SET Index, 44.4% down capture. In 2022, the strategy returned +9.6% while the SET rose just 0.5%.
momentum investing
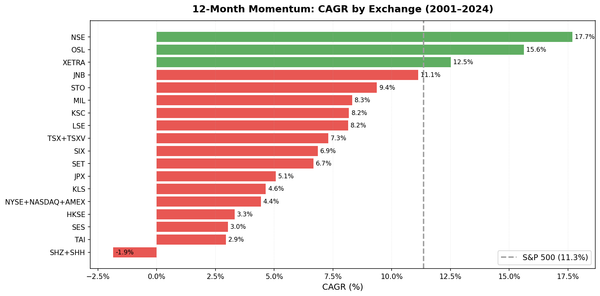
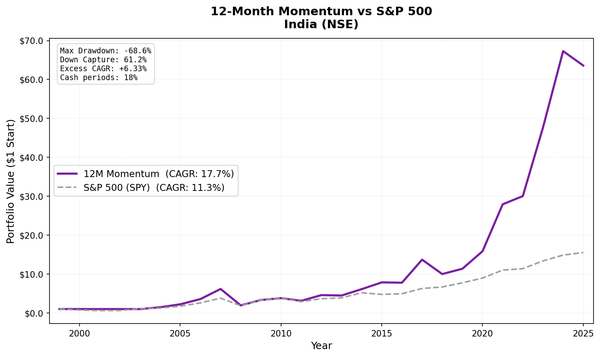
We ran pure 12-month price momentum on 18 exchanges worldwide. 7 of 17 comparable exchanges outperform SPY. India (NSE) leads at 17.68% CAGR with +9.91% annual excess. Germany has the best Sharpe at 0.552. US delivers -3.34% drag with 162% down capture. The pattern is geographic, and it maps...
momentum investing
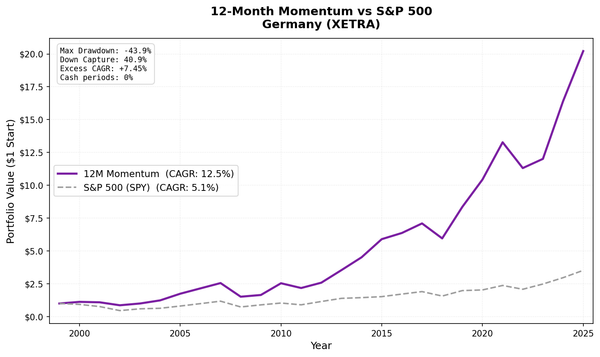
Pure 12-month price momentum on XETRA stocks from 2000 to 2025 delivered 12.51% CAGR with a Sharpe of 0.552, the highest risk-adjusted return in an 18-exchange global study. The strategy outperformed the DAX by 7.45% annually with a max drawdown of -43.88% vs the DAX's own -55.38%.
momentum investing
Pure 12-month price momentum on NSE stocks from 2000 to 2025 returned 17.68% annually, +6.33% per year over the Sensex. The portfolio captured 120% of the Sensex''s upside with only 61% of its downside. India is where the momentum factor works.
momentum investing
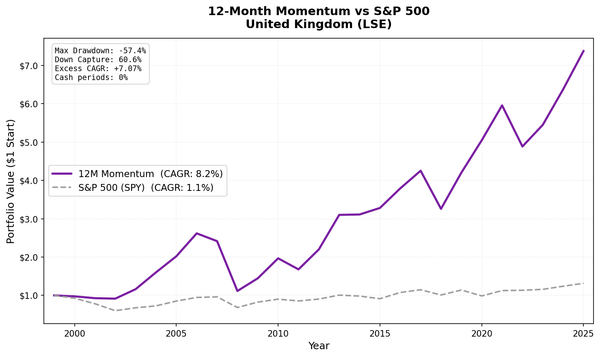
Pure 12-month price momentum on LSE stocks from 2000 to 2025 delivered 8.15% annually, +7.07% over the FTSE 100, with down capture of 61%. In most non-global-crisis downturns, the portfolio fell about 39% less than the FTSE 100. The UK is a consistent momentum market.
momentum investing
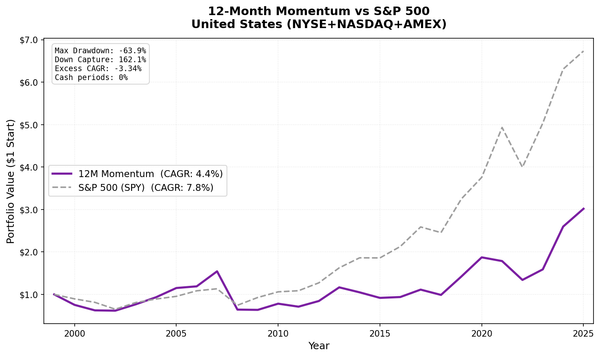
We ran pure 12-month price momentum (no quality filters) on US stocks from 2000 to 2025. The strategy returned 4.43% annually vs 7.77% for SPY, with 162% down capture and a near-zero Sharpe. The most studied momentum market offers the least reward.
pairs trading
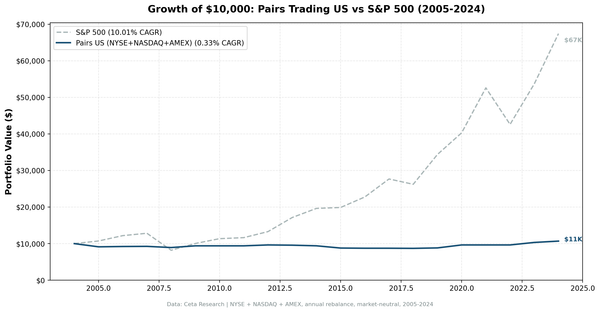
A full 20-year backtest of correlation-based pairs trading on US stocks. -0.50% CAGR, six cash years, beta of 0.067. The 2008 defense was real. The long-run cost was too.
DCF
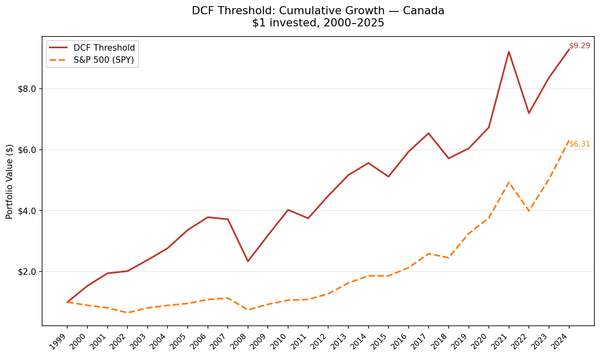
We ran a Gordon Growth DCF screen with quality filters on 25 years of Canadian TSX data. 9.32% CAGR, 1.68% annual excess return, and a -4.31% down capture — when the S&P 500 fell, Canadian DCF stocks gained on average, driven by resource sector dynamics in the early 2000s.
DCF
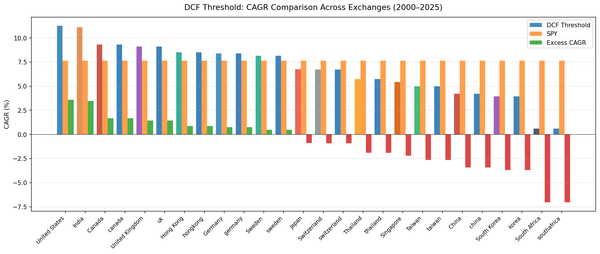
We ran the same DCF Threshold screen on 13 global stock exchanges. Seven markets beat SPY. Six underperformed. The dividing line follows a consistent geographic pattern — Western markets work, most Asian markets don't — and the structural reasons are documented.
DCF
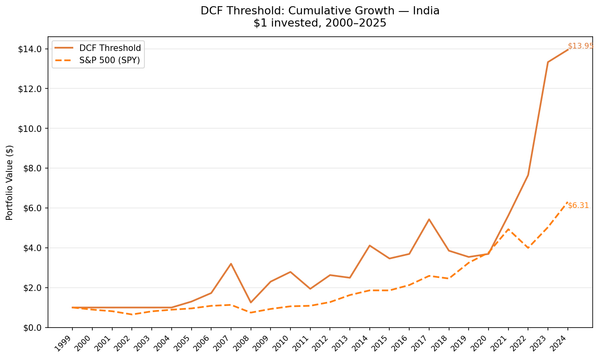
We ran a Gordon Growth DCF screen with quality filters on 25 years of Indian BSE/NSE data. No qualifying stocks 2000–2004. From 2005, the strategy returned 11.12% CAGR vs 7.64% SPY, with explosive swing years — 2007 (+85%), 2009 (+84%), 2022 (+36%) — alongside a -61% max drawdown.
DCF
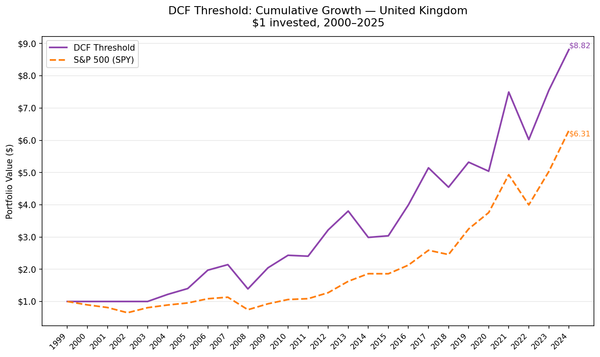
We ran a Gordon Growth DCF screen with quality filters on 25 years of London Stock Exchange data. No qualifying stocks 2000–2003. From 2004, 9.10% CAGR vs 7.64% SPY, with strong recovery years in 2006, 2009, 2012, and 2021 — and a -36% annual gap in 2014 driven by the energy sector collapse.