
High Dividend Yield Quality Screen Across Global Exchanges
We backtested a high dividend yield quality screen across 13 global exchanges from 2000-2025. 11 of 13 exchanges beat their local benchmark. Hong Kong, UK, and Sweden show the largest excess returns. India and Korea underperform due to high cash periods.


We ran the same high dividend yield quality screen on 13 exchanges with usable local benchmarks. Same filters everywhere: dividend yield 4-15%, payout 0-80%, FCF > 0, ROE > 8%, D/E < 2.0. Top 30 by yield, equal weight, annual July rebalance, next-day close execution (MOC). The question: does the high-yield quality signal work globally, or is it a US-specific phenomenon?
Contents
- Method
- Results: All Exchanges (vs Local Benchmarks)
- Excluded Exchanges
- Key Findings
- 1. The signal works in most markets
- 2. Highest alphas: Hong Kong, UK, Sweden
- 3. India and Korea: signal misfit
- 4. Down capture varies by market
- 5. High cash rates indicate poor signal fit
- Country-Specific Observations
- Limitations
- Takeaway
- Run This Screen Yourself
- References
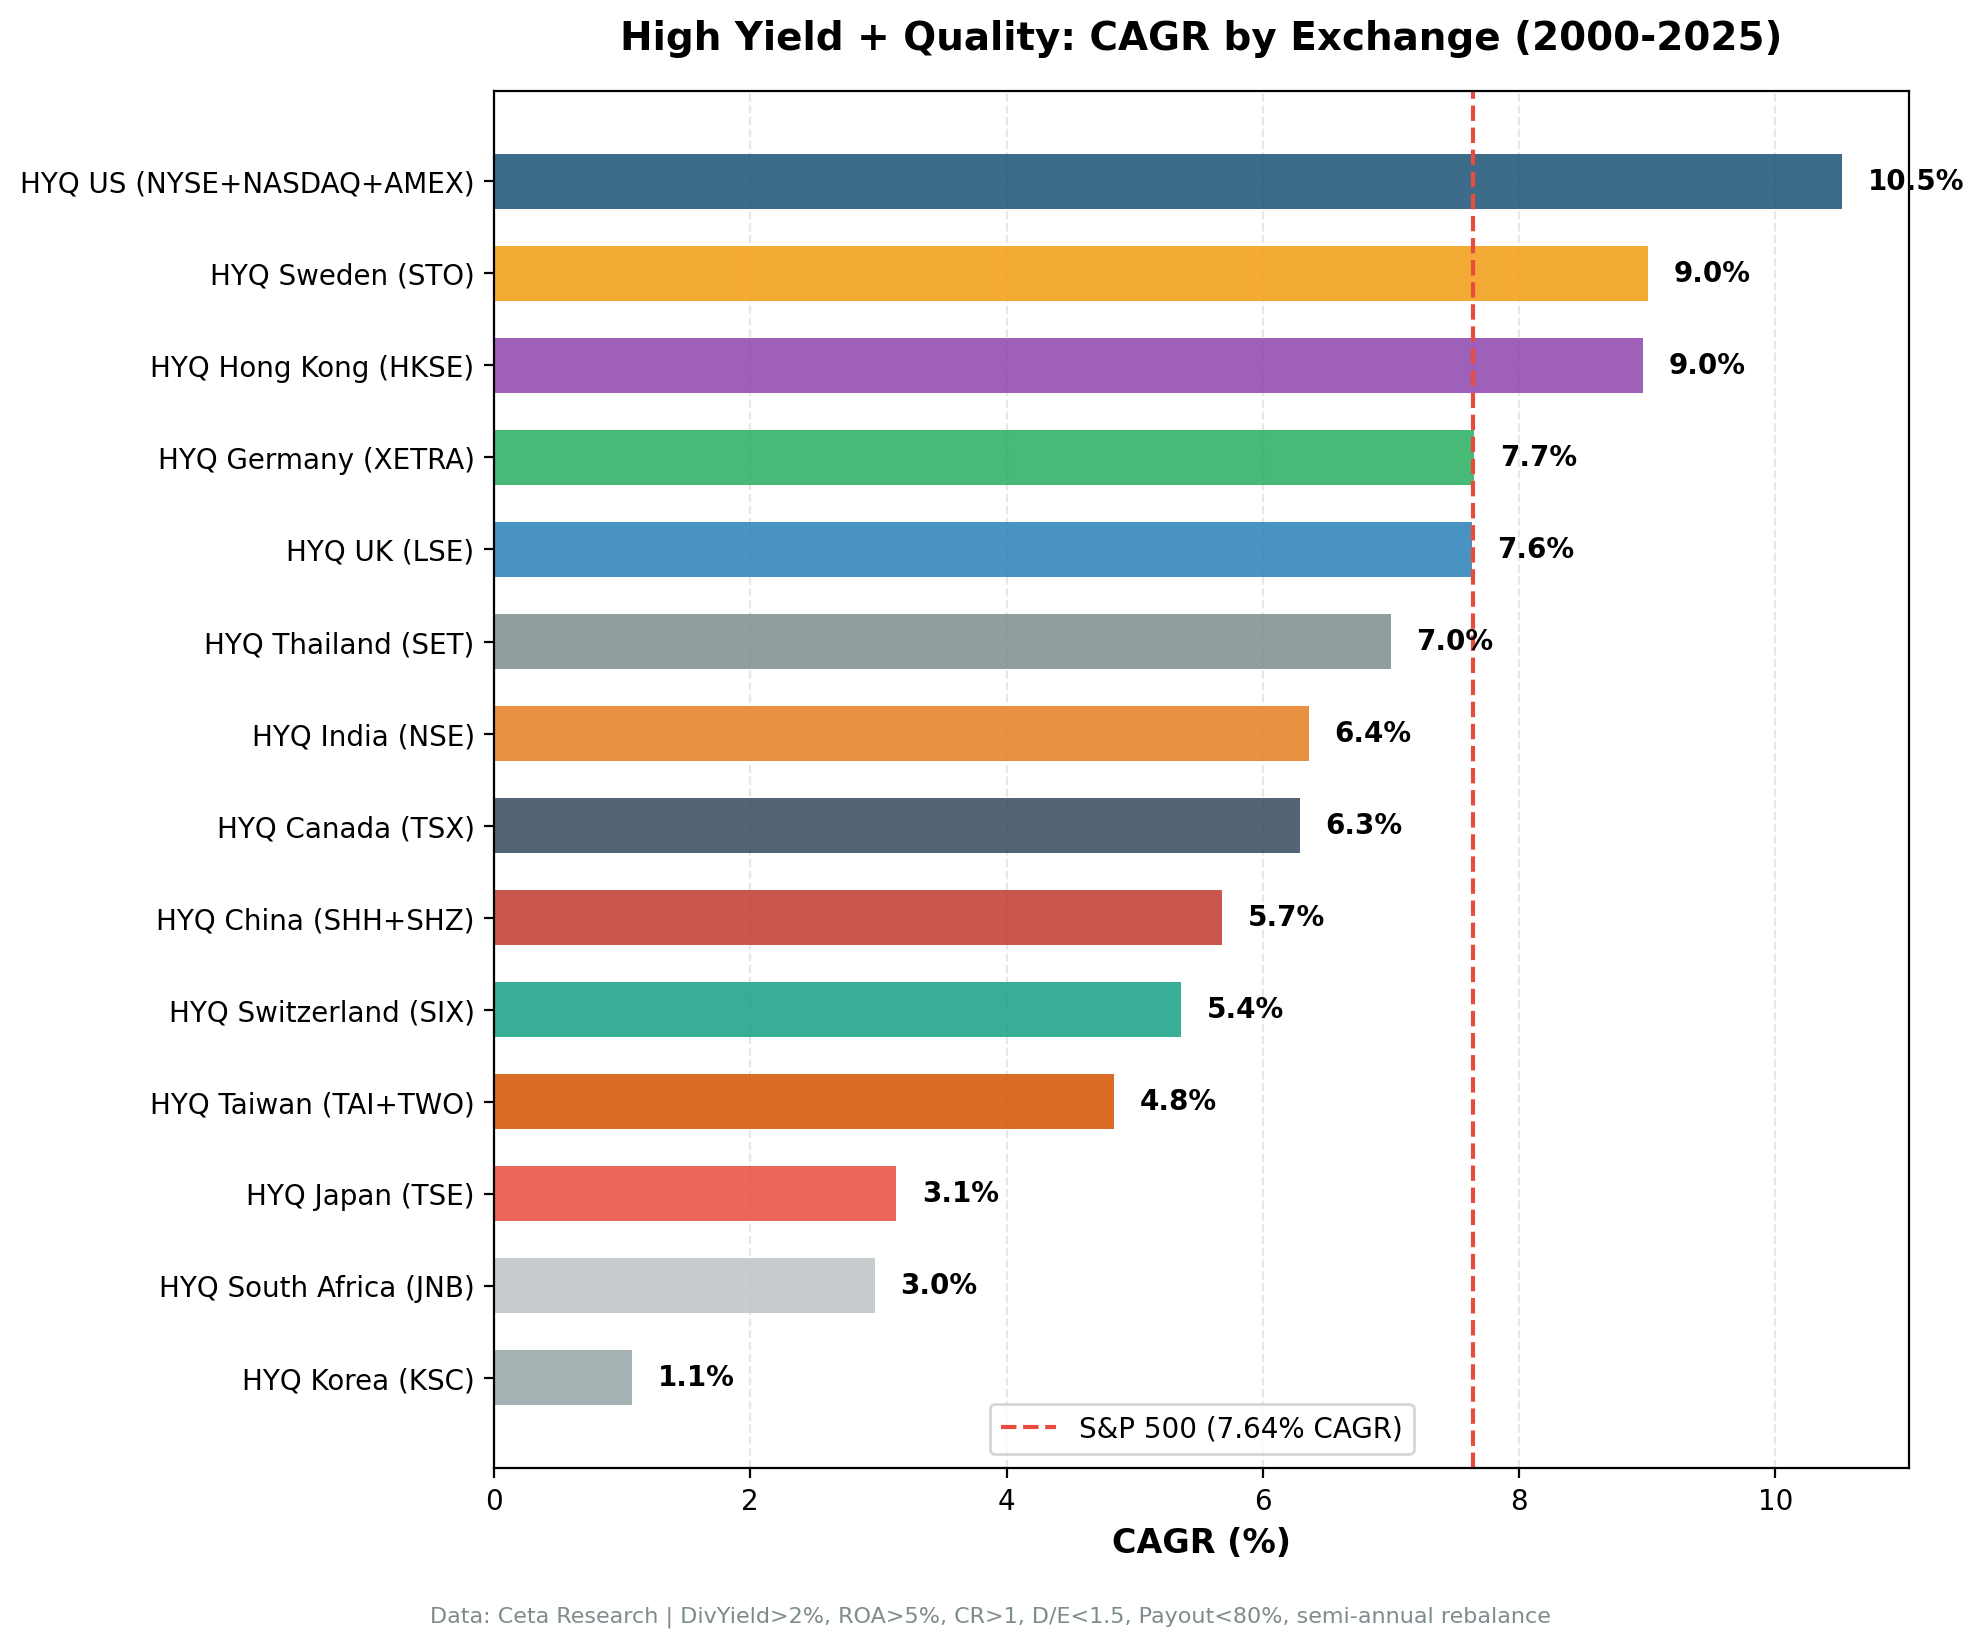
The short answer: it works in most markets. 11 of 13 exchanges produced positive excess returns vs their local index. Hong Kong, UK, and Sweden show the largest excess. The 2 underperformers (India, Korea) sat in cash for 68-88% of the period because their early-2000s markets didn't produce enough 4%+ yielders with the required quality fundamentals.
Data: FMP financial data warehouse, 2000-2025. Updated May 2026.
Method
Data source: Ceta Research (FMP financial data) Period: 2000-2025 (25 years) Signal: Dividend yield 4-15%, payout 0-80%, FCF > 0, ROE > 8%, D/E < 2.0 Portfolio: Top 30 by yield, equal weight, annual July rebalance, cash if < 10 qualify Execution: Next-day close (MOC) Benchmark: Local index for each exchange (Sensex for India, DAX for Germany, etc.)
For full methodology, see our US analysis.
Results: All Exchanges (vs Local Benchmarks)
| Exchange | CAGR | Benchmark | Excess | Sharpe | MaxDD | Cash% |
|---|---|---|---|---|---|---|
| US (NYSE/NASDAQ/AMEX) | 10.52% | S&P 500 7.64% | +2.87% | 0.567 | -30.90% | 0% |
| Sweden (STO) | 9.01% | OMX30 2.95% | +6.05% | 0.373 | -11.45% | 52% |
| Hong Kong (HKSE) | 8.97% | Hang Seng 0.49% | +8.48% | 0.251 | -52.35% | 12% |
| Germany (XETRA) | 7.65% | DAX 4.45% | +3.20% | 0.360 | -41.41% | 16% |
| UK (LSE) | 7.63% | FTSE 100 0.86% | +6.77% | 0.221 | -34.15% | 4% |
| Thailand (SET) | 7.00% | SET Index 4.16% | +2.84% | 0.198 | -41.99% | 24% |
| India (NSE) | 6.36% | Sensex 11.40% | -5.04% | -0.008 | -7.84% | 68% |
| Canada (TSX) | 6.29% | TSX Comp. 4.44% | +1.86% | 0.222 | -39.53% | 20% |
| China (SHH+SHZ) | 5.68% | SSE Comp. 3.54% | +2.14% | 0.089 | -65.68% | 28% |
| Switzerland (SIX) | 5.36% | SMI 1.90% | +3.46% | 0.365 | -20.96% | 44% |
| Taiwan (TAI+TWO) | 4.84% | TAIEX 3.91% | +0.93% | 0.171 | -39.89% | 32% |
| Japan (JPX) | 3.14% | Nikkei 2.95% | +0.19% | 0.257 | -2.16% | 84% |
| Korea (KSC) | 1.08% | KOSPI 3.32% | -2.24% | -0.596 | 0.00% | 88% |
Excluded Exchanges
| Exchange | Reason |
|---|---|
| Saudi Arabia (SAU) | No local index in FMP; falls back to SPY comparison, which isn't meaningful. 6.96% CAGR with 52% cash periods. |
| South Africa (JNB) | Local benchmark (^J203.JO) has no FMP price data; falls back to SPY. 2.97% CAGR with 60% cash and negative Sharpe. |
| Australia (ASX) | Known adjClose split artifacts in FMP data. Returns are unreliable. Skipped. |
| Brazil (SAO) | Same adjClose issues as ASX. Skipped. |
| Singapore (SES/SGX) | 0 symbols in FMP profile table. Skipped. |
Key Findings
1. The signal works in most markets
11 of 13 exchanges with usable data produced positive excess returns vs their local benchmark. The quality-filtered high-yield signal captures a real premium in markets with established dividend cultures: liquid markets where companies have multi-decade histories of paying dividends, with reliable financial data.
2. Highest alphas: Hong Kong, UK, Sweden
After adjusting for beta to the local index (Jensen's alpha):
- Hong Kong: +8.26% alpha vs Hang Seng
- UK: +7.23% alpha vs FTSE 100
- Sweden: +6.56% alpha vs OMX Stockholm 30
- US: +5.17% alpha vs S&P 500
- Switzerland: +4.55% alpha vs SMI
Hong Kong and UK both share a common pattern: the local benchmark has barely returned anything over 25 years (0.49% and 0.86% CAGR respectively), while quality dividend payers in those markets delivered 8-9% CAGR. The quality filter's relative advantage is largest when the broad index is weakest.
3. India and Korea: signal misfit
India (NSE-only) underperforms the Sensex by 5.04% with 68% cash periods. Korea underperforms KOSPI by 2.24% with 88% cash. Both markets have lower dividend payout cultures, and the 4-15% yield floor leaves the strategy in cash for most of the backtest. The signal needs recalibration (lower yield floor or different quality proxies) for these markets.
4. Down capture varies by market
| Exchange | Down Capture (vs local) | Interpretation |
|---|---|---|
| Switzerland | -20.4% | Portfolio gained when SMI fell |
| Sweden | -1.1% | Essentially flat in down periods |
| US | 14.3% | Modest losses vs SPY |
| Germany | 32.1% | Moderate correlation |
| Hong Kong | 33.9% | Moderate correlation with HSI |
| UK | 56.7% | Meaningful but partial losses vs FTSE |
| Canada | 66.6% | Tracks TSX closely in downturns |
Switzerland's negative down capture (-20.4%) is the standout defensive profile: the quality dividend portfolio actually gained on average when the SMI fell. Sweden's near-zero down capture (-1.1%) is similar.
5. High cash rates indicate poor signal fit
Sweden (52% cash), Switzerland (44%), India (68%), Korea (88%), Japan (84%) all have high cash rates. When fewer than 10 stocks pass all filters, the strategy holds cash rather than diluting quality. In markets with thin yield universes, this is the right behavior, but it limits returns.
Country-Specific Observations
US: Still the flagship result by CAGR. 0% cash, 23.1 avg stocks, +2.87% excess vs S&P 500, +5.17% Jensen alpha. The deepest dividend market with the most quality data. Full US analysis →
Sweden: 9.01% CAGR, +6.05% excess vs OMX30, with only -11.45% max drawdown. The lowest drawdown of any non-Japan exchange. 52% cash periods limit the win count, but invested years are strong.
Hong Kong: Largest local alpha (+8.26%). The Hang Seng returned just 0.49% over 25 years; quality dividend payers delivered 8.97%. 80% win rate. Full HK analysis →
Germany: +3.20% excess vs DAX with 16% cash periods. German Mittelstand companies provide a steady pool of dividend payers. 56% win rate. Full Germany analysis →
UK: +6.77% excess vs FTSE 100. The FTSE barely returned anything over 25 years; quality filters multiplied the index return ninefold. 72% win rate. Full UK analysis →
India: NSE-only result disappoints at 6.36% CAGR (-5.04% vs Sensex). The strategy holds cash for 68% of periods, missing most of India's 2003-2014 bull market. When invested from 2017, returns are strong (+13.4% to +42.8% excess). Signal calibration needed. Full India analysis →
Canada: +1.86% excess vs TSX Composite. Modest alpha; the strategy's heavy banks-and-energy tilt mostly mirrors the index. 60% win rate. Full Canada analysis →
Switzerland: +3.46% excess vs SMI with negative down capture (-20.4%). The most defensive profile in the study. 44% cash periods.
Thailand: 7.00% CAGR vs SET 4.16%. +2.84% excess. Decent result with 24% cash.
China: 5.68% CAGR vs SSE 3.54%. +2.14% excess but with -65.7% max drawdown (China's 2008 + 2015 crashes hit the portfolio hard).
Taiwan: Modest +0.93% excess; the screen barely beats TAIEX.
Japan: Marginal +0.19% excess but with 84% cash. The 4-15% yield threshold doesn't fit Japanese payout culture.
Korea: -2.24% vs KOSPI with 88% cash. Same diagnosis as Japan; the signal needs different thresholds.
Limitations
Threshold calibration: The 4-15% yield range was designed for the US market. Markets with lower dividend cultures (Japan, Korea, India) need different thresholds. This is the primary failure mode.
Currency effects: All returns are in local currency. A portfolio earning 6.36% in INR differs from 6.36% in USD after currency conversion. Cross-exchange CAGR comparisons don't account for this.
Data quality varies: FMP data completeness differs by exchange and time period. Markets with shorter data histories produce less reliable backtests.
Benchmark selection: We use each exchange's primary index as the local benchmark. Index composition varies in concentration and sector weight. The FTSE 100 (mega-cap only) is a much narrower benchmark than the S&P 500 or DAX.
Cash drag: Many regional results are partly a story of when the strategy was invested. Sweden and Switzerland sat in cash for 44-52% of the period; the headline CAGR averages cash years with invested years.
Takeaway
The high dividend yield quality screen works in markets where dividend culture is established and the yield threshold is appropriate. US, Sweden, Hong Kong, Germany, UK, Switzerland, Thailand, Canada all produce positive excess returns vs their local indices.
India and Korea are the cautionary cases: the strategy sits in cash for most of the backtest and misses the local bull markets. The 4-15% yield threshold is the wrong calibration for those markets.
The consistent lesson: benchmark against the local index, run on clean exchange data, and check your cash rate. A strategy holding cash 68% of the time isn't a dividend strategy; it's mostly a cash fund with occasional equity bets.
Data: Ceta Research (FMP financial data warehouse). 15 exchange presets tested, 13 included in comparison (Saudi and South Africa excluded because no local index price data is available in FMP). Backtest: 2000-2025, annual July rebalance, next-day close execution (MOC), equal weight top 30, size-tiered transaction costs. Local index benchmarks for each exchange. India corrected from BSE+NSE to NSE-only to eliminate dual-listing duplication. Past performance does not guarantee future results. This is educational content, not investment advice.
Run This Screen Yourself
The full backtest code (Python + DuckDB) is available in our GitHub repository.
# Run on any exchange
python3 high-yield-quality/backtest.py --preset us
python3 high-yield-quality/backtest.py --preset india
python3 high-yield-quality/backtest.py --global --output results/exchange_comparison.json
Get your API key at cetaresearch.com.
References
- Fama, E. & French, K. (1998). "Value versus Growth: The International Evidence." Journal of Finance, 53(6), 1975-1999.


