
Yield Gap Strategy: 20-Market Backtest Results (2000-2025)

Contents
- What We Tested
- Full Results Table
- The Pattern
- Notable Observations
- Run a Global Screen Yourself
- Limitations
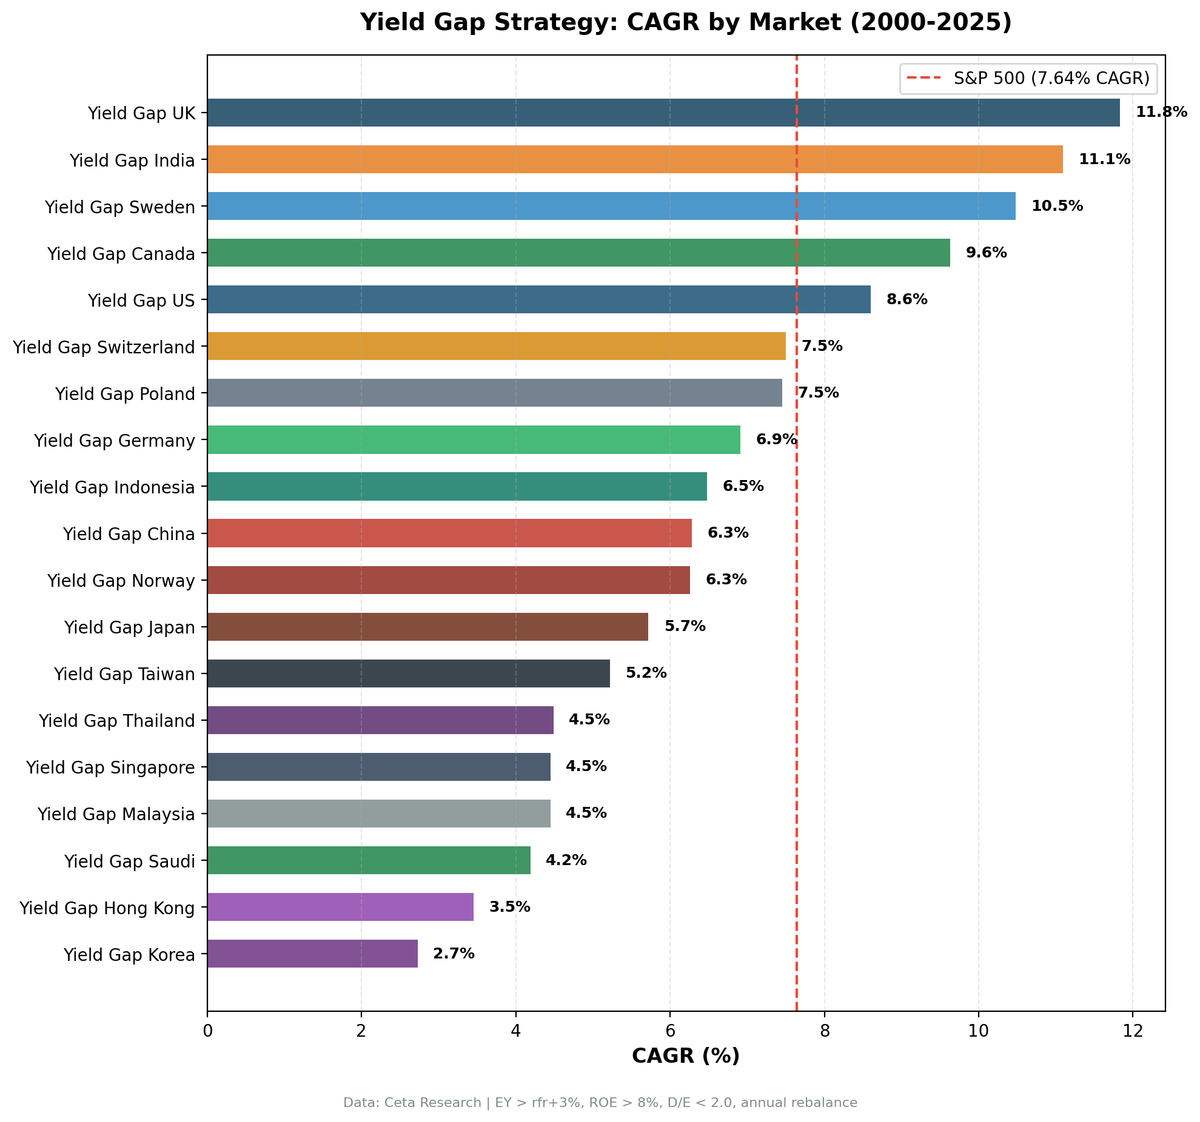
The yield gap strategy, buy stocks where earnings yields exceed government bond rates, filter for quality, has an intuitive theoretical foundation. Stocks offering a wide spread over risk-free rates should mean-revert toward fair value. We tested this across 20 equity markets to see where that theory holds, where it doesn't, and why.
it works in Western markets with value-oriented investor bases and underperforms in Asian growth markets. Four markets beat SPY. Sixteen didn't.

What We Tested
Signal (per exchange): - Earnings yield > max(6%, regional_rfr + 3%), threshold adapts to each market's risk-free rate - Earnings yield < 50% (cap for distress/data errors) - ROE > 8% - D/E < 2.0
Effective thresholds by market: - US, Germany, Japan: 6.0% EY (rfr ≈ 2%, floor binds) - UK: 6.5% EY (rfr = 3.5%) - Korea: 6.0% EY (rfr = 3%, floor binds) - India: 9.5% EY (rfr = 6.5%) - South Africa: 12.0% EY (rfr = 9%), excluded from content (84% cash)
Methodology: Annual rebalance, January. Top 30 stocks per exchange by highest earnings yield, equal weight. Cash if fewer than 10 qualify. FY financial data with 45-day filing lag (point-in-time). Full details at github.com/ceta-research/backtests/blob/main/METHODOLOGY.md.
Full Results Table
| Exchange | EY Threshold | CAGR | SPY | Excess | Sharpe | MaxDD | Cash% | Avg Stocks |
|---|---|---|---|---|---|---|---|---|
| LSE (UK) | 6.5% | 11.83% | 7.64% | +4.19% | 0.423 | -34.75% | 0% | 17.5 |
| BSE/NSE (India) | 9.5% | 11.09% | 7.64% | +3.45% | 0.124 | -59.46% | 20% | 25.6 |
| STO (Sweden) | 6.0% | 10.48% | 7.64% | +2.84% | 0.344 | -42.00% | 12% | 26.5 |
| TSX (Canada) | 6.0% | 9.63% | 7.64% | +1.98% | 0.364 | -44.16% | 0% | 23.8 |
| NYSE/NAS/AMEX (US) | 6.0% | 8.60% | 7.64% | +0.96% | 0.327 | -42.27% | 0% | 22.0 |
| SIX (Switzerland) | 6.0% | 7.50% | 7.64% | -0.14% | 0.397 | -33.42% | 0% | 15.9 |
| WSE (Poland)* | 8.0% | 7.45% | 7.64% | -0.19% | 0.133 | -18.02% | 32% | 16.4 |
| XETRA (Germany) | 6.0% | 6.91% | 7.64% | -0.73% | 0.256 | -47.01% | 0% | 19.5 |
| JKT (Indonesia) | 6.0% | 6.48% | 7.64% | -1.16% | 0.227 | -36.01% | 28% | 26.0 |
| SHZ/SHH (China) | 6.0% | 6.28% | 7.64% | -1.37% | 0.091 | -68.49% | 0% | 21.8 |
| OSL (Norway)* | 6.0% | 6.26% | 7.64% | -1.38% | 0.163 | -48.75% | 44% | 13.9 |
| JPX (Japan) | 6.0% | 5.72% | 7.64% | -1.93% | 0.296 | -49.40% | 16% | 28.4 |
| TAI/TWO (Taiwan) | 6.0% | 5.22% | 7.64% | -2.42% | 0.166 | -45.29% | 24% | 28.2 |
| SET (Thailand) | 6.0% | 4.49% | 7.64% | -3.16% | 0.083 | -50.60% | 20% | 27.6 |
| SES (Singapore)† | 6.0% | 4.45% | 7.64% | -3.19% | 0.087 | -48.32% | 20% | 14.2 |
| KLS (Malaysia) | 6.0% | 4.45% | 7.64% | -3.19% | 0.146 | -34.18% | 28% | 22.4 |
| SAU (Saudi Arabia)* | 6.5% | 4.19% | 7.64% | -3.45% | 0.042 | -46.52% | 32% | 26.2 |
| HKSE (Hong Kong) | 6.0% | 3.45% | 7.64% | -4.19% | 0.017 | -66.27% | 0% | 20.4 |
| KSC (Korea) | 6.0% | 2.73% | 7.64% | -4.92% | -0.013 | -46.06% | 24% | 27.3 |
| JNB (S. Africa)‡ | 12.0% | -0.37% | 7.64% | -8.02% | -1.588 | -24.32% | 84% | 14.8 |
* Comparison only, high cash periods (WSE: 32%, OSL: 44%, SAU: 32%). Insufficient invested years for a standalone blog. † Singapore: data quality caution, sub-SGD 1 price filter may exclude a meaningful subset of smaller stocks. ‡ South Africa excluded from all content, 84% cash at 12% EY threshold (rfr=9%+3%). Only 4 of 25 years invested. Not statistically meaningful.
The Pattern
Western value markets outperformed. The UK, Sweden, Canada, and the US all delivered positive excess returns. Switzerland was roughly neutral (-0.14%). These markets share common characteristics: corporate governance that emphasizes earnings quality, conservative accounting norms, and investor bases that have historically priced stocks on fundamental value metrics rather than growth optionality.
Asian growth markets underperformed. Japan, China, Taiwan, South Korea, Thailand, Singapore, Malaysia, Indonesia, and Hong Kong all underperformed SPY. The magnitude varies. Japan (-1.93%) and China (-1.37%) were relatively close, but the direction is consistent.
Why the divergence? A few structural explanations:
- Value vs growth market cultures. Asian equity markets, particularly Taiwan, South Korea, and China, have historically attracted capital based on growth narratives, semiconductors, manufacturing, e-commerce. High-earnings-yield companies in these markets may be structurally cheap because capital flows to growth businesses, not because they're temporarily mispriced.
- Currency headwinds. All returns are in local currency. JPY, KRW, TWD, and THB have weakened against USD over the long run. A USD investor would experience additional drag that the local-currency backtest doesn't capture.
- Korea discount. Korean conglomerates (chaebols) have long traded at a significant discount to intrinsic value due to governance concerns and complex cross-shareholding structures. The earnings yield may be "high" because investors structurally discount Korean earnings. This isn't a yield gap that closes, it may be a permanent discount.
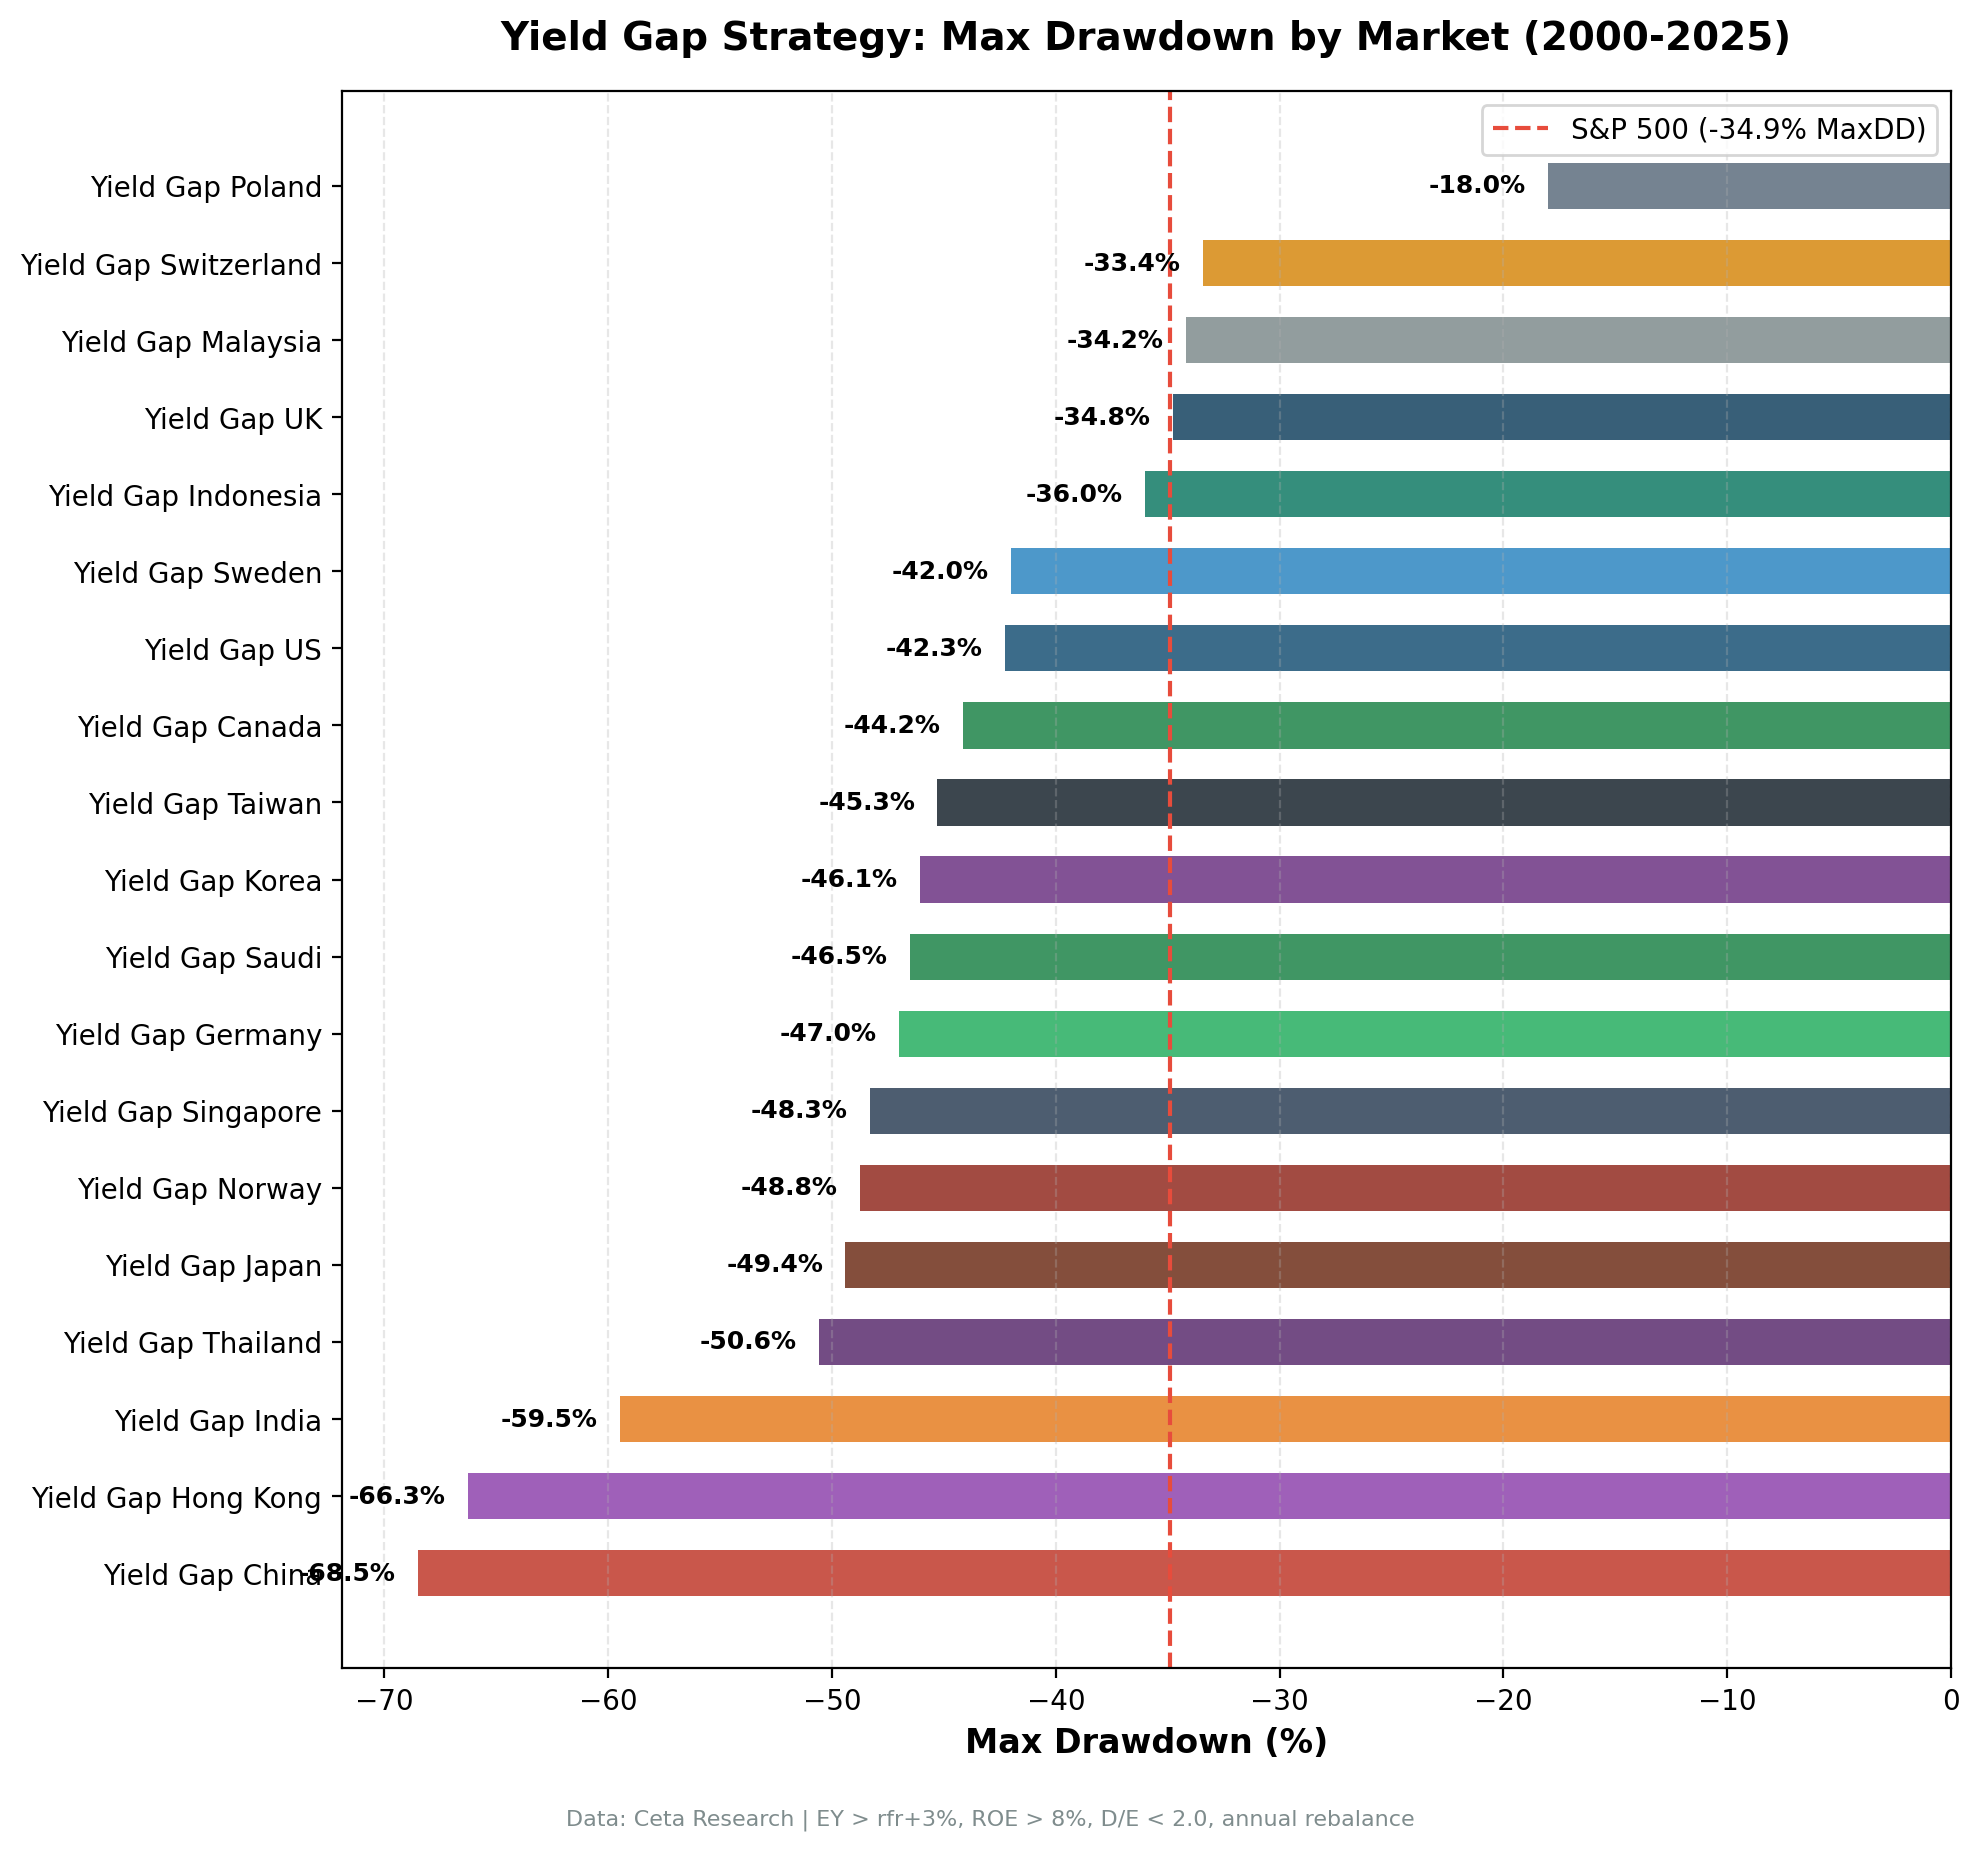
- Hong Kong specific factors. Hong Kong's yield gap portfolio had 0% cash (enough qualifying stocks) but delivered only 3.45% CAGR with a 66.27% max drawdown. The increasing political and economic integration with mainland China has created uncertainty premia that depress equity valuations, but that uncertainty hasn't been resolved, so the discount hasn't closed.
Notable Observations
Switzerland: best Sharpe, near-zero alpha. The SIX exchange returned 7.50% CAGR (-0.14% vs SPY) with a Sharpe ratio of 0.397, the highest Sharpe in our study. Swiss quality value stocks are very stable, with low drawdowns (-33.42%) and consistent performance, but the market is efficient enough that the yield gap doesn't generate meaningful alpha. Close to a fair price for what it offers.
Poland: lowest max drawdown. WSE returned -0.19% excess with a maximum drawdown of just -18.02%, the lowest of any market. Poland's market is relatively illiquid and the high cash frequency (32%) means the strategy is only invested in 17 of 25 years. The low drawdown reflects both the conservative nature of qualifying Polish stocks and the cash cushion.
India's volatility. The second-highest excess return (+3.45%) comes with a Sharpe of 0.124, one of the lowest, because the annual returns are extremely dispersed. +102.79% in 2007, -59.46% in 2008, +86.19% in 2009. The excess return is real but the ride is genuinely rough.
South Africa is excluded, not underperforming. At a 12% EY threshold (rfr=9%+3%), only 4 of 25 years had enough qualifying stocks. That's not a strategy, it's effectively a "no signal" condition. South Africa is excluded from this analysis, not ranked as a poor performer.
Run a Global Screen Yourself
-- Global yield gap screen (EY > 6% floor, all markets)
SELECT
 k.symbol,
 p.companyName,
 p.exchange,
 p.sector,
 ROUND(k.earningsYieldTTM * 100, 2) AS earnings_yield_pct,
 ROUND(1.0 / NULLIF(k.earningsYieldTTM, 0), 1) AS implied_pe,
 ROUND(k.returnOnEquityTTM * 100, 2) AS roe_pct,
 ROUND(fr.debtToEquityRatioTTM, 2) AS debt_to_equity,
 ROUND(k.freeCashFlowYieldTTM * 100, 2) AS fcf_yield_pct,
 ROUND(k.marketCap / 1e9, 2) AS mktcap_b
FROM key_metrics_ttm k
JOIN profile p ON k.symbol = p.symbol
JOIN financial_ratios_ttm fr ON k.symbol = fr.symbol
WHERE k.earningsYieldTTM > 0.06
 AND k.earningsYieldTTM < 0.50
 AND k.returnOnEquityTTM > 0.08
 AND (fr.debtToEquityRatioTTM IS NULL
 OR (fr.debtToEquityRatioTTM >= 0 AND fr.debtToEquityRatioTTM < 2.0))
 AND k.marketCap > 500000000
 AND (p.industry IS NULL OR p.industry NOT LIKE 'Asset Management%')
 AND (p.industry IS NULL OR p.industry NOT LIKE 'Shell Companies%')
 AND (p.industry IS NULL OR p.industry NOT LIKE 'Closed-End Fund%')
ORDER BY k.earningsYieldTTM DESC
LIMIT 30
Run this query on Ceta Research Data Explorer
Run the full global backtest:
git clone https://github.com/ceta-research/backtests.git
cd backtests
pip install -r requirements.txt
python3 yield-gap/backtest.py --global --output results/exchange_comparison.json
Limitations
All returns in local currency. Currency depreciation against USD adds a layer of drag for international investors that the backtests don't capture. Japan, India, Indonesia, and Southeast Asian currencies have all weakened against USD over this period.
SPY as benchmark for all markets. SPY is the global capital cost benchmark used here, if you're deploying capital globally, SPY is the relevant alternative. If you're a local investor in each country, your benchmark and opportunity cost are different.
Survivorship bias exists across all markets. FMP's coverage of delisted and acquired companies varies by market. Emerging markets with less data standardization may have more survivorship bias.
The look-ahead risk is different across markets. Point-in-time logic (45-day FY filing lag) is most reliable in markets with strict filing deadlines. In markets with more variable reporting timelines (some emerging markets), the lag may not fully prevent look-ahead.
Part of a Series: US | UK | Sweden | India | Canada
Data: Ceta Research (FMP financial data warehouse), January 2000 through December 2025. Results for 19 exchanges (JNB excluded). Full methodology: github.com/ceta-research/backtests/blob/main/METHODOLOGY.md.
Academic references: Campbell, J.Y. & Vuolteenaho, T. (2004). "Bad Beta, Good Beta." American Economic Review, 94(5). Damodaran, A. (2012). "Equity Risk Premiums (ERP): Determinants, Estimation and Implications." Stern School of Business.


