
Yield Gap India: Why the Screen Trails the Sensex (2000-2025)
India's 6.5% risk-free rate sets a strict 9.5% earnings yield bar, too strict to fill a portfolio in seven of 25 years. NSE yield gap stocks returned 7.17% CAGR against the Sensex's 11.40%. Over the 15 years the screen ran every January, it beat the Sensex by 2.57 points a year.

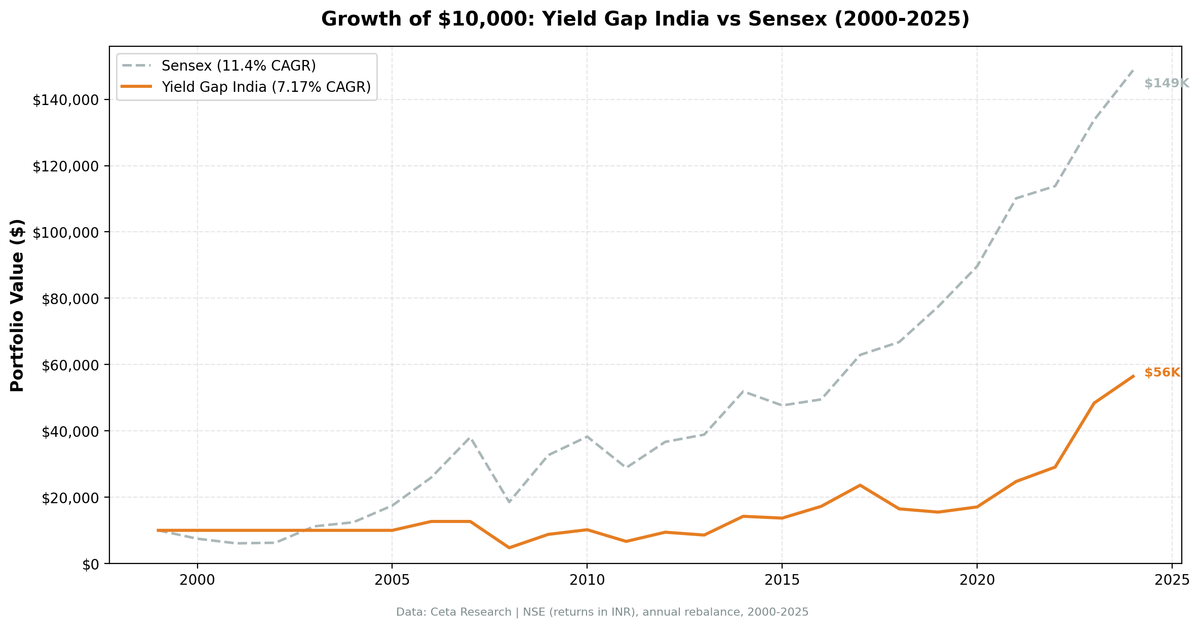
title: "Yield Gap India: Why the Screen Trails the Sensex (2000-2025)" slug: yield-gap-india-backtest publish_date: 2026-03-26 tags: [backtests, india-markets, value-investing, earnings-yield, NSE] post_access: public excerpt: "India's 6.5% risk-free rate sets a strict 9.5% earnings yield bar, too strict to fill a portfolio in seven of 25 years. NSE yield gap stocks returned 7.17% CAGR against the Sensex's 11.40%. Over the 15 years the screen ran every January, it beat the Sensex by 2.57 points a year." authors: [Swas] feature_image: 1_india_cumulative_growth.png feature_image_alt: "Growth of $10,000: Yield Gap India vs Sensex (2000-2025)"
Contents
Data: FMP financial data warehouse, 2000-2025. Updated September 2026.
The yield gap threshold for India is strict. With a risk-free rate of 6.5% (long-run average for Indian government bonds), the screen requires earnings yields above 9.5%, equivalent to PE ratios below roughly 10.5x. That's a demanding bar, and for seven of the 25 years it was too demanding to assemble a portfolio at all. Over the full window the strategy returned 7.17% CAGR against the Sensex's 11.40%, trailing the local index by 4.23 points a year. It also trails SPY's 7.64%.
That headline is dominated by the years the screen couldn't run. Over 2010 to 2024, when it was invested every single January, it returned 13.20% a year against the Sensex's 10.63%. Both numbers are in this post, because you need both to decide anything.
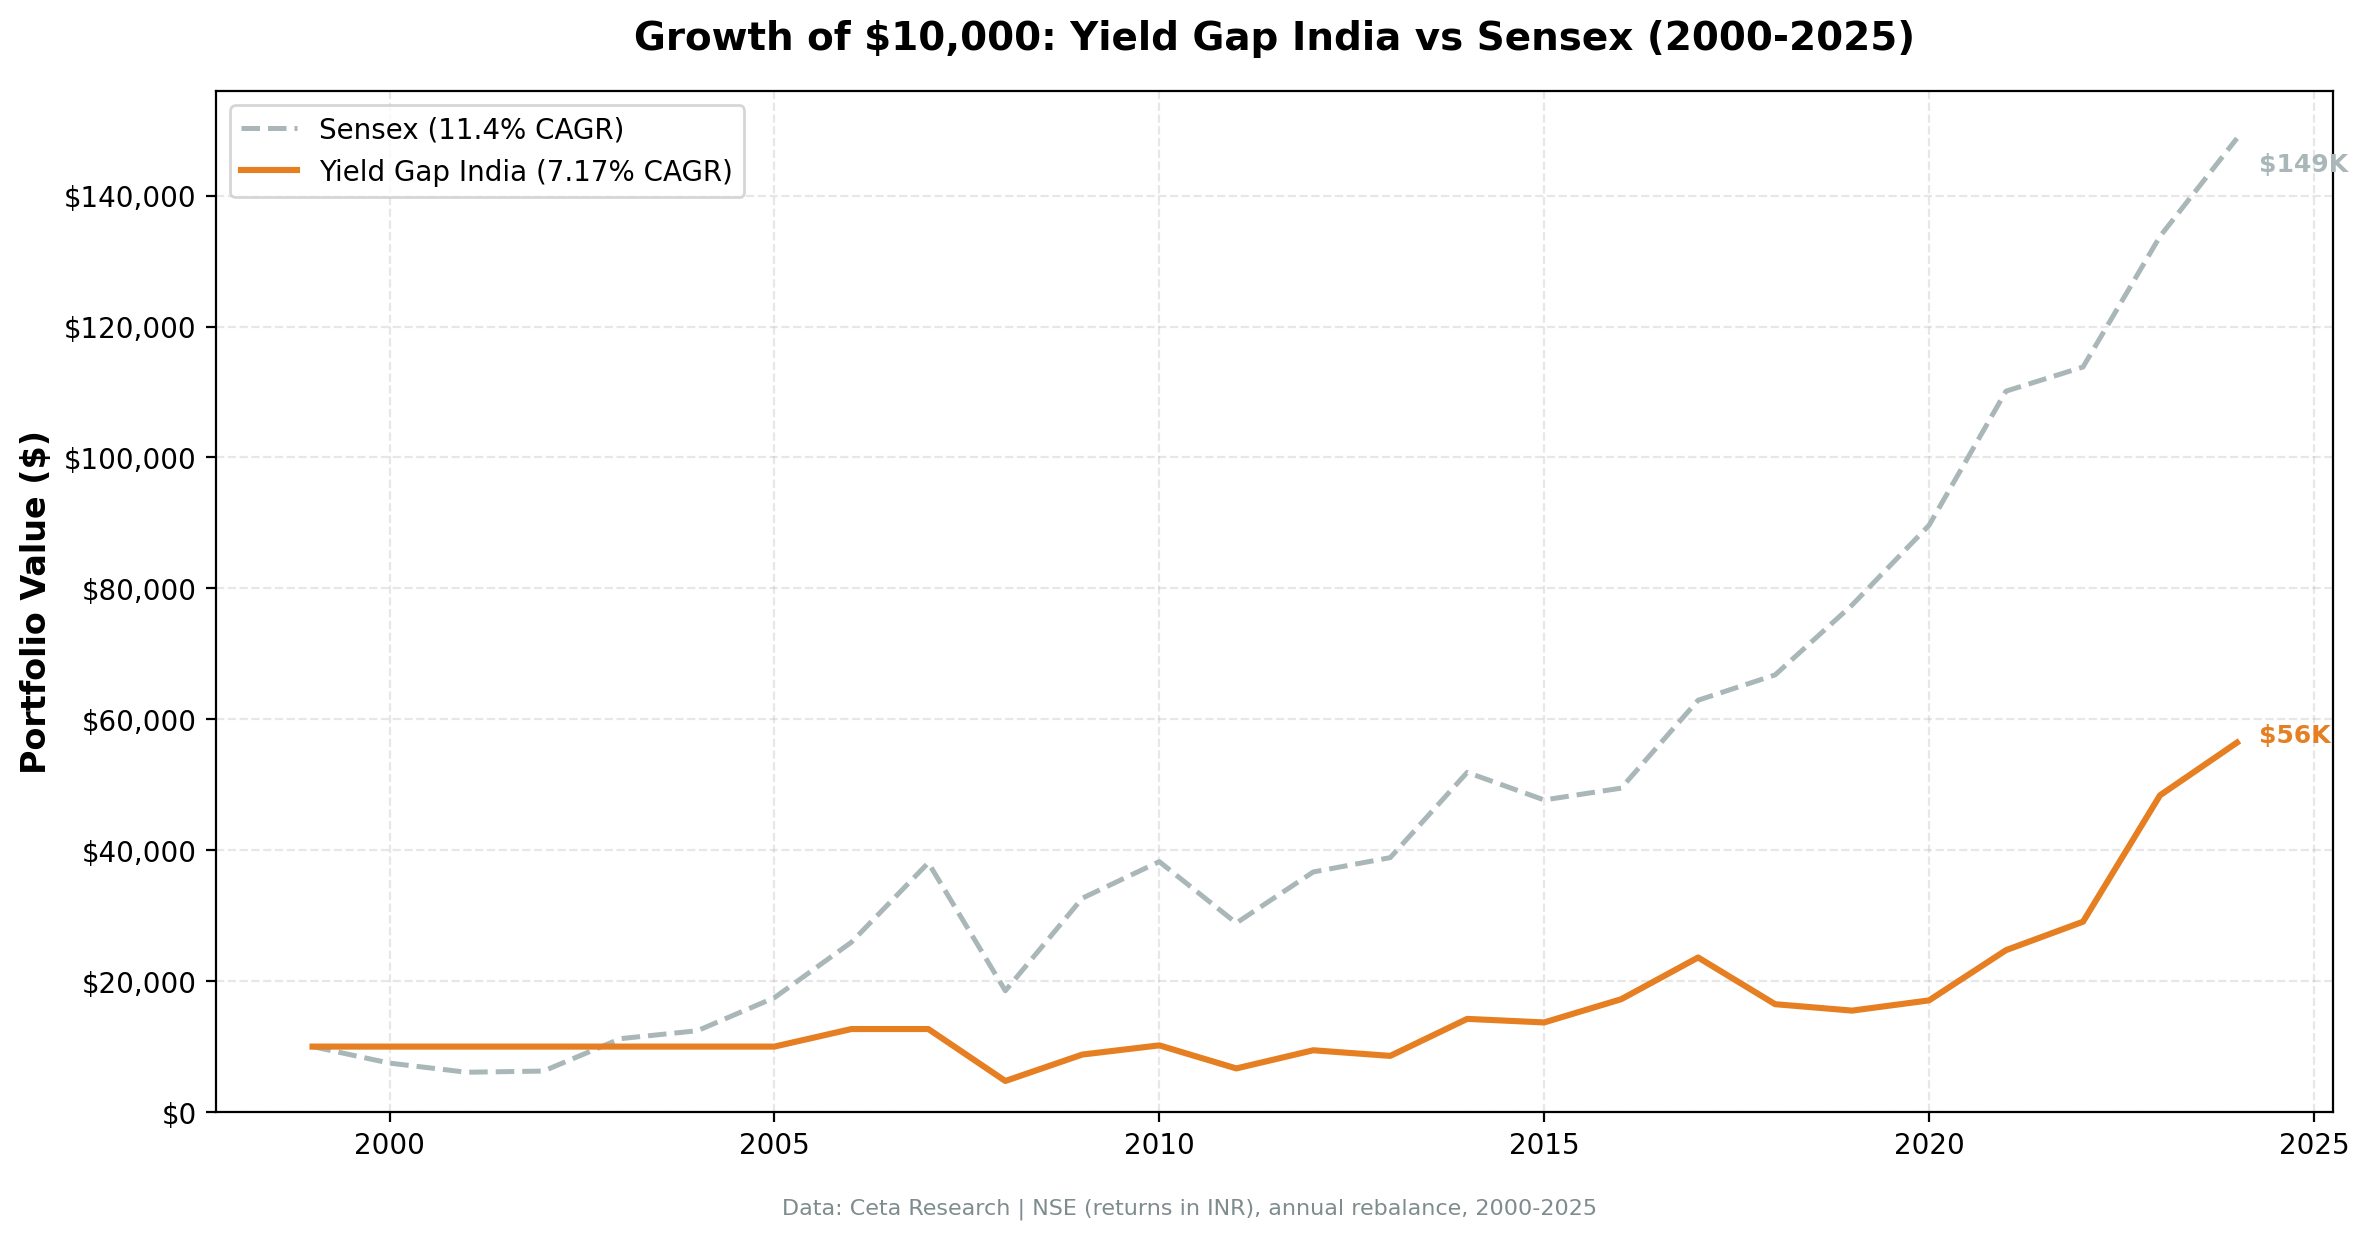
A $10,000 investment grew to $56,444 over the full 25-year period (2000-2025). The same money in the Sensex grew to roughly $148,700.
The Strategy
India's high inflation and high nominal interest rates mean the risk-free rate sets a meaningful bar for equity compensation. The yield gap threshold of rfr + 3% gives 9.5% EY, more than 50% above the 6% floor used in the US, Germany, and Japan. Only South Africa's 12% bar is higher, and that one was so strict the portfolio sat in cash for 23 of 25 years.
Signal: - Earnings yield > max(6%, 6.5% + 3%) = 9.5% for India (PE < ~10.5x) - Earnings yield < 50% - ROE > 8% - D/E < 2.0
Portfolio construction: Top 30 by highest earnings yield, equal weight, annual January rebalance. Cash if fewer than 10 stocks qualify. The portfolio held cash in all six years from 2000-2005 due to limited FY data coverage, and again in 2007. From 2008 onward it was invested every year.
Methodology
- Universe: NSE (National Stock Exchange)
- Market cap filter: INR 20B+ at each rebalance date (~$240M USD equivalent)
- Data period: January 2000 through January 2025 (25 annual periods)
- Invested periods: 18 of 25 years (7 zero-return cash years: 2000-2005 and 2007)
- Rebalancing: Annual (January)
- Point-in-time data: FY filings with 45-day filing lag
- Transaction costs: Size-tiered model
- Benchmark: Sensex (BSE Sensex, local Indian benchmark)
- Data source: Ceta Research FMP financial data warehouse
Data coverage note: FMP's FY earnings yield data for Indian stocks is reliable from 2006 onward on NSE. The 2000-2005 period shows zero returns, which is not portfolio performance but a reflection of insufficient data to screen meaningful positions. 2007 is a different case: the screen found only 10 qualifying names and just 8 of them had a usable entry price, below the 10-stock floor, so the backtest held cash. The 7.17% CAGR is computed over the full 25-year period including all seven zero-return years. The invested-period picture is much stronger and is broken out below.
Full methodology at github.com/ceta-research/backtests/blob/main/METHODOLOGY.md.
Results
| Metric | Yield Gap India | Sensex |
|---|---|---|
| CAGR | 7.17% | 11.40% |
| Total return (25yr) | 464.4% | 1,387.3% |
| Max drawdown | -62.58% | -51.34% |
| Sharpe ratio | 0.02 | 0.165 |
| Down capture vs Sensex | 79.0% | n/a |
| Win rate vs Sensex | 48.0% | n/a |
| Cash periods | 7 of 25 years (28%) | n/a |
| Avg stocks (invested) | 26.1 | n/a |
The strategy trails the Sensex by 4.23% annually over the full window, and it trails SPY as well (7.17% vs 7.64%). This is the honest picture. On a 25-year view, an Indian investor holding a Sensex tracker did better than this screen, and so did a global investor holding SPY.
But the full window isn't the whole story, and it would be lazy to stop there. Seven of the 25 rebalances never happened: six because FMP has no usable FY fundamentals for NSE before 2006, one (2007) because only 10 names cleared the 9.5% bar and only 8 of those had a usable entry price. Zero-return years compound against you when the index is rising, and 2003 and 2005 alone were Sensex years of +79.09% and +40.59%.
Split the record at 2010, the point from which the screen ran every January without a gap:
| Period | Portfolio | Sensex | Gap |
|---|---|---|---|
| 2000-2009 (3 of 10 years invested) | -1.29%/yr | +12.57%/yr | -13.86 pts |
| 2010-2024 (15 of 15 years invested) | +13.20%/yr | +10.63%/yr | +2.57 pts |
The signal works in India. The coverage doesn't, at least not before 2010. Which of those two numbers you should act on depends on whether you believe FMP's pre-2006 NSE gap is a data problem or a genuine absence of qualifying companies. We think it's the former, which makes the 25-year headline pessimistic, but we publish it because we can't prove it.
The Sharpe of 0.02 reflects both the cash drag and genuine dispersion: -63% in 2008, then +85% in 2009. The underlying market is volatile and the screen amplifies it.
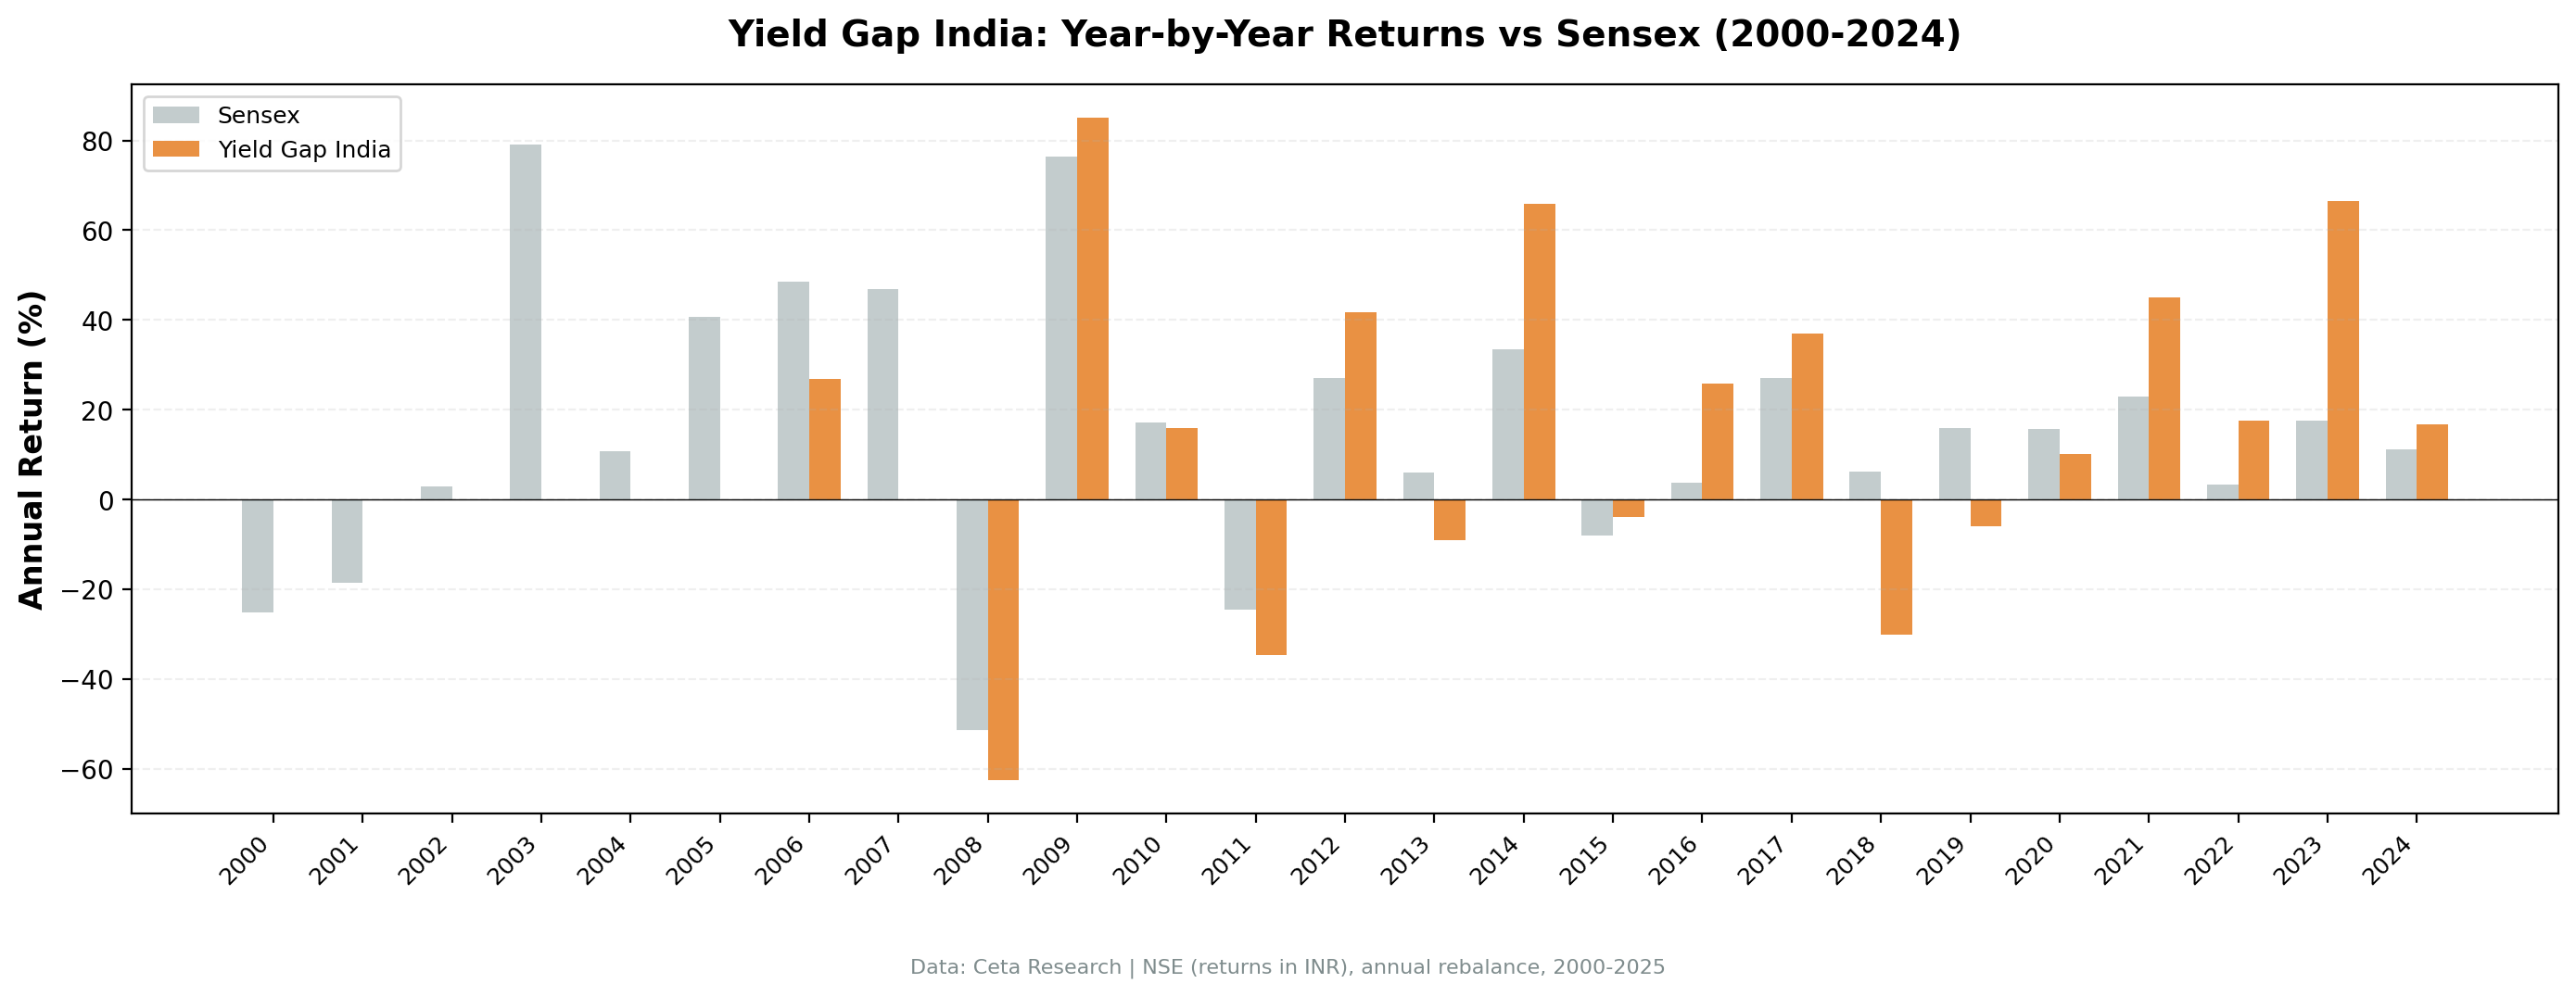
Annual returns (portfolio vs Sensex):
| Year | Portfolio | Sensex | Excess | Note |
|---|---|---|---|---|
| 2000 | 0.00% | -25.23% | +25.23% | Cash, data gap |
| 2001 | 0.00% | -18.65% | +18.65% | Cash, data gap |
| 2002 | 0.00% | +2.93% | -2.93% | Cash, data gap |
| 2003 | 0.00% | +79.09% | -79.09% | Cash, data gap |
| 2004 | 0.00% | +10.83% | -10.83% | Cash, data gap |
| 2005 | 0.00% | +40.59% | -40.59% | Cash, data gap |
| 2006 | +26.82% | +48.48% | -21.66% | First invested year |
| 2007 | 0.00% | +46.79% | -46.79% | Cash, 8 of 10 buyable |
| 2008 | -62.58% | -51.34% | -11.24% | Worst year |
| 2009 | +85.10% | +76.32% | +8.77% | Recovery |
| 2010 | +15.98% | +17.10% | -1.12% | |
| 2011 | -34.59% | -24.53% | -10.06% | |
| 2012 | +41.64% | +27.04% | +14.60% | |
| 2013 | -9.10% | +5.96% | -15.05% | |
| 2014 | +65.90% | +33.51% | +32.39% | Modi election rally |
| 2015 | -3.83% | -8.12% | +4.29% | |
| 2016 | +25.91% | +3.79% | +22.11% | |
| 2017 | +37.01% | +27.14% | +9.87% | |
| 2018 | -30.22% | +6.15% | -36.37% | Worst invested year, relative |
| 2019 | -5.96% | +15.98% | -21.94% | |
| 2020 | +10.10% | +15.74% | -5.63% | |
| 2021 | +44.98% | +22.85% | +22.13% | |
| 2022 | +17.55% | +3.35% | +14.20% | |
| 2023 | +66.41% | +17.53% | +48.88% | Best excess return |
| 2024 | +16.65% | +11.20% | +5.45% |
The Indian Market Story
2007 is the year that isn't there. The Sensex ran +46.79% and the portfolio sat in cash, a 46.79-point hole in the record. Only 10 NSE companies cleared a 9.5% earnings yield with ROE above 8% and debt-to-equity below 2, and two of those had no usable entry price. A 30-stock screen that returns 8 tradeable names isn't a portfolio, so the backtest declines to call it one. This is the single largest reason the 25-year number looks the way it does, and it's a coverage failure rather than a strategy failure.
2008 was brutal. -62.58% in a single year, 11 points worse than the Sensex's -51.34%. The high-EY threshold means the portfolio holds companies with PE ratios below 10.5x, often cyclical or capital-intensive businesses that are more exposed when credit tightens and growth slows. The max drawdown is deeper than the Sensex's because the screen selects for cheap-but-exposed names.
2014 was the Modi rally. +65.90% vs Sensex +33.51% (+32.39% excess). The BJP election victory in May 2014 triggered a broad re-rating of Indian equities, and value stocks that had underperformed for years snapped back sharply. Companies trading at single-digit multiples found buyers.
2018 was the worst invested year in relative terms. -30.22% vs Sensex +6.15% (-36.37% excess). Indian value stocks sold off hard while the Sensex was carried by large-cap IT and consumer names. The 9.5% threshold keeps the portfolio in smaller, more cyclical companies that underperform in quality-flight years.
2023 showed the strategy's episodic strength. +66.41% vs Sensex +17.53% (+48.88% excess). When Indian mid-cap industrials and financials ran, the screen caught the bulk of the move. The problem is you can't know in advance which years these will be.
Run It Yourself
Current India yield gap screen:
SELECT
    k.symbol,
    p.companyName,
    p.exchange,
    p.sector,
    ROUND(k.earningsYieldTTM * 100, 2) AS earnings_yield_pct,
    ROUND(1.0 / NULLIF(k.earningsYieldTTM, 0), 1) AS implied_pe,
    ROUND(k.returnOnEquityTTM * 100, 2) AS roe_pct,
    ROUND(fr.debtToEquityRatioTTM, 2) AS debt_to_equity,
    ROUND(k.freeCashFlowYieldTTM * 100, 2) AS fcf_yield_pct,
    ROUND(p.marketCap / 1e9, 2) AS mktcap_b
FROM key_metrics_ttm k
JOIN profile p ON k.symbol = p.symbol
JOIN financial_ratios_ttm fr ON k.symbol = fr.symbol
WHERE k.earningsYieldTTM > 0.095        -- EY > 9.5% (rfr=6.5%+3%)
  AND k.earningsYieldTTM < 0.50
  AND k.returnOnEquityTTM > 0.08
  AND (fr.debtToEquityRatioTTM IS NULL
       OR (fr.debtToEquityRatioTTM >= 0 AND fr.debtToEquityRatioTTM < 2.0))
  AND p.marketCap > 20000000000         -- INR 20B+ (matches the backtest threshold)
  AND (p.industry IS NULL OR p.industry NOT LIKE 'Asset Management%')
  AND (p.industry IS NULL OR p.industry NOT LIKE 'Shell Companies%')
  AND p.exchange IN ('NSE')
  AND p.isFund = false
  AND p.isEtf = false
  AND p.isActivelyTrading = true
QUALIFY ROW_NUMBER() OVER (PARTITION BY p.companyName
                           ORDER BY p.averageVolume DESC) = 1
ORDER BY k.earningsYieldTTM DESC
LIMIT 30
Run this query on Ceta Research Data Explorer
Full backtest:
git clone https://github.com/ceta-research/backtests.git
cd backtests
pip install -r requirements.txt
python3 yield-gap/backtest.py --preset india --output results.json --verbose
Limitations
Underperforms both benchmarks: The strategy returned 7.17% CAGR vs the Sensex's 11.40%, a -4.23% excess over 25 years, and it also trails SPY's 7.64%. For an Indian investor who can simply buy a Sensex tracker, this screen did not add alpha over the full window.
Seven cash years, and they do most of the damage: FMP's FY earnings yield data for NSE stocks is not reliably available before 2006, so the backtest holds cash from 2000 to 2005. 2007 is cash for a different reason: only 10 names cleared the screen and 8 had a usable entry price. Those seven zero-return years land in a period when the Sensex compounded at 12.6% a year. Over 2010-2024, with no gaps, the strategy returned 13.20% a year against the Sensex's 10.63%. Treat the 25-year headline as a lower bound on what the signal does and the 2010-2024 figure as an upper bound on what you could have captured.
High volatility: A -62.58% drawdown in 2008 and a +85.10% year in 2009 reflect the asset class. The strategy amplifies India's inherent volatility by concentrating in the cheapest, often most cyclical companies. The Sharpe ratio of 0.02 is among the lowest in the study, below every market except Poland, Singapore and Korea.
Currency risk: Returns in INR. INR has depreciated against USD by roughly 3% annually over this period. USD-based investors would have experienced lower USD returns.
Threshold sensitivity: The 9.5% EY threshold is derived from a 6.5% risk-free rate assumption. India's actual policy rate has ranged from 4% to 9% over this period. A lower effective RFR would lower the threshold and widen the qualifying universe; a higher RFR would narrow it further.
Data: Ceta Research (FMP financial data warehouse), January 2000 through January 2025. Full methodology: github.com/ceta-research/backtests/blob/main/METHODOLOGY.md.
Academic references: Campbell, J.Y. & Vuolteenaho, T. (2004). "Bad Beta, Good Beta." American Economic Review, 94(5). Damodaran, A. (2012). "Equity Risk Premiums (ERP): Determinants, Estimation and Implications." Stern School of Business.
Past performance does not guarantee future results. This is educational content, not investment advice.

