
Yield Gap Canada: Near-Zero Bear Market Beta with Positive Alpha


Contents
The yield gap strategy on Canadian stocks delivered positive alpha over 25 years, and an unusual property: when US markets fell, this portfolio barely moved. The down-capture ratio of 3.52% against SPY is the lowest in our 20-market study. Not defensive in the sense of holding cash, but defensive in the sense that the positions themselves held up.
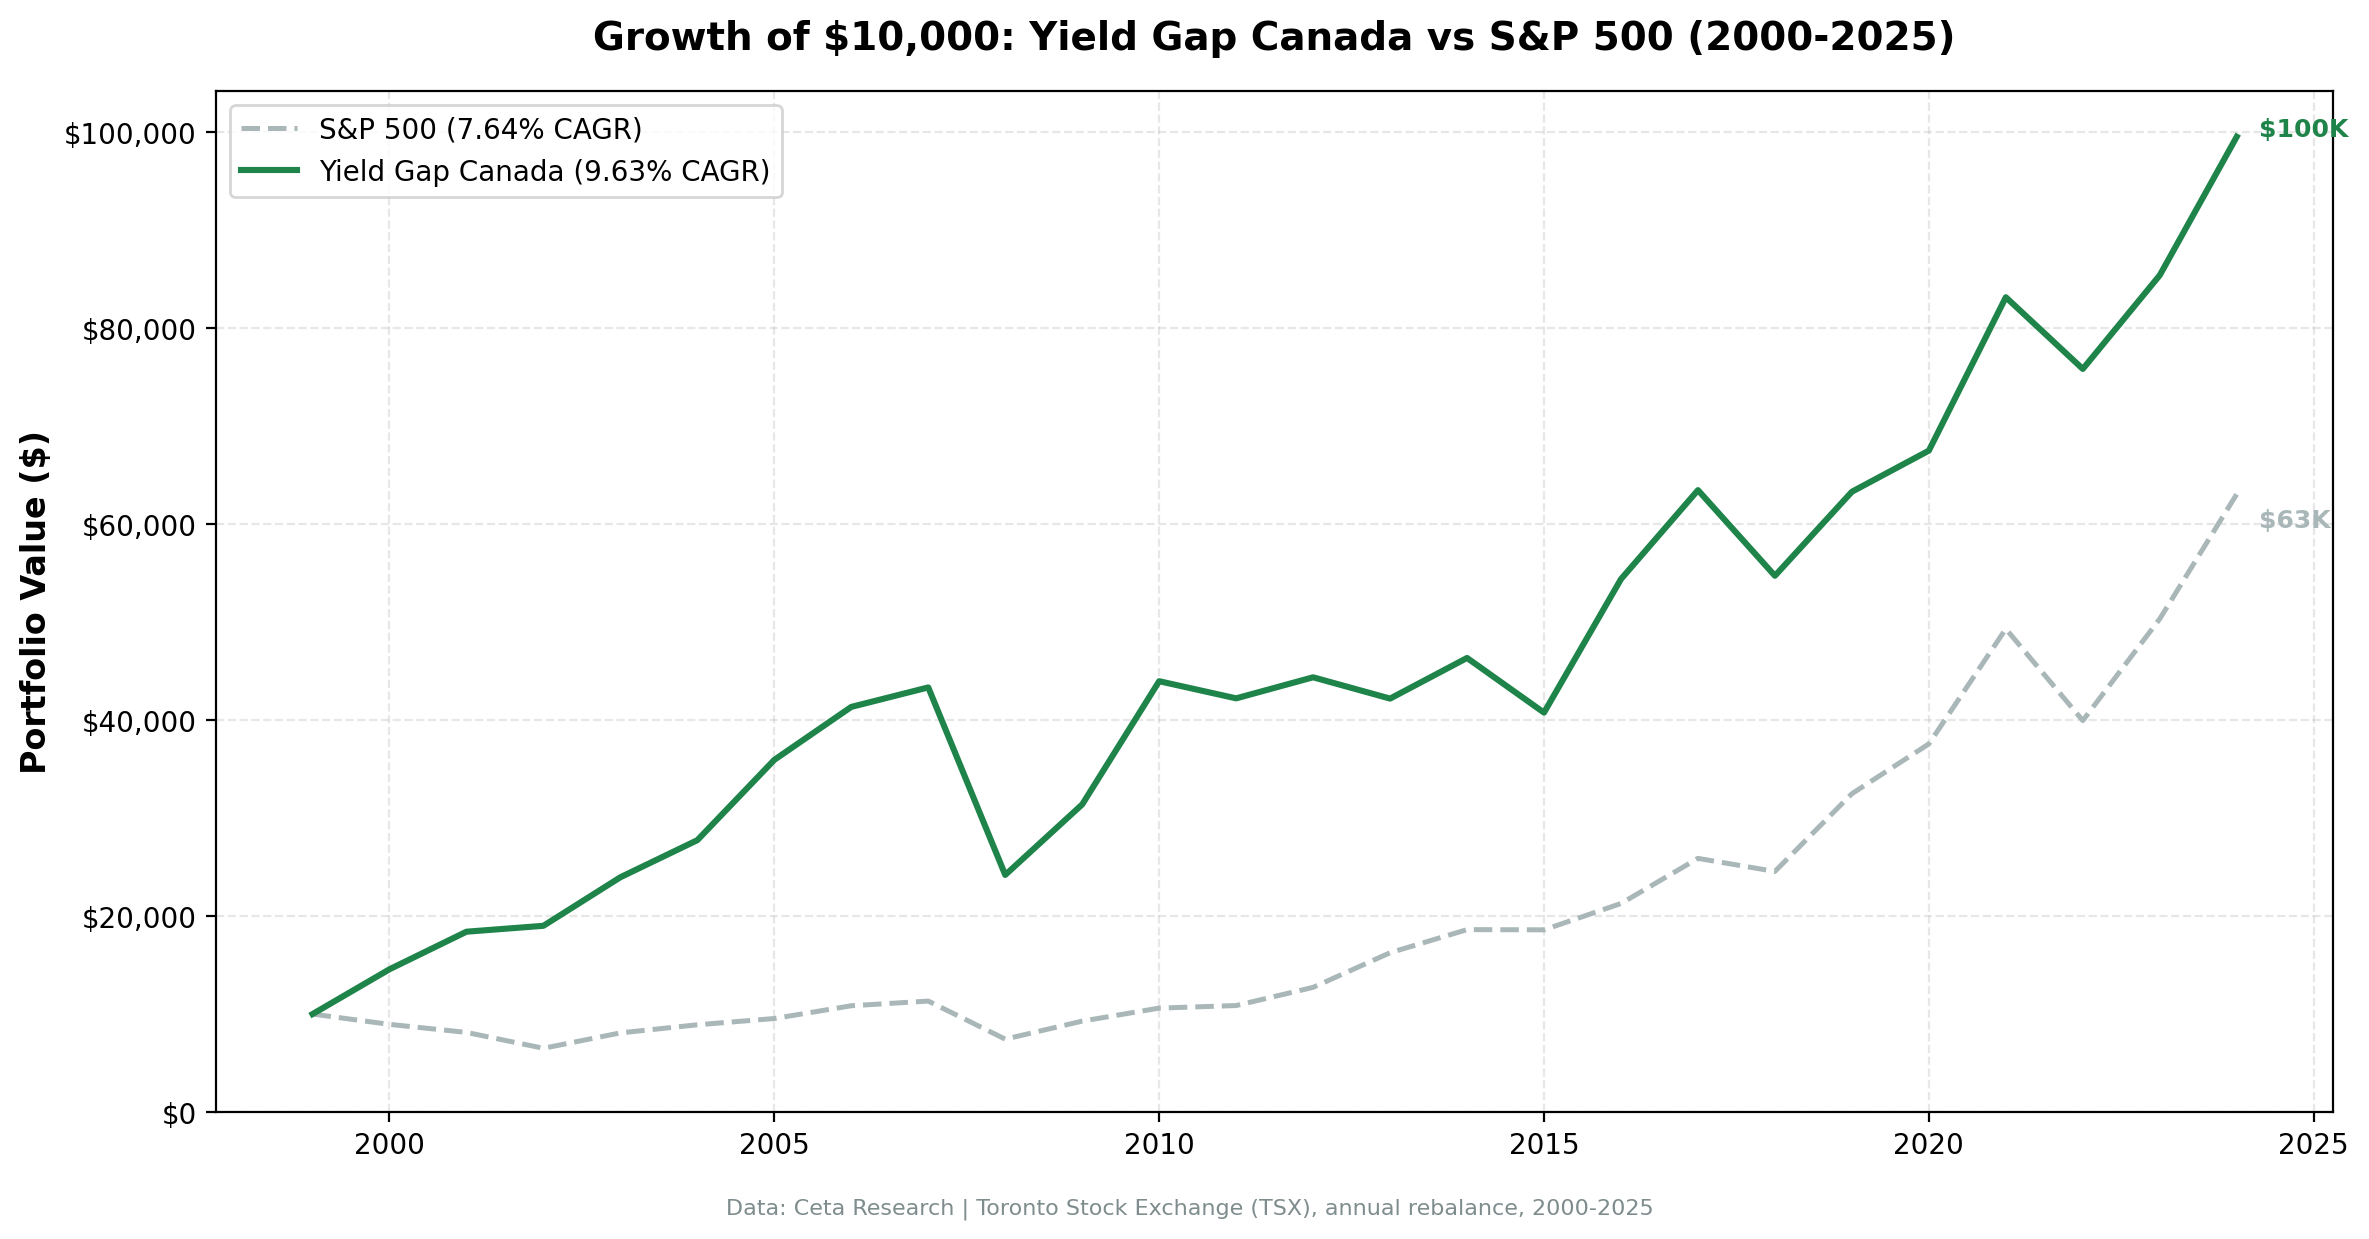
A $10,000 investment in January 2000 grew to $99,539. The same investment in SPY grew to $63,066.
The Strategy
The effective earnings yield threshold for Canada is 6% (the 6% absolute floor, since Canada's risk-free rate of roughly 2% plus 3% spread equals 5%, and we use the 6% floor as the binding constraint).
Signal: - Earnings yield > 6% (PE < ~16.7x) - Earnings yield < 50% - ROE > 8% - D/E < 2.0
Portfolio construction: Top 30 by highest earnings yield, equal weight, annual January rebalance. Cash if fewer than 10 stocks qualify.
Methodology
- Universe: Toronto Stock Exchange (TSX)
- Market cap filter: CAD 1B+ at each rebalance date
- Data period: January 2000 through December 2025 (25 annual periods, 0 cash years)
- Rebalancing: Annual (January)
- Point-in-time data: FY filings with 45-day filing lag
- Transaction costs: Size-tiered model
- Benchmark: SPY
- Data source: Ceta Research FMP financial data warehouse
Full methodology at github.com/ceta-research/backtests/blob/main/METHODOLOGY.md.
Results
| Metric | Yield Gap Canada | SPY |
|---|---|---|
| CAGR | 9.63% | 7.64% |
| Total return (25yr) | 895.4% | 530.7% |
| Max drawdown | -44.16% | -45.50% |
| Sharpe ratio | 0.364 | — |
| Down capture vs SPY | 3.52% | — |
| Win rate vs SPY | 48.0% | — |
| Cash periods | 0 of 25 years | — |
| Avg stocks (invested) | 23.8 | — |
The 3.52% down-capture is the number worth examining closely. It doesn't mean the portfolio was immune to declines, 2008 was -44.16% and 2013 was -4.90%. But on average across years when SPY fell, the Canadian yield gap portfolio lost almost nothing relative to SPY. This is a structural feature of the TSX composition, not luck.
Annual returns:
| Year | Portfolio | SPY | Excess |
|---|---|---|---|
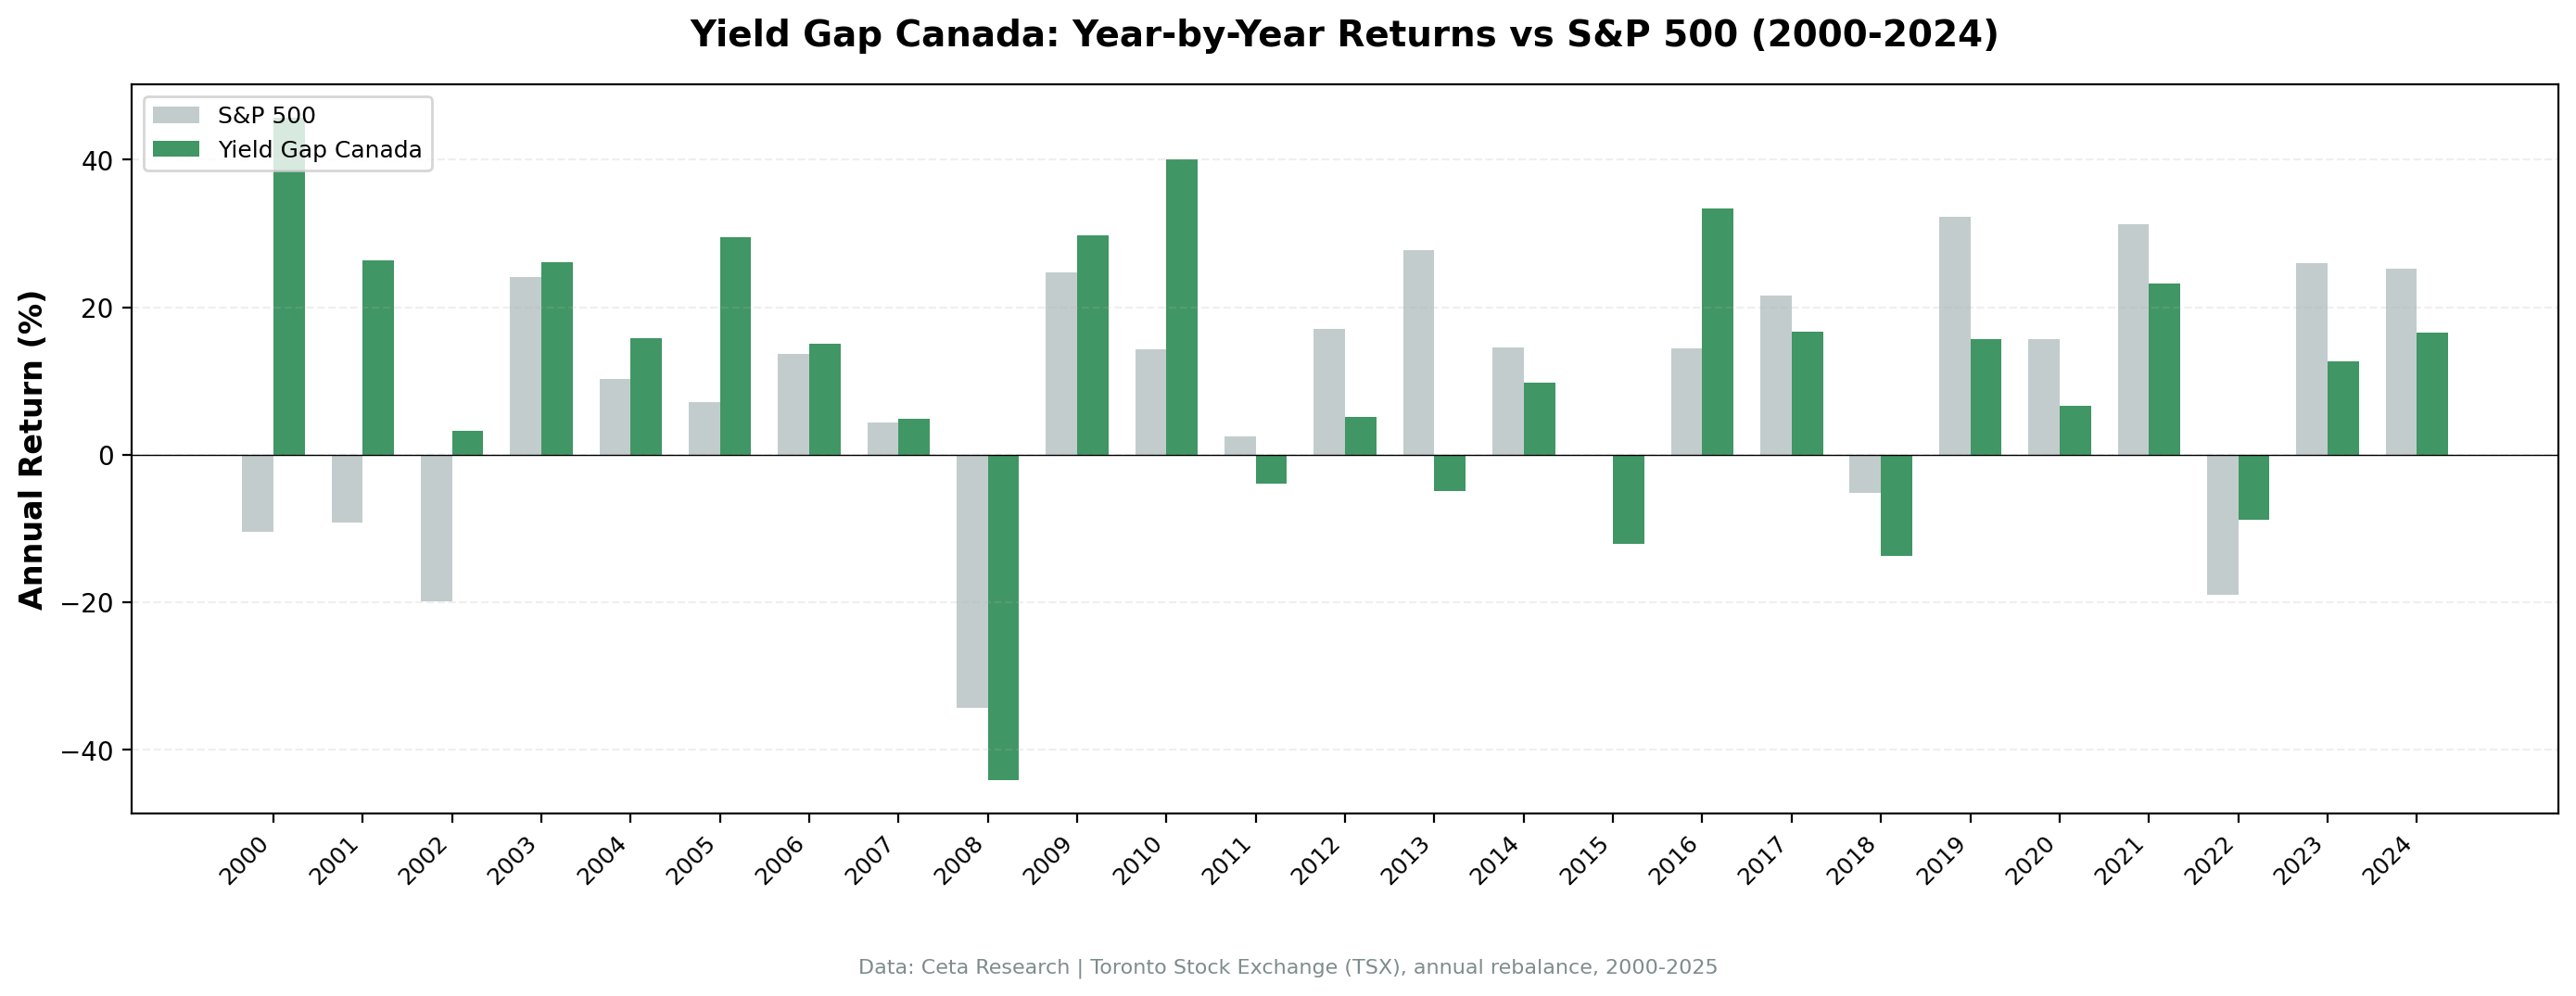
| 2000 | +45.72% | -10.50% | +56.22% |
| 2001 | +26.31% | -9.17% | +35.48% |
| 2002 | +3.28% | -19.92% | +23.20% |
| 2003 | +26.06% | +24.12% | +1.94% |
| 2004 | +15.80% | +10.24% | +5.56% |
| 2005 | +29.54% | +7.17% | +22.37% |
| 2006 | +15.03% | +13.65% | +1.38% |
| 2007 | +4.81% | +4.40% | +0.41% |
| 2008 | -44.16% | -34.31% | -9.85% |
| 2009 | +29.73% | +24.73% | +5.00% |
| 2010 | +40.06% | +14.31% | +25.75% |
| 2011 | -3.98% | +2.46% | -6.44% |
| 2012 | +5.09% | +17.09% | -12.00% |
| 2013 | -4.90% | +27.77% | -32.67% |
| 2014 | +9.83% | +14.50% | -4.67% |
| 2015 | -12.04% | -0.12% | -11.92% |
| 2016 | +33.43% | +14.45% | +18.98% |
| 2017 | +16.69% | +21.64% | -4.95% |
| 2018 | -13.77% | -5.15% | -8.62% |
| 2019 | +15.67% | +32.31% | -16.64% |
| 2020 | +6.63% | +15.64% | -9.01% |
| 2021 | +23.19% | +31.26% | -8.07% |
| 2022 | -8.80% | -18.99% | +10.19% |
| 2023 | +12.61% | +26.00% | -13.39% |
| 2024 | +16.55% | +25.28% | -8.73% |
The Sectoral Explanation
The TSX is structurally different from US exchanges. Energy, materials, and financials make up a much larger share of the Canadian market than they do of the S&P 500. When you screen for high earnings yield and quality on the TSX, you naturally concentrate in these sectors, companies with real asset bases, steady cash flows, and conservative balance sheets.
2000-2007 showed this clearly. The dotcom bust hit US growth stocks hard but barely touched Canadian energy and resource companies. From 2000 to 2007, the Canadian yield gap portfolio compounded at over 20% annually. The market's composition meant there were always qualifying stocks with high earnings yields and low debt.
2008 was the exception. When commodity prices collapsed alongside everything else in 2008, energy and materials companies fell sharply. The -44.16% drawdown reflects this, the TSX simply had no place to hide during a synchronized global commodity crash.
2013 was the worst relative year. -4.90% vs +27.77% SPY (-32.67% excess). This was the year energy stocks began underperforming as shale production ramped up in the US, dragging Canadian oil sands valuations. The strategy remained fully invested throughout; the screen continued to identify high-EY companies that underperformed.
2016 reversed all of that. +33.43% vs +14.45% SPY. Energy and materials recovered sharply as commodity prices rebounded. The portfolio had been loading up on beaten-down resource stocks, the very ones that bounced.
2022 showed the defensive quality. -8.80% vs -18.99% SPY (+10.19% excess). Energy stocks, which had been screened in due to their high earnings yields and improving balance sheets post-2020, surged while the rest of the market declined.
Part of a Series: Global | US | UK | Sweden | India
Run It Yourself
Current Canada yield gap screen:
SELECT
 k.symbol,
 p.companyName,
 p.exchange,
 p.sector,
 ROUND(k.earningsYieldTTM * 100, 2) AS earnings_yield_pct,
 ROUND(1.0 / NULLIF(k.earningsYieldTTM, 0), 1) AS implied_pe,
 ROUND(k.returnOnEquityTTM * 100, 2) AS roe_pct,
 ROUND(fr.debtToEquityRatioTTM, 2) AS debt_to_equity,
 ROUND(k.freeCashFlowYieldTTM * 100, 2) AS fcf_yield_pct,
 ROUND(k.marketCap / 1e9, 2) AS mktcap_b
FROM key_metrics_ttm k
JOIN profile p ON k.symbol = p.symbol
JOIN financial_ratios_ttm fr ON k.symbol = fr.symbol
WHERE k.earningsYieldTTM > 0.06
 AND k.earningsYieldTTM < 0.50
 AND k.returnOnEquityTTM > 0.08
 AND (fr.debtToEquityRatioTTM IS NULL
 OR (fr.debtToEquityRatioTTM >= 0 AND fr.debtToEquityRatioTTM < 2.0))
 AND k.marketCap > 1000000000 -- CAD 1B+
 AND (p.industry IS NULL OR p.industry NOT LIKE 'Asset Management%')
 AND (p.industry IS NULL OR p.industry NOT LIKE 'Shell Companies%')
 AND p.exchange IN ('TSX')
ORDER BY k.earningsYieldTTM DESC
LIMIT 30
Full backtest:
git clone https://github.com/ceta-research/backtests.git
cd backtests
pip install -r requirements.txt
python3 yield-gap/backtest.py --preset canada --output results.json --verbose
Limitations
Currency risk: Returns in CAD. CAD/USD has fluctuated between 0.62 and 1.10 over this period. A USD-based investor's actual returns would differ depending on the timing of currency moves.
Commodity concentration: The TSX bias toward energy and materials means this strategy is effectively a bet on those sectors continuing to have high earnings yields. If oil prices remain depressed for an extended period, the screen may identify fewer qualifying stocks or consistently include companies whose earnings yields are high because earnings are temporarily elevated.
2008 as a tail risk: The -44.16% drawdown in 2008 was deeper than SPY's -34.31%. Commodity exposure created correlation with global risk assets at exactly the wrong moment.
Run It Yourself
Explore the data behind this analysis on Ceta Research. Query our financial data warehouse with SQL, build custom screens, and run your own backtests across 70,000+ stocks on 20 exchanges.
Data: Ceta Research (FMP financial data warehouse), January 2000 through December 2025. Full methodology: github.com/ceta-research/backtests/blob/main/METHODOLOGY.md.
Academic references: Campbell, J.Y. & Vuolteenaho, T. (2004). "Bad Beta, Good Beta." American Economic Review, 94(5). Damodaran, A. (2012). "Equity Risk Premiums (ERP): Determinants, Estimation and Implications." Stern School of Business.


