
Korea Sector Momentum: 24.44% CAGR and the Lowest Down Capture of Any

Korea Sector Momentum: The Lowest Down Capture of Any Strategy We've Tested
16.46% down capture. That's the number that stops you.
Contents
- The Strategy
- Results
- Which Sectors Drive Korea's Rotation
- When It Works
- When It Struggles
- Full Annual Returns
- The Down Capture Explained
- Limitations
- References
When US markets fall, this strategy's Korea portfolio barely moves. Over 26 years, when SPY had a losing quarter, this portfolio lost on average only 16.46 cents for every dollar SPY lost. We've tested sector momentum across 14 exchanges worldwide. No other market comes close to this number.
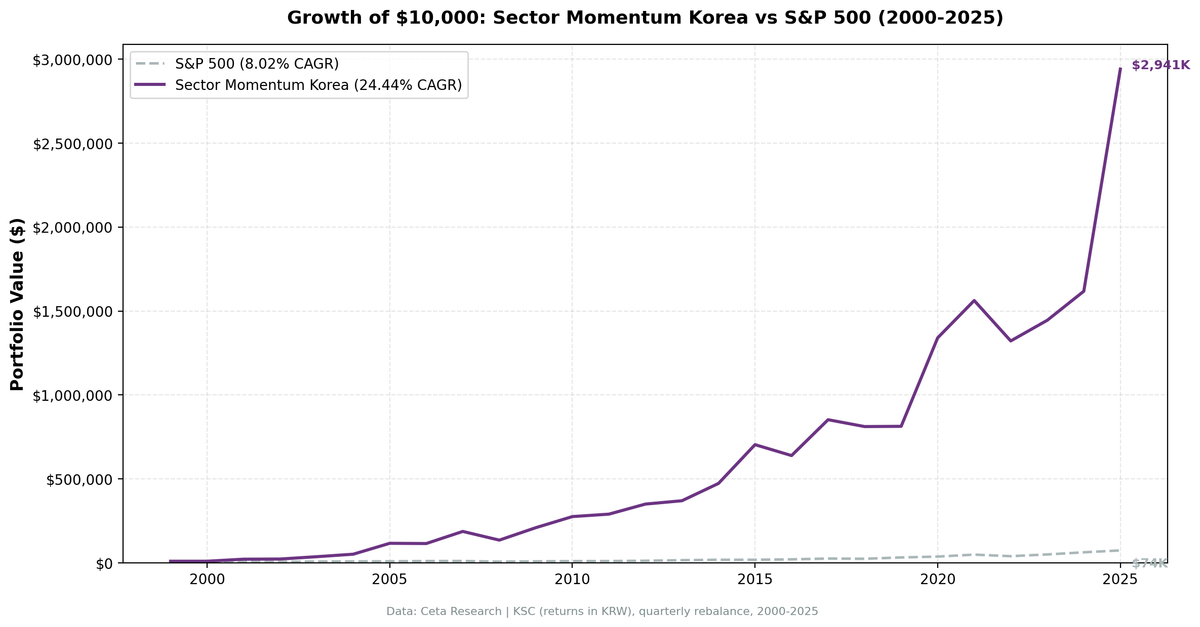
The CAGR of 24.44% and the $10,000 growing to $2.94 million are remarkable. But the down capture tells you something more useful: where the returns come from and why Korea's sector rotation is structurally different from what you see in developed markets.
The Strategy
Same framework as the US flagship backtest. Each quarter, rank all GICS sectors on the Korea Stock Exchange (KSC) by their equal-weighted 12-month trailing return. Buy stocks from the top 2 sectors. Equal weight within the portfolio, exchange-specific market cap threshold applied.
The academic foundation is Moskowitz and Grinblatt (1999): industry-level momentum is persistent. When a sector catches a trend, that trend tends to outlast a single quarter. In Korea, sector trends tied to domestic demographics, export cycles, and regional consumption patterns appear to be especially durable.
| Parameter | Value |
|---|---|
| Universe | KSC (Korea Stock Exchange) |
| Period | 2000-2025 (26 years) |
| Rebalance | Quarterly |
| Signal | Equal-weighted 12M sector trailing return |
| Sectors held | Top 2 each quarter |
| Stock weighting | Equal weight within portfolio |
| Cash quarters | 7 of 104 (7%) |
| Avg stocks held | 55.2 (when invested) |
| Transaction costs | 0.1% per trade |
Part of the Sector Momentum Rotation series. US flagship blog
Results
| Metric | Portfolio | SPY (benchmark) |
|---|---|---|
| CAGR | 24.44% | 8.02% |
| Excess return | +16.41% | — |
| Final value ($10k) | $2,941,353 | $74,347 |
| Max drawdown | -39.91% | -45.53% |
| Sharpe ratio | 0.747 | — |
| Sortino ratio | 1.885 | — |
| Calmar ratio | 0.612 | — |
| Up capture | 147.72% | — |
| Down capture | 16.46% | — |
| Beta | 0.775 | — |
| Alpha | 17.54% | — |
| Win rate vs SPY | 53.85% | — |
The Sharpe of 0.747 is the highest of all 14 exchanges we tested for this strategy. The Sortino of 1.885, which penalizes only downside volatility, is exceptional. The portfolio has high absolute volatility (it returned +121.5% in 2001 and +125.3% in 2005), but the downside portion of that volatility is small relative to the upside.
Beta of 0.775 against SPY means the portfolio has lower dollar sensitivity to US market moves, even though it often delivers far higher absolute returns. That's the combination that creates the 16.46% down capture.
Which Sectors Drive Korea's Rotation
| Sector | Quarters in Top 2 |
|---|---|
| Healthcare | 34 |
| Consumer Defensive | 28 |
| Basic Materials | 22 |
| Energy | 25 |
| Industrials | 20 |
| Consumer Cyclical | 19 |
| Technology | 19 |
| Communication Services | 11 |
| Utilities | 11 |
| Financial Services | 10 |
| Real Estate | 1 |
Healthcare and Consumer Defensive together account for 62 of 104 quarters at the top of Korea's rotation. This concentration isn't accidental. South Korea has one of the fastest-aging populations in the world. Healthcare demand compounds structurally regardless of global risk sentiment. Consumer Defensive captures domestic consumption from a population with high household savings and stable employment.
These sectors don't correlate tightly with US equity downturns, which is why the strategy holds up when SPY sells off.
Technology appeared in only 19 quarters despite Korea's reputation as a tech-heavy market. The strategy's equal-weighting at sector level means Samsung and a handful of large-cap chip stocks don't dominate the signal the way they dominate the KOSPI index. When semiconductor cycles turn, the sector shows up in rotation. When they don't, Healthcare carries the portfolio.
When It Works
2001: +121.5%. The dotcom bust crushed US markets (-9.2% for SPY). Korea's sector momentum had rotated into Healthcare and Consumer Defensive in prior quarters. When US tech imploded, Korea's top-rotation sectors were untouched. The result was a year that looks almost impossible in hindsight.
2005: +125.3%. Another extraordinary year. Korea was in the middle of a domestic consumer boom. Healthcare and Defensive Consumer sectors ran in parallel. SPY returned 7.2% that year.
2007-2009 through the GFC. The portfolio returned +62.5% in 2007, then held to -27.6% in 2008 when SPY fell -34.3%. The 2009 recovery was +54.7% versus +24.7% for SPY. The strategy entered the crisis with momentum behind healthcare and defensive names, which provided partial insulation, and came out of it early.
2015: +48.8%. A quiet year for global markets (SPY -0.1%). Korea's sector rotation was firing on domestic consumption themes. A 48-point spread over SPY in a flat year for most investors.
2020: +64.8% versus +15.6% for SPY. Healthcare was the dominant sector through COVID. Korea's healthcare companies, many involved in diagnostics and biopharmaceuticals, were in the top-2 rotation as the sector's trailing returns built through 2019 and accelerated in 2020.
2025: +81.8% versus +17.9% for SPY. The most recent full year. The strategy continues to work at scale in modern Korea.
When It Struggles
2006: -1.1% versus +13.7% for SPY. After two extraordinary years (2004-2005), the sectors that had been leading ran out of steam. The portfolio gave back some of the prior gains while SPY had a normal positive year.
2013: +5.7% versus +27.8% for SPY. The worst relative year. US markets were in a broad rally driven by QE and multiple expansion. Korea's rotation sectors didn't participate in the US-centric upswing.
2016: -9.2% versus +14.5% for SPY. A drawdown year with poor relative performance. The sector signal was pointing into areas that got hit by political uncertainty around South Korea's domestic leadership crisis.
2019: +0.2% versus +32.3% for SPY. Nearly flat in a strong US year. The portfolio was positioned in sectors that benefited from domestic Korean themes while the US rally was driven almost entirely by large-cap technology.
2023-2024. Like the US, Korea's sector momentum lagged SPY during the AI-era concentration trade. The gap was smaller than in the US because Korea's sector rotation was never chasing AI exposure.
Full Annual Returns
| Year | Portfolio | SPY | Excess |
|---|---|---|---|
| 2000 | 0.0% | -10.5% | +10.5% (cash) |
| 2001 | +121.5% | -9.17% | +130.7% |
| 2002 | +4.35% | -19.92% | +24.3% |
| 2003 | +59.72% | +24.12% | +35.6% |
| 2004 | +40.28% | +10.24% | +30.1% |
| 2005 | +125.28% | +7.17% | +118.1% |
| 2006 | -1.13% | +13.65% | -14.8% |
| 2007 | +62.46% | +4.4% | +58.1% |
| 2008 | -27.63% | -34.31% | +6.7% |
| 2009 | +54.74% | +24.73% | +30.0% |
| 2010 | +31.45% | +14.31% | +17.1% |
| 2011 | +5.26% | +2.46% | +2.8% |
| 2012 | +20.66% | +17.09% | +3.6% |
| 2013 | +5.67% | +27.77% | -22.1% |
| 2014 | +27.85% | +14.5% | +13.4% |
| 2015 | +48.78% | -0.12% | +48.9% |
| 2016 | -9.23% | +14.45% | -23.7% |
| 2017 | +33.42% | +21.64% | +11.8% |
| 2018 | -4.79% | -5.15% | +0.4% |
| 2019 | +0.17% | +32.31% | -32.2% |
| 2020 | +64.8% | +15.64% | +49.2% |
| 2021 | +16.58% | +31.26% | -14.7% |
| 2022 | -15.4% | -18.99% | +3.6% |
| 2023 | +9.31% | +26.0% | -16.7% |
| 2024 | +11.97% | +25.28% | -13.3% |
| 2025 | +81.76% | +17.88% | +63.9% |
The Down Capture Explained
Down capture of 16.46% doesn't mean the portfolio never loses. It lost 27.6% in 2008, 9.2% in 2016, and 15.4% in 2022. But when SPY was falling in those years, the portfolio fell less, often much less.
The mechanism: Healthcare and Consumer Defensive sectors don't sell off for the same reasons as broad US equity markets. Global risk-off events that crush SPY tend to spare domestic Korean healthcare names. Korea's consumer staples are insulated from US rate decisions, Federal Reserve policy, and US tech earnings cycles.
When correlation decouples in bear markets, down capture collapses. That's what 16.46% represents.
For comparison, the US version of this strategy has 81.21% down capture. India has roughly 60%. Germany and Switzerland are above 90%. Korea's 16.46% stands alone.
Limitations
Currency risk. The backtest uses returns in local currency (KRW). For USD-based investors, exchange rate fluctuations between KRW and USD create an additional return layer not captured here. Won depreciation can offset strong local returns.
Liquidity. The Korea universe averaged 55.2 stocks when invested. This is thin for institutional capital. Transaction costs would be higher for larger positions. The 0.1% assumption is reasonable for retail but optimistic for funds.
Extraordinary years skew the CAGR. The 24.44% CAGR is driven substantially by 2001, 2005, and 2025. Remove those three years and the strategy still outperforms, but the gap narrows. An investor who started in 2006 would have experienced a very different trajectory through 2013.
Small universe volatility. With 55 stocks on average, individual sector trends can be amplified by a few names. The +121.5% in 2001 reflects genuine healthcare and defensive outperformance, but the magnitude was amplified by a concentrated universe.
Regulatory and political risk. The 2016 domestic political crisis affected sector momentum in ways not reflected in a simple equal-weighted model. Korea-specific events can disrupt sector rotation dynamics for extended periods.
Win rate. 53.85% annual win rate versus SPY means roughly 12 of 26 years underperformed. Investors experienced multi-year underperformance in 2006, 2013, 2016, 2019, and 2021-2024. The patience required is substantial.
References
- Moskowitz, T. J., & Grinblatt, M. (1999). Do industries explain momentum? The Journal of Finance, 54(4), 1249-1290.
- Jegadeesh, N., & Titman, S. (1993). Returns to buying winners and selling losers: Implications for stock market efficiency. The Journal of Finance, 48(1), 65-91.
Part of a Series: Global | US | Japan | India | Germany | Canada
Run It Yourself
Explore the data behind this analysis on Ceta Research. Query our financial data warehouse with SQL, build custom screens, and run your own backtests across 70,000+ stocks on 20 exchanges.
Data: Ceta Research (FMP financial data warehouse), KSC (Korea Stock Exchange), 2000-2025 Backtest: 26 years, 104 quarters, 0.1% transaction costs, equal weight, exchange-specific market cap threshold Past performance doesn't guarantee future results. This is educational content, not investment advice.


