
Sector Mean Reversion: Emerging Markets Win, Developed Markets


Sector Mean Reversion on 14 Global Exchanges: Emerging Markets Win, Developed Markets Struggle
We ran the same sector mean reversion strategy on 14 exchanges from 2000 to 2025: at the start of each quarter, rank all sectors by their equal-weighted 12-month return and buy every qualifying stock in the bottom two. Quarterly rebalance, equal weight, 104 periods. The headline result isn't the alpha. It's the geography.
Contents
- Method
- The Pattern Is Geographic
- Results: All 14 Exchanges
- Emerging Markets: Why It Works
- Developed Markets: Why It Struggles
- Korea: Best Risk-Adjusted
- Taiwan: The Anomaly
- China: High Volatility, Low Down Capture
- The Drawdown Picture
- Exchange Notes
- Backtest Methodology
- Limitations
- Takeaway
- See Individual Exchange Analysis
- References
Emerging markets (India, Korea, Taiwan) produced +6.6% to +8.4% excess CAGR over the S&P 500. European developed markets (Germany, Switzerland, UK) underperformed by -1.6% to -3.5%. The same signal, the same rules, and a 12-point spread between the best and worst exchanges.
That split is the story. Where you apply this strategy matters more than whether you apply it.
Method
- Data source: Ceta Research (FMP financial data warehouse)
- Universe: 14 exchanges, full exchange universe (not index-constrained), market cap > exchange-specific threshold
- Period: 2000-2025 (26 years, 104 quarterly periods)
- Rebalancing: Quarterly (January, April, July, October), equal weight all qualifying stocks in selected sectors
- Signal: Bottom 2 sectors by equal-weighted 12-month trailing return
- Cash rule: Hold cash if fewer than 5 stocks qualify across the bottom 2 sectors
- Benchmark: S&P 500 Total Return (SPY, USD)
- Currency note: All exchange returns are in local currency. Benchmark is USD. Direct comparison has currency effects embedded.
Full methodology: backtests/METHODOLOGY.md
The Pattern Is Geographic
Before showing the numbers, the thesis: sector mean reversion works in markets where sector underperformance is temporary and sentiment-driven. It fails in markets where sector underperformance reflects real structural conditions that don't reverse on a quarterly timeline.
Emerging markets have more volatile, cyclical sector compositions. When Utilities or Basic Materials underperform in India by 40% over 12 months, the reversion can be violent and fast. European defensive markets (pharmaceuticals, luxury goods, industrial conglomerates) don't revert as sharply because the "beaten-down" sector is often beaten down for good reason.
That's the entire explanation. Everything in the numbers below traces back to it.
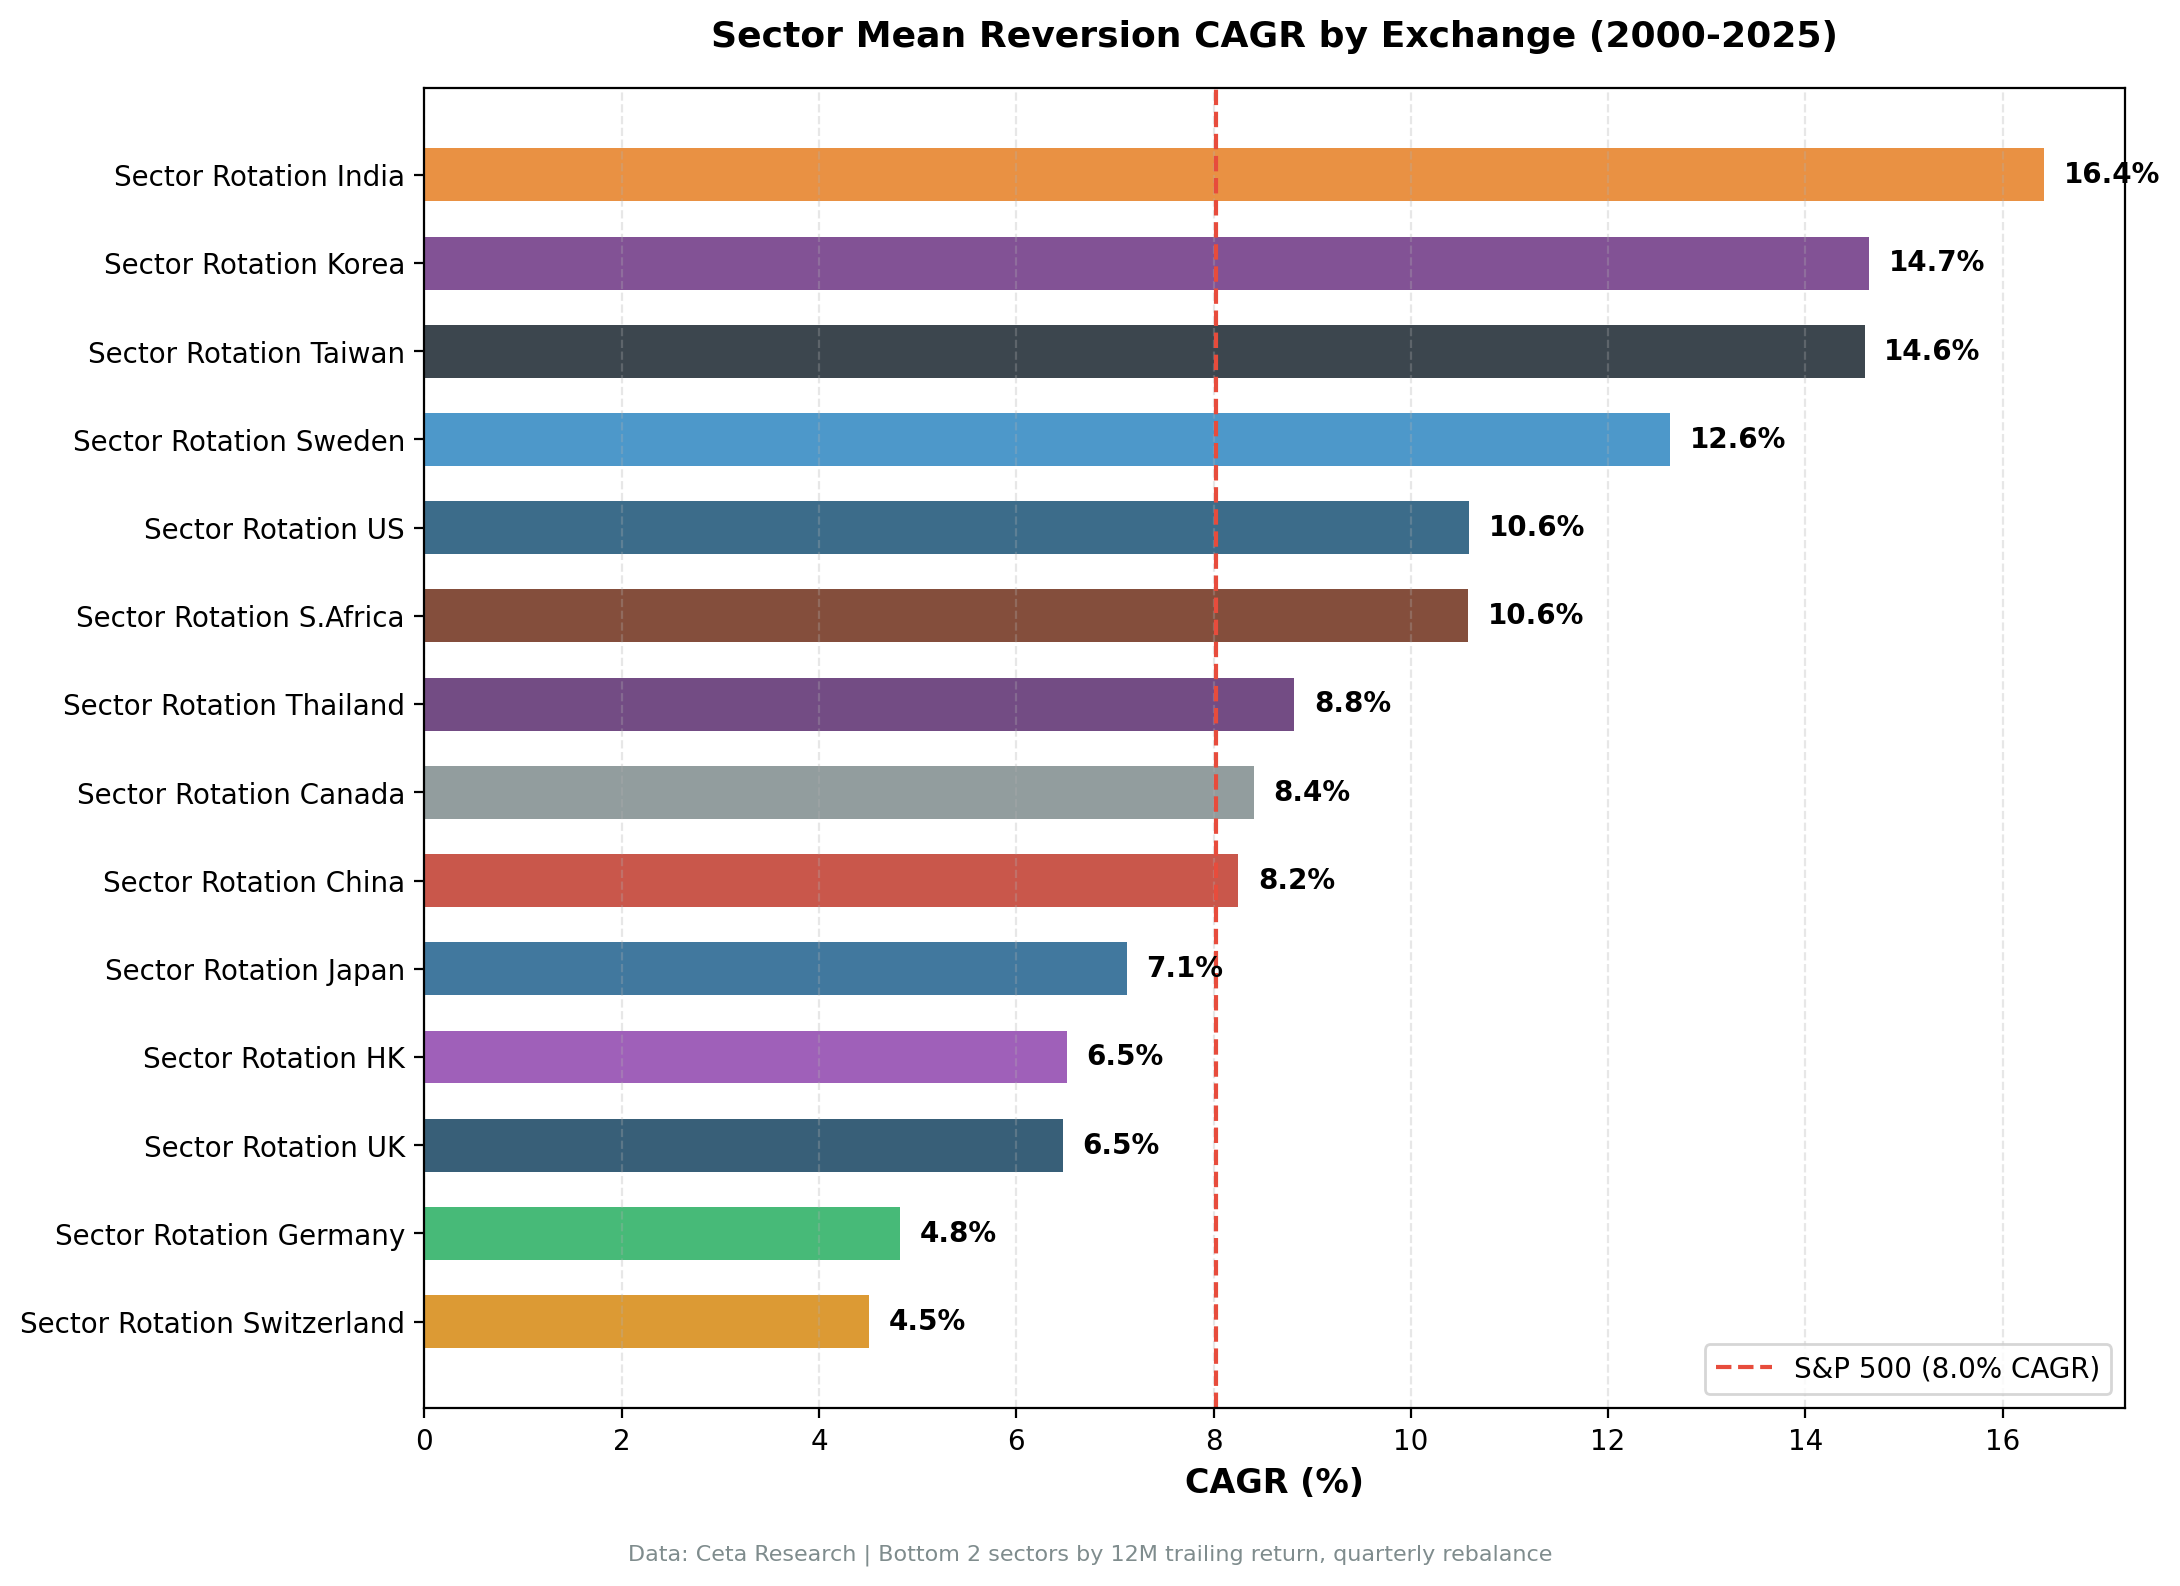
Results: All 14 Exchanges
| Exchange | CAGR | vs SPY | Sharpe | Max DD | Volatility | Cash% | Avg Stocks |
|---|---|---|---|---|---|---|---|
| India (BSE+NSE) | 16.42% | +8.40% | 0.265 | -70.5% | 37.5% | 3% | 133 |
| Korea (KSC) | 14.65% | +6.63% | 0.466 | -37.4% | 25.0% | 7% | 50 |
| Taiwan (TAI+TWO) | 14.60% | +6.58% | 0.495 | -48.0% | 27.5% | 7% | 81 |
| Sweden (STO) | 12.63% | +4.61% | 0.425 | -62.3% | 25.0% | 7% | 29 |
| US (NYSE+NASDAQ+AMEX) | 10.59% | +2.57% | 0.319 | -48.3% | 26.9% | 3% | 604 |
| South Africa (JNB) | 10.58% | +2.56% | 0.052 | -56.8% | 30.5% | 11% | 16 |
| Thailand (SET) | 8.82% | +0.80% | 0.232 | -58.4% | 27.3% | 9% | 27 |
| Canada (TSX) | 8.41% | +0.38% | 0.228 | -49.7% | 25.9% | 3% | 71 |
| China (SHH+SHZ) | 8.25% | +0.23% | 0.166 | -73.7% | 34.7% | 3% | 272 |
| Japan (JPX) | 7.12% | -0.91% | 0.337 | -49.6% | 20.8% | 7% | 94 |
| Hong Kong (HKSE) | 6.51% | -1.51% | 0.126 | -54.3% | 27.8% | 7% | 72 |
| UK (LSE) | 6.47% | -1.56% | 0.124 | -50.2% | 24.0% | 3% | 148 |
| Germany (XETRA) | 4.82% | -3.20% | 0.133 | -61.8% | 21.3% | 3% | 79 |
| Switzerland (SIX) | 4.51% | -3.51% | 0.204 | -59.8% | 19.7% | 3% | 42 |
| SPY benchmark | 8.02% | — | 0.357 | -45.5% | 16.9% | — | — |
Returns in local currency. Cash% = quarters where fewer than 5 stocks qualified.
Emerging Markets: Why It Works
The top four exchanges by excess return are India, Korea, Taiwan, and Sweden. Three are either emerging markets or have emerging-market-adjacent sector characteristics (Sweden's cyclical industrial and materials sectors behave similarly).
India (BSE+NSE): 16.42% CAGR, +8.40% excess. With an average of 133 stocks per quarter, the portfolio is broad. India's sector composition includes Utilities, Energy, Basic Materials, and Financials, all highly cyclical relative to developed market equivalents. When these sectors fall hard, the mean reversion when they recover is powerful. 2009 was the clearest demonstration: +99.3% as sectors that had collapsed in 2008 snapped back violently. The drawdown profile is the cost: -70.5% max drawdown in 2008 reflects how hard cyclical EM sectors can fall.
Korea (KSC): 14.65% CAGR, +6.63% excess, Sharpe 0.466. Korea is the stand-out on risk-adjusted terms. More on this in the dedicated section below.
Taiwan (TAI+TWO): 14.60% CAGR, +6.58% excess, Sharpe 0.495. Taiwan's highest Sharpe in this comparison and the only exchange with negative down capture (-9.2%). More on this in the dedicated section below.
Sweden (STO): 12.63% CAGR, +4.61% excess, Sharpe 0.425. Sweden's inclusion in the top tier surprises at first. But the STO universe is heavily weighted toward cyclical industrials, basic materials, and energy companies that behave more like EM cyclicals than European defensives. The 2009 recovery of +84.1% tells the story. The max drawdown of -62.3% is the corresponding cost.
What these markets share: sector underperformance is mostly cyclical, not structural. When a sector falls 30-40% over 12 months in India or Taiwan, it's usually because the economic cycle turned against it, not because the industry is in secular decline. The 12-month lookback catches exactly that kind of dislocation and positions for the recovery.
Developed Markets: Why It Struggles
The lower half of the table is dominated by developed markets: Japan, Hong Kong, UK, Germany, Switzerland. Their excess returns range from -0.91% to -3.51%.
UK (LSE): 6.47% CAGR, -1.56% excess. Large-cap UK sectors include Financials, Healthcare, Consumer Staples, and Energy. When Healthcare underperforms for 12 months, it's often because of pipeline news, regulatory changes, or patent cliffs, not a cyclical dislocation that reverts cleanly. The 2013-2015 stretch was particularly costly: three consecutive years of meaningful underperformance as Energy collapsed and the strategy kept reloading into it.
Germany (XETRA): 4.82% CAGR, -3.20% excess. Zero cash periods and 79 average stocks, the data is clean and the strategy fires consistently. But XETRA's sector composition is export-dependent industrials and chemicals. When these fall, it's often because export conditions have worsened structurally, not because sentiment briefly overcorrected. The mean reversion assumption doesn't hold.
Switzerland (SIX): 4.51% CAGR, -3.51% excess. The Swiss market is dominated by Pharmaceuticals (Novartis, Roche) and consumer staples (Nestlé). When they underperform, which happens periodically, the underperformance tends to be fundamental, not sentiment-driven. Buying beaten-down Swiss pharma as a mean reversion play has historically not worked. 2023 and 2024 were consecutive -22% and -25% excess years.
Japan (JPX): 7.12% CAGR, -0.91% excess. Japan is the closest to breakeven among the underperformers. Its Sharpe of 0.337 actually exceeds the US (0.319) when you account for Japan's near-zero risk-free rate. Down capture is 57.7%, genuinely protective. But Utilities dominated selection at 41% of quarters, a structural consequence of Fukushima, and the strategy consistently missed Japan's growth periods while absorbing the drawdowns.
Hong Kong (HKSE): 6.51% CAGR, -1.51% excess. HKSE sits between EM and developed in character. The individual years are dramatic (2009: +105.5%, 2008: -53.1%), but the long-run average doesn't work. Mainland China regulatory actions, the Evergrande collapse, and political events don't behave like sentiment cycles. The 2021-2023 stretch of persistent underperformance reflects genuine structural change.
Korea: Best Risk-Adjusted
Korea deserves its own section. A Sharpe of 0.466 on a 14.65% CAGR with a max drawdown of only -37.4% is the best combination of return and risk management in this entire study. The S&P 500 itself had a -45.5% max drawdown over the same period. Korea's sector mean reversion strategy absorbed less peak-to-trough loss than the US benchmark while delivering nearly double the annualized return.
The 36.7% down capture is the mechanism. In years when the S&P 500 fell, Korean sector mean reversion absorbed only 36.7% of that loss on average. The strategy was positioned in Korean sectors that were already beaten down, and beaten-down sectors don't fall as hard in further market declines as sectors that are still expensive. The asymmetry shows up in the numbers: high up capture from sector recoveries, low down capture because the portfolio was already defensively positioned by default.
2008 tells the story directly. Korea returned -32.1%. SPY returned -34.3%. A Korean market strategy that outperformed SPY in one of the worst years on record, then returned +80.0% in 2009's recovery. That's the profile of a strategy working in the right market.
Taiwan: The Anomaly
Taiwan has the highest Sharpe (0.495) and the only negative down capture in this study: -9.2%. A negative down capture means the strategy, on average, gained when global markets were falling.
The Taiwan exchange (TAI+TWO) is dominated by Technology, Financial Services, Basic Materials, and Real Estate. In bull markets driven by global growth, tech and financials lead and sit at the top of the 12-month ranking, so the strategy doesn't hold them. It holds the beaten-down sectors: Basic Materials, Real Estate, Utilities.
When global markets fall, as they did in 2008, 2015, 2022. Technology and Financials get hit first and hardest. The strategy had already rotated out of them. The portfolio sits in sectors that had already been beaten down and don't have as far to fall. The result: Taiwan 2008 was -33.2% versus SPY -34.3%. The recovery in 2009 was +132.6%.
The negative down capture reflects a portfolio that systematically holds the "already cheap" sectors in a market where cheap and expensive flip roles sharply between bull and bear phases.
China: High Volatility, Low Down Capture
China (SHH+SHZ) presents one of the most distinctive profiles in the study. At +0.23% excess, the strategy barely beats SPY. But the down capture of 26.6% is the second-best in the study, behind only Taiwan.
With 272 average stocks per quarter, this is the second-largest universe after the US. The strategy fires consistently, 101 of 104 quarters invested. But the volatility is extreme: 34.7% annualized. 2007 delivered +164.9%, the highest single-year return in the entire study, while 2008 was -59.9%.
The speculative bubble in Chinese A-shares in 2007 drives most of the CAGR. Strip that single year out, and the picture looks different. The strategy's down capture profile is real, but the -73.7% max drawdown and persistent volatility make it a difficult strategy to sustain through multiple cycles.
The Drawdown Picture
Down capture ratios tell a compressed version of the risk story:
| Exchange | Down Capture |
|---|---|
| Taiwan (TAI+TWO) | -9.2% |
| China (SHH+SHZ) | 26.6% |
| Korea (KSC) | 36.7% |
| South Africa (JNB) | 47.5% |
| Thailand (SET) | 57.1% |
| Japan (JPX) | 57.7% |
| India (BSE+NSE) | 80.7% |
| Switzerland (SIX) | 82.9% |
| Hong Kong (HKSE) | 87.3% |
| UK (LSE) | 96.5% |
| Canada (TSX) | 99.8% |
| Germany (XETRA) | 102.1% |
| Sweden (STO) | 109.6% |
| US (NYSE+NASDAQ+AMEX) | 113.7% |
Taiwan and Korea protect capital in down markets while generating strong returns in up markets. China's 26.6% down capture is notable alongside its modest overall alpha, the strategy absorbs very little of global downturns, but the massive 2007 bull year drives most of the long-run return. India generates the highest CAGR with 80.7% down capture, you absorb most of SPY's downside, but the upside in recovery years is spectacular. The US absorbs 113.7% of SPY's downside, the expected cost of holding beaten-down sectors in a market closely correlated to SPY.
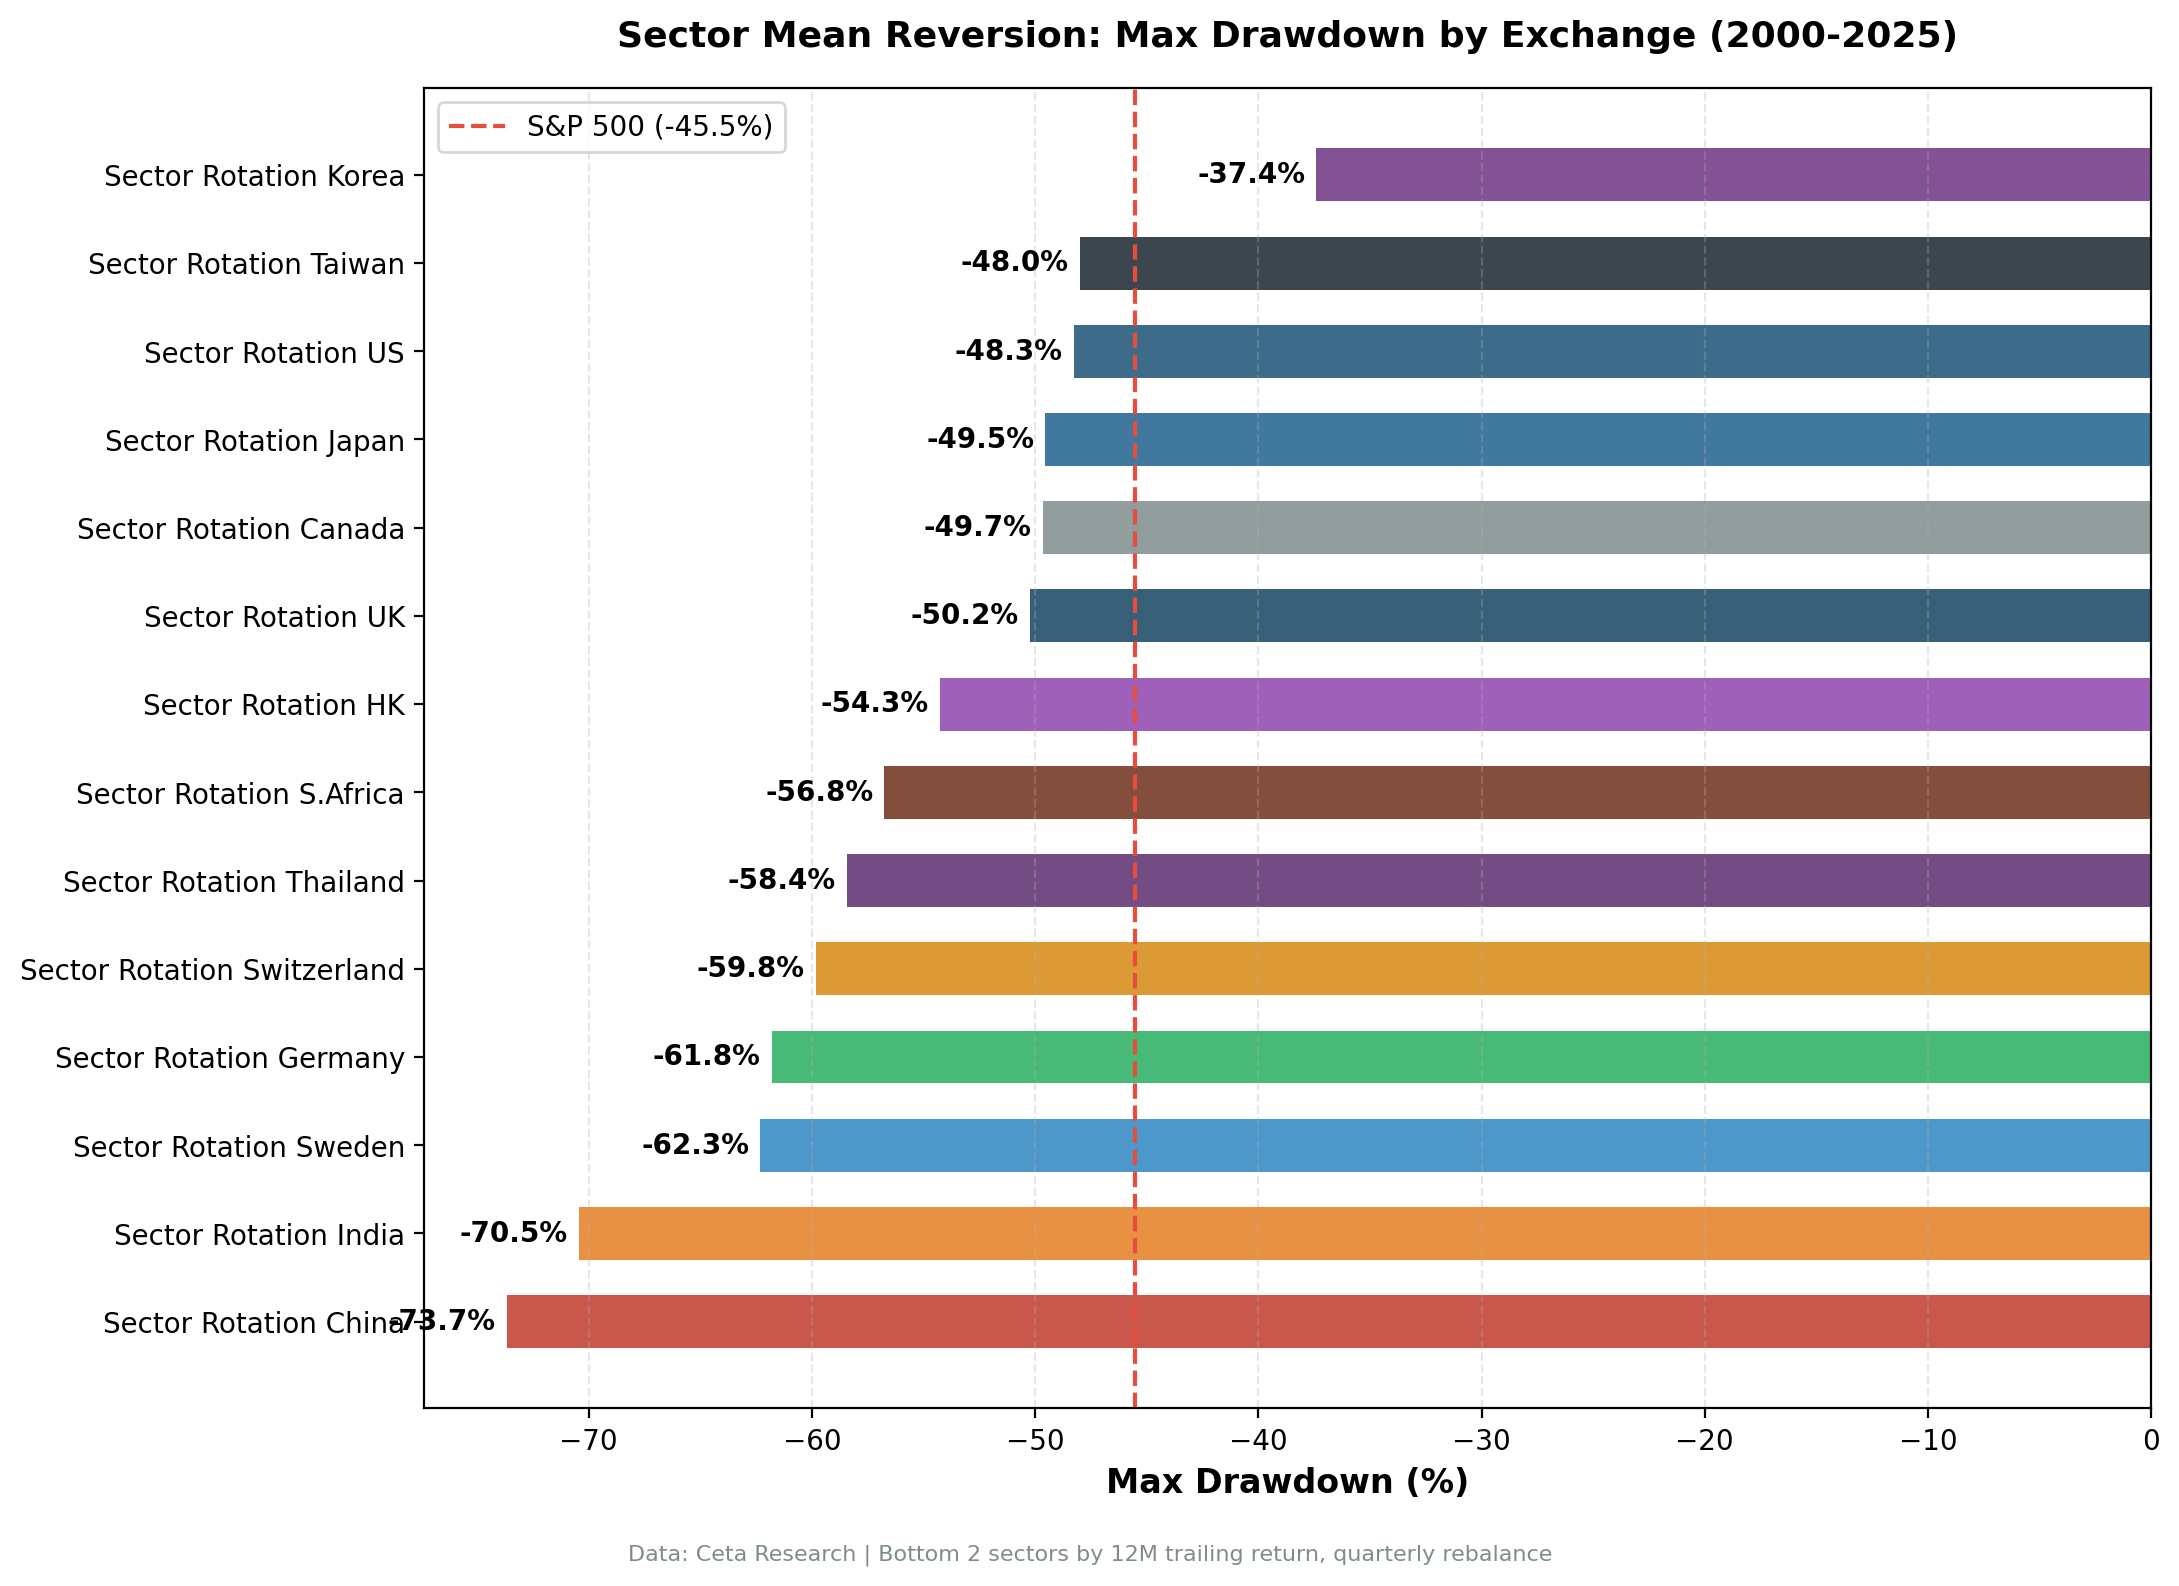
Max drawdowns cluster in two groups. Shallow (<-50%): Korea (-37.4%), Taiwan (-48.0%), US (-48.3%), Japan (-49.6%), Canada (-49.7%), UK (-50.2%), Hong Kong (-54.3%). Deep (>-55%): South Africa (-56.8%), Thailand (-58.4%), Switzerland (-59.8%), Germany (-61.8%), Sweden (-62.3%), India (-70.5%), China (-73.7%).
India's -70.5% and China's -73.7% are worth holding in mind. The strategy earned 16.42% in India and 8.25% in China, but holding through those drawdowns requires genuine conviction. An investor who entered at the wrong moment in either market would have been down more than 70% before the recoveries came.
Exchange Notes
South Africa (JNB): proceed with caution. The 10.58% CAGR and +2.56% excess return look compelling. The Sharpe of 0.052 is the warning sign. With only 16 average stocks per quarter, individual company events dominate year-over-year returns. One mining disaster, one political shock, one currency devaluation can swing the annual return by 30 points in either direction. The excess return is real over 26 years, but the year-by-year variance is too high to describe this as a reliable strategy. It's a data point, not a recommendation.
China (SHH+SHZ): extreme volatility limits practical use. The 2007 return of +164.9% is the highest single-year result in this entire study. It reflects the extraordinary speculative bubble in Chinese A-shares that year, not a repeatable pattern. The 26.6% down capture and +0.23% long-run excess are real data points. But the 34.7% annualized volatility, -73.7% max drawdown, and the regulatory/geopolitical risks embedded in mainland Chinese markets make consistent execution difficult. Included as a data point.
Backtest Methodology
| Parameter | Choice |
|---|---|
| Signal | Bottom 2 sectors by equal-weighted 12-month trailing return |
| Portfolio | All qualifying stocks in selected sectors, equal weight |
| Rebalancing | Quarterly (January, April, July, October) |
| Cash rule | Hold cash if fewer than 5 stocks qualify |
| Minimum market cap | Exchange-specific threshold |
| Sector classification | FMP sector tags |
| Period | 2000-2025 (26 years, 104 quarters) |
| Data source | Ceta Research (FMP financial data warehouse) |
| Benchmark | S&P 500 Total Return (SPY, USD) |
Full backtest code (Python): github.com/ceta-research/backtests
Limitations
Currency risk. Returns are in local currency. An investor running the India strategy from outside India earns INR returns and then converts. Over 26 years, currency moves can add or subtract 1-2% annually. Local currency returns are the cleanest comparison for strategy alpha, but they're not what foreign investors actually earn.
EM liquidity. With 133 average stocks in India and 81 in Taiwan, the universe is broad. But smaller names in the bottom sectors may have limited liquidity at quarterly rebalance. Real-world execution in EM markets carries wider bid-ask spreads and market impact that the backtest doesn't capture.
Survivorship bias. Exchange membership uses current profiles, not historical. Delisted companies, including failures, aren't tracked over time. This bias skews results upward across all exchanges, but likely more so in markets with higher delisting rates.
Data quality varies by market. South Africa and some smaller exchanges have thinner FMP coverage. Higher cash periods in these markets reflect data gaps as much as genuine signal scarcity.
Structural change risk. The strategy assumes sector underperformance is cyclical. When it's structural, the strategy buys into continued decline. Energy globally post-2014 is the clearest example.
Benchmark mismatch. Using USD-denominated SPY as a benchmark for local currency strategies conflates local equity alpha with currency effects. Excess returns should be read as local alpha, not total dollar returns.
Takeaway
Sector mean reversion produces a 12-point spread in excess CAGR across 14 exchanges. India at +8.40%, Korea at +6.63%, Taiwan at +6.58% on one end. Germany at -3.20%, Switzerland at -3.51% on the other.
The split is explained by market structure. Emerging markets with cyclical sector compositions mean-revert cleanly. European developed markets with structurally defensive sectors don't. Buying the beaten-down sector works when the beating is sentiment-driven. It fails when the beating is structural.
Korea and Taiwan are the most attractive implementations: both produce strong returns with lower-than-SPY max drawdowns and down capture ratios that protect capital in bad years. India produces the highest CAGR but requires tolerance for a -70.5% drawdown.
For the developed market exchanges. UK, Germany, Switzerland, the strategy added no value and destroyed it in most cases. The signal picks up on sectors that are genuinely troubled, not temporarily out of favor.
Japan sits in an interesting middle zone: near-breakeven in JPY terms with solid downside protection (57.7% down capture), but not enough excess return to recommend over a passive index.
The practical conclusion: this strategy is worth considering in EM Asia. The data doesn't support it in Continental Europe.
See Individual Exchange Analysis
- Sector Mean Reversion on US Stocks (NYSE + NASDAQ + AMEX), 10.59% CAGR, +2.57% excess, Sharpe 0.319
- Sector Mean Reversion on Indian Stocks (BSE + NSE), 16.42% CAGR, +8.40% excess, Sharpe 0.265
- Sector Mean Reversion on Korean Stocks (KSC), 14.65% CAGR, +6.63% excess, Sharpe 0.466
- Sector Mean Reversion on Taiwanese Stocks (TAI + TWO), 14.60% CAGR, +6.58% excess, Sharpe 0.495
- Sector Mean Reversion on Swedish Stocks (STO), 12.63% CAGR, +4.61% excess, Sharpe 0.425
- Sector Mean Reversion on UK Stocks (LSE), 6.47% CAGR, -1.56% excess, Sharpe 0.124
- Sector Mean Reversion on German Stocks (XETRA), 4.82% CAGR, -3.20% excess, Sharpe 0.133
- Sector Mean Reversion on Canadian Stocks (TSX), 8.41% CAGR, +0.38% excess, Sharpe 0.228
- Sector Mean Reversion on Hong Kong Stocks (HKSE), 6.51% CAGR, -1.51% excess, Sharpe 0.126
- Sector Mean Reversion on Swiss Stocks (SIX), 4.51% CAGR, -3.51% excess, Sharpe 0.204
- Sector Mean Reversion on Thai Stocks (SET), 8.82% CAGR, +0.80% excess, Sharpe 0.232
- Sector Mean Reversion on Japanese Stocks (JPX), 7.12% CAGR, -0.91% excess, Sharpe 0.337
References
- Moskowitz, T. & Grinblatt, M. (1999). "Do Industries Explain Momentum?" Journal of Finance, 54(4), 1249-1290.
Part of a Series: US | Global | US | UK | Thailand | Taiwan | Taiwan | Switzerland
Run It Yourself
Explore the data behind this analysis on Ceta Research. Query our financial data warehouse with SQL, build custom screens, and run your own backtests across 70,000+ stocks on 20 exchanges.
Data: Ceta Research, FMP financial data warehouse. 14 exchanges, quarterly rebalance, equal weight, 2000-2025. Returns in local currency.


