
P/TBV Across 15 Markets: Where Hard Assets Pay Off

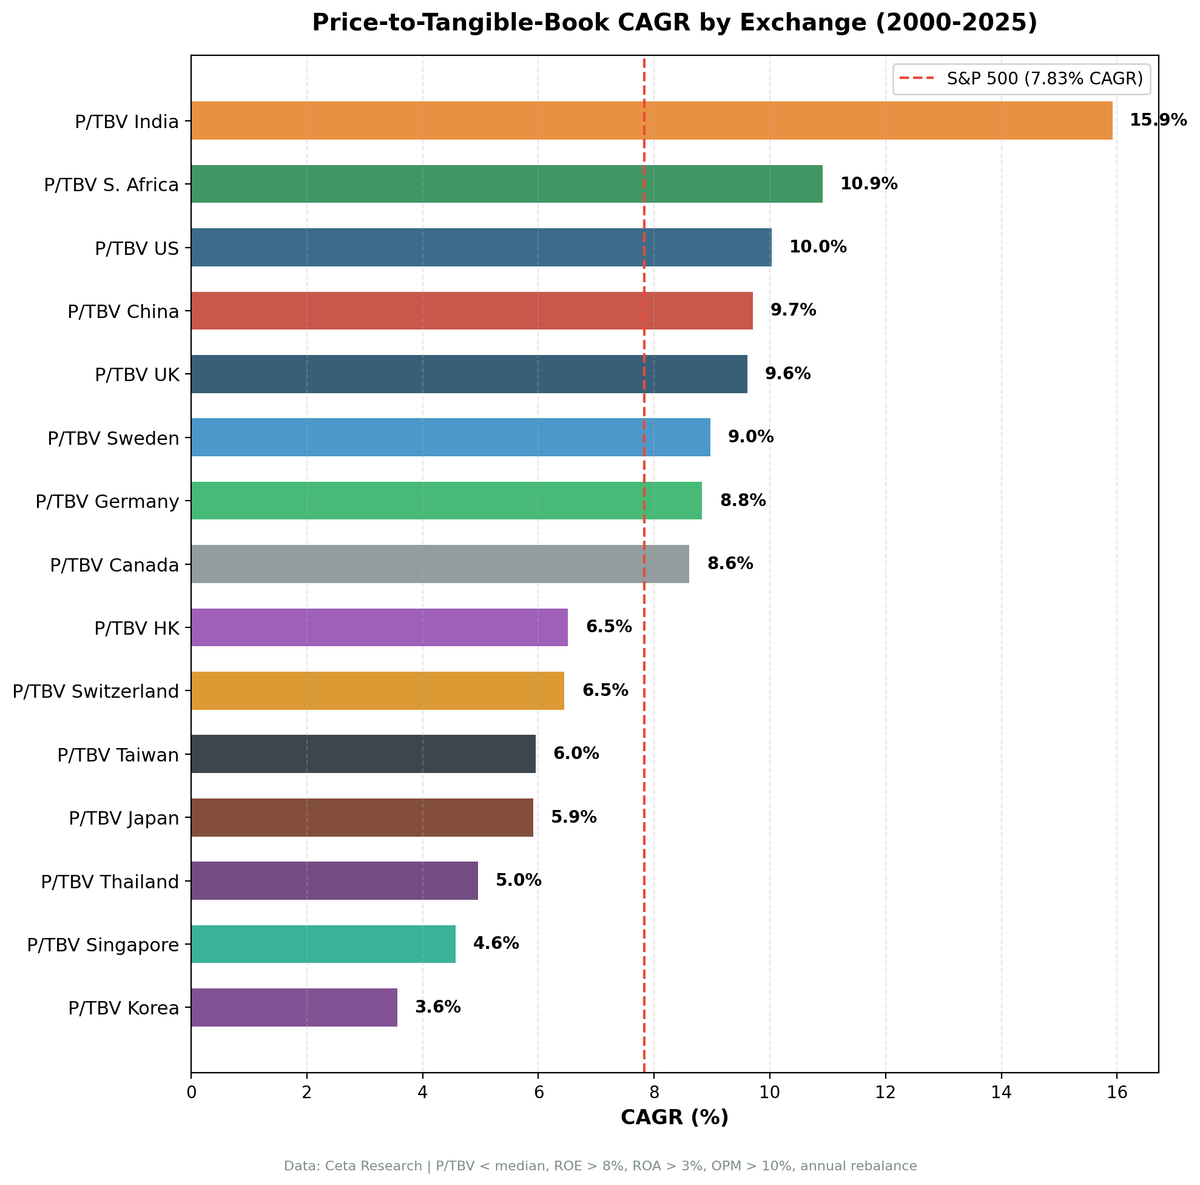
Eight of 15 exchanges beat the S&P 500 over 25 years using a Price-to-Tangible-Book strategy. The split isn't random. Tangible book works where physical and financial assets are the primary value driver: manufacturing, banking, energy, materials. It struggles where intangibles dominate: tech-heavy markets, pharma-heavy markets, conglomerate structures where the underlying book value is ambiguous. The exceptions, Japan and Korea especially, reveal structural limits that are worth understanding before applying the strategy globally.
Contents
- The Strategy
- Full Results: 15 Exchanges
- The Split Pattern
- The Decoupling Story: China, India, and Germany
- Why Korea Failed: -4.27% Excess Return
- Why Japan Failed: The Value Trap That Never Closes
- Why Singapore Failed: Too Few Stocks
- Switzerland: Quality Companies, Wrong Signal
- Sharpe Ranking: Risk-Adjusted Picture
- What This Means for a Global Portfolio
- Current Global Screen
- Limitations
- Dedicated Regional Blogs
The Strategy
We screened each exchange for companies with low P/TBV (market cap divided by tangible book value, with goodwill and intangibles removed), applied quality filters of ROE > 8%, ROA > 3%, and operating margin > 10%, then held the 30 cheapest qualifying stocks annually, rebalancing each July with a 45-day filing lag. Market cap thresholds were set per exchange. The minimum portfolio size was 10 stocks; periods below the threshold resulted in a cash position.
The academic grounding comes from Fama and French (1992), who identified book-to-market as one of the most persistent predictors of long-run equity returns. Tangible book goes further: it removes goodwill and acquired intangibles that inflate standard P/B ratios, leaving only hard assets and financial claims.
Full Results: 15 Exchanges
| Exchange | Market | CAGR | vs SPY | Sharpe | MaxDD | Cash | Avg Stocks |
|---|---|---|---|---|---|---|---|
| BSE_NSE | India | 15.92% | +8.09% | 0.321 | -34.13% | 8% | 25.9 |
| JNB | S. Africa | 10.91% | +3.08% | 0.091* | -33.51% | 16% | 21.8 |
| NYSE_NASDAQ_AMEX | US | 10.03% | +2.20% | 0.438 | -38.73% | 0% | 23.0 |
| SHZ_SHH | China | 9.71% | +1.88% | 0.184 | -36.89% | 0% | 25.4 |
| LSE | UK | 9.61% | +1.78% | 0.308 | -31.25% | 0% | 20.7 |
| STO | Sweden | 8.97% | +1.14% | 0.370 | -37.53% | 16% | 25.3 |
| XETRA | Germany | 8.83% | +1.00% | 0.340 | -33.80% | 0% | 19.5 |
| TSX | Canada | 8.61% | +0.77% | 0.305 | -35.62% | 0% | 24.3 |
| HKSE | Hong Kong | 6.51% | -1.32% | 0.182 | -24.68% | 0% | 22.7 |
| SIX | Switzerland | 6.45% | -1.38% | 0.342 | -36.26% | 0% | 19.1 |
| TAI_TWO | Taiwan | 5.95% | -1.88% | 0.327 | -15.44% | 20% | 27.5 |
| JPX | Japan | 5.91% | -1.92% | 0.263 | -46.11% | 8% | 27.5 |
| SET | Thailand | 4.96% | -2.87% | 0.160 | -32.54% | 12% | 26.0 |
| SES | Singapore | 4.57% | -3.26% | 0.107 | -43.16% | 20% | 13.7 |
| KSC | Korea | 3.56% | -4.27% | 0.034 | -23.22% | 28% | 28.1 |
SPY CAGR: 7.83%
*South Africa's Sharpe is low because the risk-free rate is 9% (government bonds). The raw CAGR of 10.91% is real outperformance.
The Split Pattern
Eight exchanges beat SPY. Seven don't. The line between them is largely structural.
Markets that work: India, South Africa, US, China, UK, Sweden, Germany, Canada. All of them are characterized by substantial industrial, manufacturing, banking, or resource sectors where physical and financial assets dominate balance sheets. When you strip goodwill and intangibles from book value, what's left in these markets is meaningful.
Markets that don't work: Hong Kong, Switzerland, Taiwan, Japan, Thailand, Singapore, Korea. The failure modes differ but the theme is consistent. In some (Switzerland, Taiwan), the most valuable companies derive most of their worth from intangibles. In others (Japan, Korea), the signal fires but there's no catalyst to close the discount. In Singapore, the universe is simply too thin.
The quality filters (ROE, ROA, OPM) prevent the screen from buying distressed asset dumps. But they can't fix a market where tangible book value is structurally decoupled from the actual drivers of company value.
The Decoupling Story: China, India, and Germany
The most interesting column in the results table isn't CAGR. It's down capture.
| Exchange | Down Capture vs SPY |
|---|---|
| India | -9.57% |
| China | -67.38% |
| Germany | -22.69% |
| S. Africa | +4.98% |
| US | +10.71% |
| Canada | +26.75% |
| Taiwan | +26.38% |
| Korea | +37.85% |
| Thailand | +47.62% |
| UK | +36.47% |
| Singapore | +64.13% |
| Switzerland | +56.87% |
| Hong Kong | +54.53% |
| Sweden | +79.14% |
| Japan | +83.28% |
Negative down capture means those exchanges gain when SPY falls. China, Germany, and India don't just outperform over the long run. They actively decouple from US drawdowns.
China's number is dramatic: -67.38%. The Chinese market moves on domestic policy, credit cycles, and commodity demand, not on US monetary conditions. When the Federal Reserve tightens and US stocks fall, Chinese low-P/TBV manufacturers and financials aren't directly exposed. They may even benefit if the dollar strengthens relative to commodities China imports. The beta for China in this strategy is 0.113, close to zero correlation with SPY.
India similarly benefits from domestic consumption demand that isn't tightly linked to US credit conditions. German industrials are exposed to global trade, but Germany's economic cycle diverges enough from the US that down capture stays negative.
This isn't diversification in the theoretical sense. These are real economic decouplings: different business cycles, different central banks, different currency regimes. The tangible-book screen in these markets selects companies that are genuinely operating in different macro environments.
Why Korea Failed: -4.27% Excess Return
Korea is the worst result in the dataset. The strategy returned 3.56% CAGR against SPY's 7.83%, underperforming by 4.27 percentage points annually. With 28% cash (the highest of any exchange), there were too few qualifying periods to build a reliable record.
Three structural issues combine in Korea.
First, chaebol cross-holdings. Korean conglomerates like Samsung, SK, Hyundai, and LG hold stakes in each other through complex ownership chains. Goodwill and intangibles are stripped from tangible book in our calculation, but the remaining "tangible" book often includes non-core financial assets, subsidiaries at book value, and receivables from related parties. The signal is noisy because the balance sheets don't reflect clean economic ownership of productive assets.
Second, the real value in Korea's leading companies is intangible. Samsung's semiconductor IP, SK Hynix's process technology, LG Chem's battery chemistry: these are the actual value drivers. Tangible book strips them out and points the screen toward the wrong companies, those with lots of physical assets but weaker competitive positions.
Third, Korean P/TBV stocks trade at persistent discounts partly because of governance concerns. Foreign investors price in a Korea discount for minority shareholders. A stock trading cheaply relative to tangible book in Korea might stay cheap indefinitely, which is exactly what happened across most of our 25-year window.
Why Japan Failed: The Value Trap That Never Closes
Japan puzzles people. Toyota, Panasonic, Hitachi, Mitsubishi Electric: exactly the kind of heavy manufacturing businesses where P/TBV should identify cheap, high-quality companies. The strategy returned only 5.91% CAGR, underperforming SPY by 1.92% annually. Max drawdown was -46.11%, the worst of any exchange.
The issue isn't that Japanese companies aren't cheap by tangible book. They are, historically. Warren Buffett famously bought stakes in Japanese trading houses (Itochu, Marubeni, Mitsubishi, Mitsui, Sumitomo) at prices below 0.7x book value. The issue is that Japanese companies maintain low P/TBV intentionally, through conservative accounting, high cash hoarding, cross-shareholdings, and limited payout policies. The discount reflects governance and capital allocation culture, not just misprice.
There's no catalyst to close the gap in Japan's case. A US industrial might trade cheap for a few years before an activist investor, a strategic acquirer, or shareholder pressure forces the discount to close. Japanese companies can trade cheap for decades with little pressure to change. The value is real on paper. The timeline for realizing it is undefined.
The quality filters help avoid the worst cases, but they can't solve the fundamental issue: cheap Japanese tangible book doesn't reliably rerate upward.
Why Singapore Failed: Too Few Stocks
Singapore's problem is simpler: the average holding was 13.7 stocks per period, well below the 20+ we consider meaningful for portfolio diversification. Singapore's exchange is large by market cap, but the universe of companies that simultaneously pass the quality filters and the mktcap threshold and have negative goodwill-adjusted book values is thin.
With 13.7 average holdings and 20% cash periods, the results are dominated by individual company outcomes rather than a systematic factor. The strategy returned 4.57% CAGR, but that number reflects concentrated positions more than a repeatable screening approach.
Switzerland: Quality Companies, Wrong Signal
Switzerland returned 6.45% CAGR, -1.38% vs SPY. The failure is structural. Switzerland's market is dominated by Nestlé, Roche, and Novartis: companies whose value is almost entirely in brands, patents, and research pipelines. Stripping goodwill and intangibles from their book value leaves a denominator that dramatically understates their economic worth. The P/TBV ratio appears high, excluding the best Swiss companies from the screen.
What passes the screen instead are Swiss industrials and financials with more physical asset intensity. These are solid businesses, but they're not the companies that drive Swiss equity returns. The strategy captures the wrong slice of the Swiss market.
Sharpe Ranking: Risk-Adjusted Picture
When you adjust for volatility, the rankings shift.
| Exchange | Sharpe |
|---|---|
| US | 0.438 |
| Sweden | 0.370 |
| Switzerland | 0.342 |
| Germany | 0.340 |
| Taiwan | 0.327 |
| India | 0.321 |
| UK | 0.308 |
| Canada | 0.305 |
| China | 0.184 |
| Hong Kong | 0.182 |
| Thailand | 0.160 |
| Singapore | 0.107 |
| South Africa | 0.091 |
| Korea | 0.034 |
The US has the best Sharpe ratio: 0.438. It generates excess return with the least volatility. India's high CAGR comes with enough variance to push its Sharpe below Sweden and Germany.
China's Sharpe of 0.184 is modest despite its CAGR of 9.71%. Chinese markets are more volatile, and the high CAGR includes some extraordinary years (2007: +164.9% driven by a domestic speculative bubble) that inflate the compound return while also inflating variance.
South Africa's 0.091 Sharpe is an artifact of the 9% risk-free rate, not poor absolute performance. The raw return of 10.91% is the strongest evidence. When your benchmark for risk-free return is a 9% government bond, almost any equity strategy will look poor on Sharpe.
What This Means for a Global Portfolio
The natural application of this data is diversification. If you hold US equities as your core position, adding India or Germany provides real economic decoupling (negative down capture) plus excess return above SPY. Sweden and UK add more modest return at reasonable correlation levels. Canada adds minimal excess return but with low down capture.
The exchanges below SPY don't belong in a P/TBV portfolio. The signal doesn't work reliably in Korea, Singapore, or Switzerland for structural reasons. Japan's value trap problem has persisted for decades and there's no sign it's changing.
The most interesting portfolio construction question isn't "which exchange beats SPY" but "which combination of exchanges provides the best risk-adjusted return with genuine diversification." India and Germany together with the US gives you three different economic cycles, three different currencies, and genuine downside protection from the combination.
Current Global Screen
The current global P/TBV screen across all 15 exchanges is available at cetaresearch.com/data-explorer?q=ghSKbD6V_3. You can run the query yourself to see which companies currently pass the screen in each market.
Limitations
All returns are in local currency. Currency movements between markets will affect USD-based investors in ways not captured here.
The 2000-2003 period for some exchanges (notably Sweden, South Africa) includes cash periods that coincided with the dot-com crash. This inflates those exchanges' early cumulative returns in ways that aren't repeatable.
Mktcap thresholds were set per exchange and may not capture the full investable universe, particularly for smaller exchanges (Singapore, Sweden in early years).
Survivorship bias is partially mitigated by using the full FMP database including delisted companies, but this varies by exchange and time period. Emerging markets before 2005 have thinner data coverage than developed markets.
Dedicated Regional Blogs
- US: NYSE/NASDAQ/AMEX
- India: BSE/NSE
- UK: London Stock Exchange
- Germany: XETRA
- China: Shanghai/Shenzhen
- Sweden: Stockholm Stock Exchange
- Canada: Toronto Stock Exchange
Part of a Series: US | UK | Sweden | India | Germany | China | Canada
Data: Ceta Research (FMP financial data warehouse), 2000-2024. 15 exchanges. Annual rebalance, July. Equal weight, top 30 by P/TBV ascending per exchange. SPY used as benchmark for excess return and capture ratios.


