
Price-to-Tangible-Book in China: 9.84% CAGR and +7.41% Alpha Over the SSE Composite
The P/TBV strategy on China's Shenzhen and Shanghai exchanges returned 9.84% annualised over 25 years against the SSE Composite's 2.43%, adding 7.41% per year. It beat the domestic benchmark in 18 of 25 years.

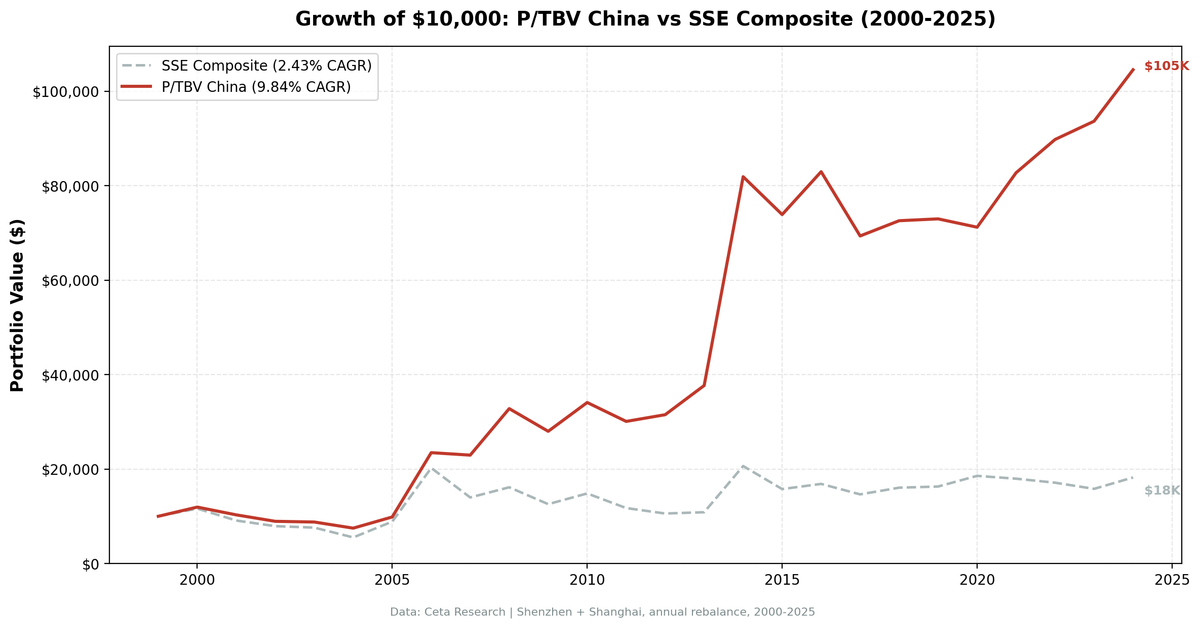
The P/TBV strategy on China's Shenzhen and Shanghai exchanges returned 9.84% annualised over 25 years against the SSE Composite's 2.43%, adding 7.41% per year. The SSE Composite barely grew over a quarter century. The strategy delivered roughly four times the annualised return. In 2008, while the SSE gained 15.41%, the strategy returned +42.90%. In 2014, the strategy more than doubled: +117.30% against the SSE's +89.99%. The win rate of 72% means the strategy beat the domestic benchmark in 18 of 25 years.
Contents
Data: FMP financial data warehouse, 2000–2025. Updated June 2026.
The Strategy
Price-to-Tangible-Book removes goodwill and intangible assets from book value before dividing into market cap: P/TBV = marketCap / (totalStockholdersEquity - goodwill - intangibleAssets). What remains captures only the physical business: land, equipment, inventory, receivables.
China's listed universe is manufacturing-heavy. Shenzhen and Shanghai are dominated by companies in industrials, basic materials, energy, and consumer goods. These businesses carry large tangible asset bases. A low P/TBV screen in China finds companies trading below their physical asset value with quality earnings, which in this market frequently means manufacturers with real pricing power and domestic demand exposure.
Quality filters prevent the strategy from buying distressed or hollow companies. We require ROE above 8%, ROA above 3%, and operating profit margin above 10%. These thresholds kept the portfolio in genuinely profitable businesses through 25 years of Chinese market cycles.
| Parameter | Value |
|---|---|
| Signal | P/TBV ascending (lowest first) |
| Quality filters | ROE > 8%, ROA > 3%, OPM > 10% |
| Rebalance | Annual (July), 45-day filing lag |
| Portfolio size | Top 30, equal weight |
| Minimum stocks | 10 (else cash) |
| Market cap threshold | ¥2B (~$276M USD) |
| Universe | Shenzhen (SHZ) + Shanghai (SHH) |
| Period | 2000-2025 (25 years) |
| Benchmark | SSE Composite |
What We Found
The down capture of 31.92% tells you the strategy absorbs less than a third of the SSE's losses in bad years. Beta of 0.958 means the strategy moves roughly in line with the Chinese market overall, but alpha of 7.41% shows it consistently adds return on top. This is a domestic alpha story: the quality-filtered P/TBV screen selects better companies from within the Chinese market.
The two bull market episodes are captured cleanly. In 2006, the strategy returned +138.14% against the SSE's +128.14%. The China A-share boom was driven by real earnings growth in manufacturing as Chinese exporters benefited from commodity and consumer goods demand. Low P/TBV filtered out speculative names and kept the portfolio in manufacturing and industrial stocks that had the earnings to justify the re-rating. In 2014, +117.30% against the SSE's +89.99% as a second bull wave driven by domestic retail flows and policy support hit the same kinds of names again. In both booms, the strategy outperformed the index by capturing the quality end of the rally.
The Sharpe ratio of 0.195 looks low but needs context. China's risk-free rate (government bond yield) is around 2.5%, which means the excess return calculation is less penalised by the rate assumption. Compared to domestic Chinese investment alternatives at the same risk level, this strategy looks considerably stronger than the raw Sharpe suggests.
The 2007-2008 period is worth examining. In 2007, the SSE fell 30.88% and the strategy lost only 2.22%, a 29-point outperformance. The following year, the SSE rebounded +15.41% and the strategy surged +42.90%, nearly tripling the index return. The strategy captured the recovery far more aggressively than the broad market.
The recent period from 2019 to 2023 tells a more nuanced story. Returns were mixed: +0.54% in 2019, -2.42% in 2020, +16.20% in 2021, +8.51% in 2022, +4.31% in 2023. Versus the SSE, the strategy outperformed in 2021 (+19.42% excess), 2022 (+13.25% excess), and 2023 (+11.92% excess). China's property sector crisis after 2021 hit the broad index hard, but the quality-filtered P/TBV portfolio held up better. The strategy doesn't hold property companies whose tangible base is actively deteriorating, because the quality filters (ROE, ROA) catch that deterioration.
China averaged 25.0 stocks per period with zero cash years. The universe is large enough that the quality screen always found sufficient qualifying companies.
Annual Returns
| Year | Strategy | SSE Composite | Excess |
|---|---|---|---|
| 2000 | +19.47% | +16.37% | +3.09% |
| 2001 | -13.80% | -21.81% | +8.01% |
| 2002 | -13.26% | -13.06% | -0.20% |
| 2003 | -1.65% | -3.90% | +2.25% |
| 2004 | -14.78% | -27.33% | +12.55% |
| 2005 | +31.66% | +60.56% | -28.91% |
| 2006 | +138.14% | +128.14% | +10.00% |
| 2007 | -2.22% | -30.88% | +28.66% |
| 2008 | +42.90% | +15.41% | +27.49% |
| 2009 | -14.64% | -22.13% | +7.50% |
| 2010 | +21.78% | +18.04% | +3.74% |
| 2011 | -11.74% | -20.86% | +9.12% |
| 2012 | +4.72% | -9.86% | +14.58% |
| 2013 | +19.62% | +2.63% | +16.99% |
| 2014 | +117.30% | +89.99% | +27.31% |
| 2015 | -9.78% | -23.62% | +13.84% |
| 2016 | +12.28% | +6.94% | +5.34% |
| 2017 | -16.40% | -13.15% | -3.25% |
| 2018 | +4.65% | +9.67% | -5.02% |
| 2019 | +0.54% | +1.53% | -1.00% |
| 2020 | -2.42% | +13.85% | -16.28% |
| 2021 | +16.20% | -3.22% | +19.42% |
| 2022 | +8.51% | -4.74% | +13.25% |
| 2023 | +4.31% | -7.61% | +11.92% |
| 2024 | +11.63% | +15.27% | -3.65% |
The Current Screen
The US screen is available at cetaresearch.com/data-explorer?q=5GCSAfLr-m. Exchange-specific queries for Shenzhen and Shanghai can be run directly on the data explorer at cetaresearch.com.
Limitations
The bull market years of 2006 and 2014 (+138% and +117%) dominate the CAGR calculation. Without those two years, the compound return is substantially lower. These aren't regular market cycles. They were policy-driven retail investor waves that hit the same types of stocks the strategy naturally holds. Don't extrapolate them as a recurring feature.
Property sector risk is real and ongoing. After 2021, tangible-book signals in property-adjacent companies pointed at deteriorating assets dressed up in old balance sheet values. The filing lag means the strategy rebalances on financials that may already be outdated when property values are moving fast.
Foreign access to A-share markets is constrained. Shenzhen and Shanghai are accessible to foreign investors through the Stock Connect programs, but position limits, repatriation rules, and currency management (CNY is not freely convertible) create friction that doesn't appear in backtest returns. A USD-based investor faces CNY/USD exposure in addition to equity risk.
The 2020 result (-2.42% vs SSE +13.85%) is a clear underperformance year. The strategy missed the broad market rally driven by tech and growth names that don't pass tangible-book screens. This is the trade-off of a value-tilted approach in a market increasingly influenced by growth sectors.
Part of a Series
This post is part of a multi-exchange series on the Price-to-Tangible-Book strategy. The US flagship backtest, including full methodology and global results summary, is at ptbv-strategy-us-backtest.
Data: Ceta Research (FMP financial data warehouse), 2000-2025. Full methodology: backtests/METHODOLOGY.md
Past performance does not guarantee future results. This is educational content, not investment advice.


