
Price-to-Tangible-Book in the UK: 10.46% CAGR and +9.24% Alpha Over the FTSE 100
The P/TBV strategy on the London Stock Exchange returned 10.46% annualised over 25 years against the FTSE 100's 1.23%, adding 9.24% per year with a maximum drawdown of -38.54%. It beat the FTSE in 20 out of 25 years.

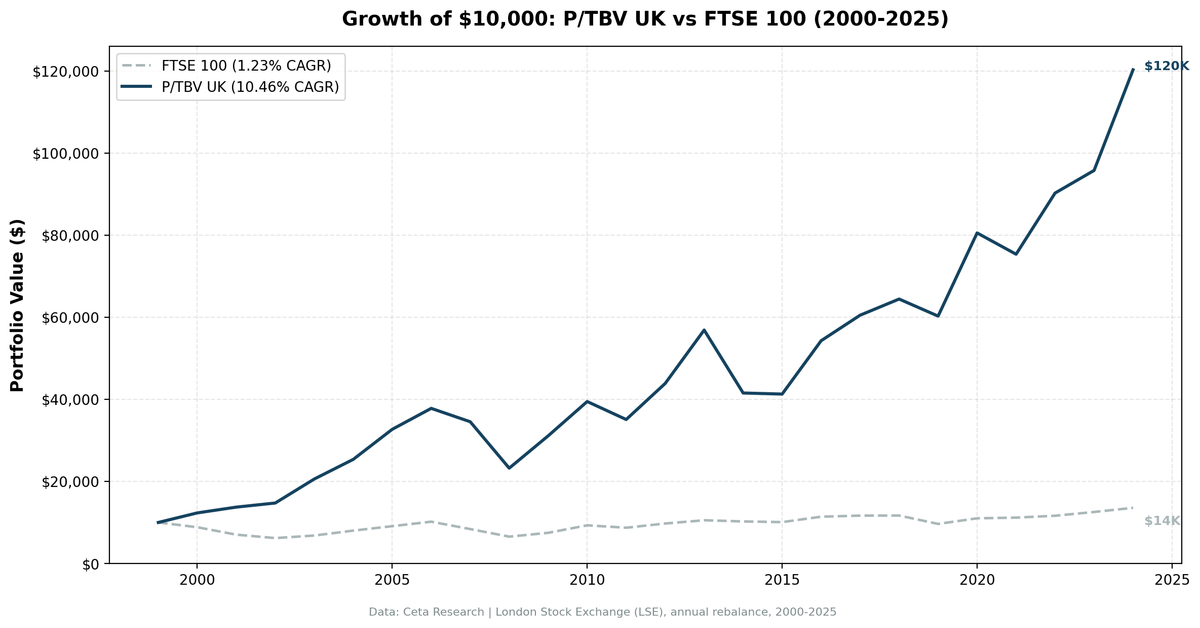
The P/TBV strategy on the London Stock Exchange returned 10.46% annualised over 25 years against the FTSE 100's 1.23%, adding 9.24% per year. That excess return is the real story here. The FTSE 100 barely kept up with inflation over this period, while the strategy compounded at more than eight times the index rate. Maximum drawdown of -38.54% is the cost, and the strategy beat the FTSE in 20 out of 25 years.
Contents
Data: FMP financial data warehouse, 2000–2025. Updated June 2026.
The Strategy
Price-to-Tangible-Book strips goodwill and intangibles out of book value before dividing into market cap. The formula: P/TBV = marketCap / (totalStockholdersEquity - goodwill - intangibleAssets). What remains is the value of things you can actually touch: factories, equipment, land, inventory, receivables.
This distinction matters enormously in a market like the UK, where industrials, financials, and energy companies dominate the large-cap index. These businesses carry real asset bases. A bank's book value is largely loans and securities. A manufacturer's book value is machinery and property. Stripping intangibles gives you a cleaner picture of whether you're paying a fair price for the physical business.
Quality filters prevent the strategy from buying cheap-but-broken companies. We require ROE above 8%, ROA above 3%, and operating profit margin above 10%. These thresholds keep the portfolio in profitable businesses with real earnings power, not just cheap balance sheets.
| Parameter | Value |
|---|---|
| Signal | P/TBV ascending (lowest first) |
| Quality filters | ROE > 8%, ROA > 3%, OPM > 10% |
| Rebalance | Annual (July), 45-day filing lag |
| Portfolio size | Top 30, equal weight |
| Minimum stocks | 10 (else cash) |
| Market cap threshold | £500M (~$635M USD) |
| Universe | London Stock Exchange |
| Period | 2000-2025 (25 years) |
| Benchmark | FTSE 100 |
What We Found
The UK never went to cash over 25 years, but the portfolio runs thinner than most markets in this series: 12.6 stocks per period on average. LSE price data required the heaviest data-quality cleanup of any exchange we test (phantom price rows and broken split adjustments in the source data), and stocks without clean prices at both ends of a holding period are excluded from return calculations. The qualifying universe is real but small, so individual stock outcomes carry more weight here than in the US or Japan.
The down-capture ratio of 39.85% tells you the strategy absorbs about 40% of the FTSE's losses in bad years. In 2007, the FTSE fell 17.67%. The strategy lost 8.63%, less than half. In 2008, the FTSE dropped 21.97% and the strategy fell 32.74%, the one year where it underperformed badly during a downturn. The financial crisis hit UK banks as hard as any market, and banks are a substantial part of the low P/TBV universe. That year is the exception, not the rule.
The win rate of 80% is striking. In 20 of 25 years, the strategy beat the FTSE 100. That consistency, combined with the 9.24% annual excess, makes this one of the strongest regional results in the series.
Three years stand out for different reasons. The 2003-2005 stretch produced +40%, +23%, and +29% in consecutive years while the FTSE returned +10%, +18%, and +14%. UK industrials and financials were deep value coming out of the 2001-2002 downturn, and the strategy captured that recovery cleanly. In 2016, the strategy returned +31.48% against the FTSE's +13.11%. The Brexit vote repriced UK assets aggressively lower in GBP terms, creating extreme tangible-book discounts. The portfolio entered a period of genuine undervaluation and recovered sharply within months.
The weak spots are 2014 and 2021. In 2014, the strategy lost 26.97% while the FTSE fell just 2.73%, the worst relative year in the dataset. Commodity-linked and mining names that cluster at the cheap end of the LSE universe sold off hard as oil and metals prices collapsed. In 2021, the strategy lost 6.44% against the FTSE's modest +1.54% gain as post-COVID rate expectations shifted against tangible-asset sectors. These aren't random noise. They're the same sector exposure that drives outperformance working against the strategy when commodity and rate environments flip.
The maximum drawdown of -38.54% is meaningful for a strategy generating over 10% annualised. Beta of 1.051 against the FTSE means the strategy moves roughly in line with the index, but alpha of 9.35% more than compensates.
Annual Returns
| Year | Strategy | FTSE 100 | Excess |
|---|---|---|---|
| 2000 | +23.27% | -11.65% | +34.92% |
| 2001 | +11.43% | -20.46% | +31.89% |
| 2002 | +7.28% | -11.87% | +19.16% |
| 2003 | +39.64% | +10.00% | +29.64% |
| 2004 | +23.28% | +17.63% | +5.66% |
| 2005 | +28.88% | +13.50% | +15.37% |
| 2006 | +15.60% | +12.00% | +3.60% |
| 2007 | -8.63% | -17.67% | +9.04% |
| 2008 | -32.74% | -21.97% | -10.77% |
| 2009 | +33.93% | +14.26% | +19.67% |
| 2010 | +26.84% | +24.38% | +2.46% |
| 2011 | -11.09% | -6.26% | -4.83% |
| 2012 | +25.02% | +11.76% | +13.26% |
| 2013 | +29.68% | +8.13% | +21.55% |
| 2014 | -26.97% | -2.73% | -24.24% |
| 2015 | -0.62% | -1.63% | +1.01% |
| 2016 | +31.48% | +13.11% | +18.37% |
| 2017 | +11.46% | +2.31% | +9.15% |
| 2018 | +6.50% | +0.15% | +6.35% |
| 2019 | -6.45% | -17.45% | +10.99% |
| 2020 | +33.62% | +14.15% | +19.47% |
| 2021 | -6.44% | +1.54% | -7.97% |
| 2022 | +19.78% | +4.07% | +15.71% |
| 2023 | +6.10% | +7.89% | -1.79% |
| 2024 | +25.61% | +8.05% | +17.56% |
The Current Screen
The US screen is available at cetaresearch.com/data-explorer?q=5GCSAfLr-m. Exchange-specific queries including LSE can be run directly on the data explorer at cetaresearch.com.
Limitations
Currency effects are real. These returns are calculated in local currency (GBP). A US-based investor would also take on GBP/USD exposure, which adds variance in both directions. Post-Brexit sterling weakness has been a persistent headwind for unhedged foreign investors.
The LSE universe is concentrated in financials and industrials. When those sectors face systemic stress, as in 2008 and 2011, the strategy has no refuge. The quality filters help but don't fully insulate against sector-level crises.
The market cap threshold of £500M cuts out small caps entirely. There's evidence that the P/TBV premium is stronger in smaller stocks, so this threshold may be leaving some of the factor's historical return on the table in exchange for liquidity and tradability.
The average portfolio of 12.6 stocks is the thinnest of any major market in this series. LSE source data needed aggressive quality filtering (phantom price rows and broken split adjustments were removed before computing returns), which shrinks the set of stocks with clean prices at both ends of each holding period. The excess return survives the cleanup, but a 12-stock portfolio is more exposed to single-name outcomes than the 20-30 stock portfolios in the US or Japan. Treat the magnitude of the UK alpha with more caution than its direction.
Part of a Series
This post is part of a multi-exchange series on the Price-to-Tangible-Book strategy. The US flagship backtest, including full methodology and the complete global results summary, is at ptbv-strategy-us-backtest.
Data: Ceta Research (FMP financial data warehouse), 2000-2025. Full methodology: backtests/METHODOLOGY.md
Past performance does not guarantee future results. This is educational content, not investment advice.

