
Price-to-Tangible-Book in Germany: 8.83% CAGR and a Negative Down

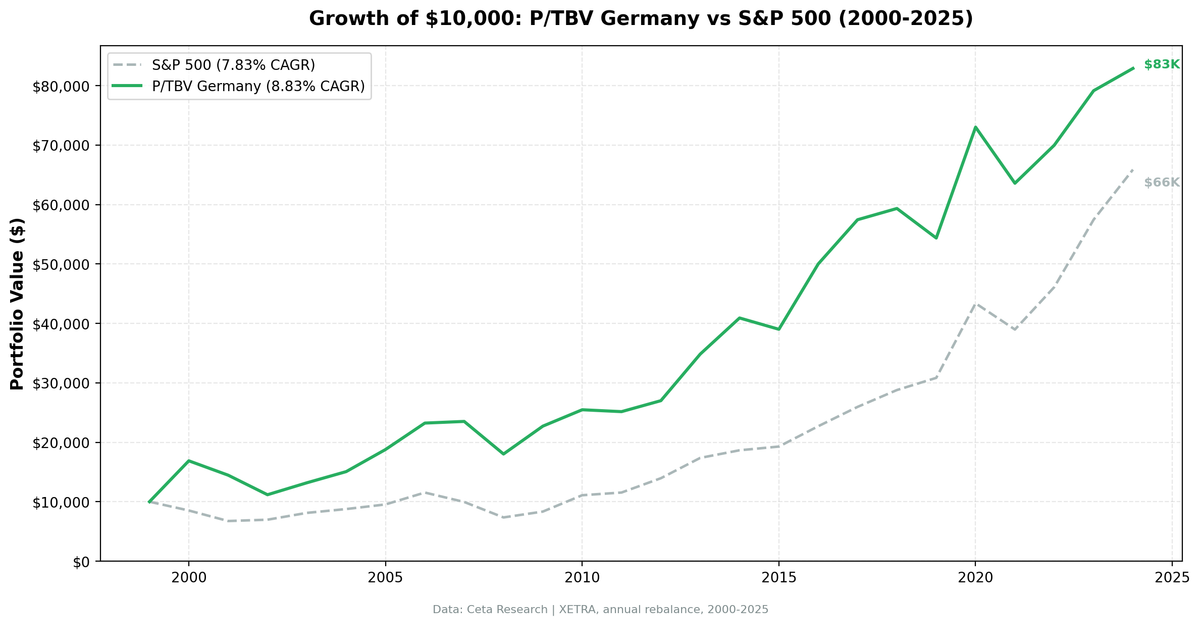
The P/TBV strategy on Germany's XETRA exchange returned 8.83% annualised over 25 years, beating SPY's 7.83% by 1.00% per year. The CAGR is the least dramatic number in this dataset. The real story is down capture: -22.69%. When SPY falls, Germany's low-P/TBV stocks don't just hold their ground, they go up. In 2007, SPY dropped 13.71% while this portfolio gained 1.19%. That's not a hedge ratio anomaly. It's a structural feature of what XETRA's industrial base actually is.
Contents
The Strategy
Price-to-Tangible-Book removes goodwill and intangible assets from book value before dividing into market cap: P/TBV = marketCap / (totalStockholdersEquity - goodwill - intangibleAssets). The result is a ratio that values only what physically exists in the business. Equipment, inventory, property, receivables.
German XETRA is dominated by Mittelstand-adjacent industrial companies: machinery manufacturers, automotive suppliers, chemical producers, specialty engineers. These businesses hold substantial tangible asset bases. Low P/TBV in Germany doesn't mean a distressed tech company trading below amortised software. It means a profitable manufacturer trading below the replacement value of its factories.
Quality filters prevent buying cheap-but-broken: ROE above 8%, ROA above 3%, operating profit margin above 10%. These keep the portfolio in companies generating real returns on their tangible base, not just cheap on paper.
| Parameter | Value |
|---|---|
| Signal | P/TBV ascending (lowest first) |
| Quality filters | ROE > 8%, ROA > 3%, OPM > 10% |
| Rebalance | Annual (July), 45-day filing lag |
| Portfolio size | Top 30, equal weight |
| Minimum stocks | 10 (else cash) |
| Market cap threshold | €500M (~$545M USD) |
| Universe | XETRA (Germany) |
| Period | 2000-2025 (25 years) |
| Benchmark | SPY |
What We Found
Germany's most visible number is 2000: +68.80% while SPY lost 14.78%. That's an 83-percentage-point gap in a single year. German manufacturers, automotive companies, and chemical producers had no exposure to the US dot-com bubble. They made things. Their book values were tangible. When US equities collapsed on multiple compression in growth names, XETRA's industrial base re-rated upward as global earnings held steady. Low P/TBV captured exactly that: companies that were cheap on tangible assets and profitable, in a market uncorrelated to what was imploding in the US.
The down capture of -22.69% is the defining characteristic. A negative down capture means the portfolio has historically gained in years when the benchmark fell. This isn't a hedging artefact. It's the result of holding companies whose earnings drivers are European industrial demand, not US consumer sentiment or tech growth rates. Beta of 0.482 confirms it: German tangible-book stocks move at roughly half the speed of SPY, and sometimes in the opposite direction.
The 2007-2008 sequence tells that story clearly. In 2007, the strategy returned +1.19% while SPY dropped 13.71%. In 2008, when the financial crisis hit globally, the strategy fell 23.32% against SPY's 26.14%. Germany absorbed the crisis better. When the damage was systemic and unavoidable, the strategy still lost less.
2014 is another inflection: +17.45% against SPY's +7.38%. European industrial earnings held up as the ECB's accommodative policy supported capex cycles, and low-P/TBV German industrials re-rated as real asset values became more appreciated by European institutional money.
The recent years have been harder. 2019 brought -8.38% as German manufacturing contracted, especially in automotive (diesel scandal aftermath, EV transition costs). 2021 through 2024 saw a mixed picture: energy cost shocks post-2022 hit German industrials structurally, and that shows in the numbers. The strategy still kept pace in 2022 (+10.07%) and 2023 (+13.10%), but 2024 at +4.74% versus SPY's +14.67% reflects genuine pressure on the German industrial model.
Germany averaged 19.5 stocks per period with zero cash years. The quality filter maintained a viable universe throughout, which is notable given how tight the screen is.
Annual Returns
| Year | Strategy | SPY |
|---|---|---|
| 2000 | +68.80% | -14.78% |
| 2001 | -14.31% | -20.77% |
| 2002 | -22.74% | +3.29% |
| 2003 | +17.96% | +16.44% |
| 2004 | +14.26% | +7.94% |
| 2005 | +24.69% | +8.86% |
| 2006 | +23.68% | +20.95% |
| 2007 | +1.19% | -13.71% |
| 2008 | -23.32% | -26.14% |
| 2009 | +26.02% | +13.42% |
| 2010 | +12.13% | +32.94% |
| 2011 | -1.24% | +4.10% |
| 2012 | +7.33% | +20.85% |
| 2013 | +29.02% | +24.50% |
| 2014 | +17.45% | +7.38% |
| 2015 | -4.65% | +3.36% |
| 2016 | +28.18% | +17.73% |
| 2017 | +14.88% | +14.34% |
| 2018 | +3.29% | +10.91% |
| 2019 | -8.38% | +7.12% |
| 2020 | +34.32% | +40.68% |
| 2021 | -12.93% | -10.17% |
| 2022 | +10.07% | +18.31% |
| 2023 | +13.10% | +24.60% |
| 2024 | +4.74% | +14.67% |
The Current Screen
The US screen is available at cetaresearch.com/data-explorer?q=z9gpaUlNfi. Exchange-specific queries for XETRA and other markets can be run on the data explorer at cetaresearch.com.
Limitations
Currency exposure is significant. Returns are calculated in EUR. A non-European investor takes on EUR/USD risk. Post-2022 EUR weakness has been a drag for USD-based investors in European equities.
The portfolio is structurally concentrated in industrials and chemicals. When German manufacturing faces a structural headwind, as it has since 2019 (automotive transition, energy costs), there's no diversification within the strategy's natural universe. The quality filter can't protect against sector-level economic deterioration.
Average portfolio size of 19.5 stocks is smaller than the target of 30. The €500M market cap threshold and quality filters together create a tight screen. The strategy has been capacity-constrained by design, which is a reasonable trade-off but worth understanding.
The 2000 return of +68.80% is real but not repeatable in isolation. It reflects a one-time decoupling event between US tech and German industrials during the dot-com collapse. Excluding 2000, the return profile is more modest. Don't use that single year to set return expectations.
Part of a Series
This post is part of a multi-exchange series on the Price-to-Tangible-Book strategy. The US flagship backtest, including full methodology and global results summary, is at ptbv-strategy-us-backtest.
Part of a Series: Global | US | UK | Sweden | India | China | Canada
Data: Ceta Research (FMP financial data warehouse), 2000-2025. Full methodology: backtests/METHODOLOGY.md


