
Price-to-Sales Below 1 in Sweden: 9.36% CAGR, Steady Risk-Adjusted

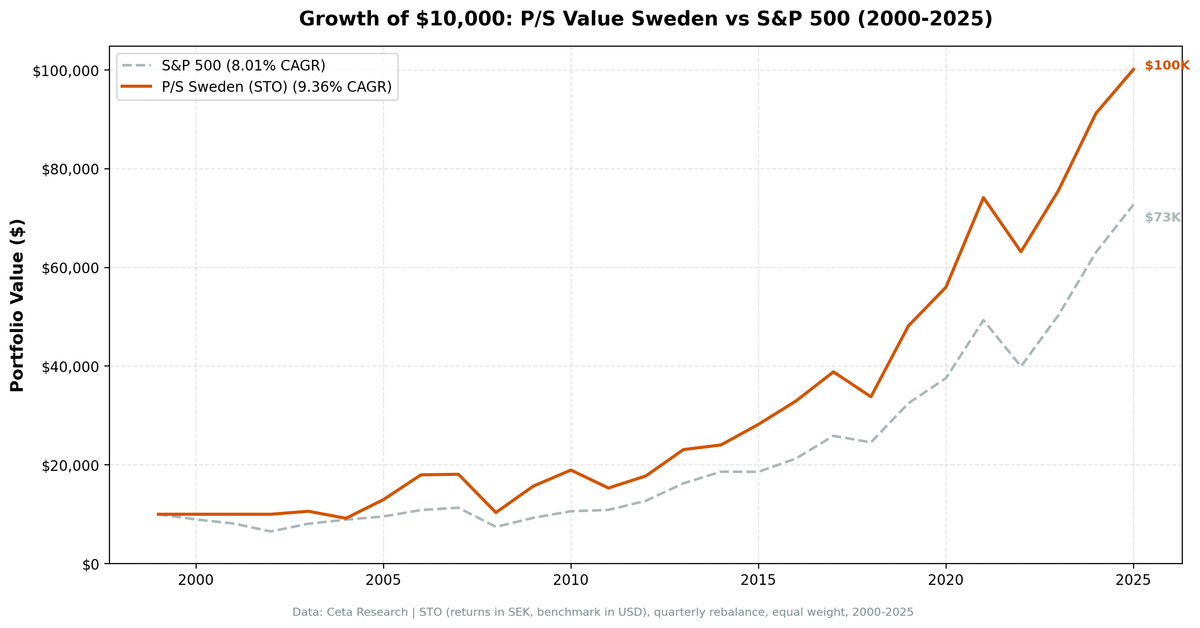
We ran a P/S value screen on the Stockholm Stock Exchange from 2000 to 2025. The strategy requires P/S below 1.0, gross margin above 20%, operating margin above 5%, and ROE above 10%. It returned 9.36% annually vs 8.01% for the S&P 500, with a Sharpe ratio of 0.365, slightly above SPY's 0.354. The portfolio held cash during 2000-2002 when no qualifying stocks existed.
Contents
- Method
- What Is the P/S Screen?
- The Screen
- P/S Value Screen for STO (SQL)
- What We Found
- 22 years invested. Sharpe beats SPY. Drawdown is the risk.
- The 2000-2002 cash period: accidental protection
- Year-by-year returns
- 2003-2004: the slow start after cash
- 2005-2006: two big years
- 2008: the drawdown problem
- 2015: outperforming a flat market
- 2019: the strongest single year
- Backtest Methodology
- Limitations
- Takeaway
- Part of a Series
- References
- Run This Screen Yourself
Method
- Data source: Ceta Research (FMP financial data warehouse)
- Universe: STO (Stockholm Stock Exchange), market cap > SEK 2B
- Period: 2000-2025 (25 years, 100 quarterly periods)
- Rebalancing: Quarterly (January, April, July, October), equal weight, top 30 by lowest P/S
- Benchmark: S&P 500 Total Return (SPY)
- Cash rule: Hold cash if fewer than 10 stocks qualify
Financial data sourced from financial_ratios (FY) for P/S ratio and margins, key_metrics (FY) for ROE and market cap. 45-day lag on all financial statements to prevent look-ahead bias.
What Is the P/S Screen?
Price-to-sales divides a company's market cap by its annual revenue. A ratio below 1.0 means you're paying less than $1 for every $1 of sales the business generates. Kenneth Fisher popularized P/S as a valuation metric in Super Stocks (1984), arguing it was a cleaner signal than P/E because revenue is harder to manipulate than earnings.
The screen doesn't stop at P/S < 1.0. Without quality filters, that criterion fills the portfolio with low-margin distributors and struggling industrials that are cheap for a reason. The quality gates change what qualifies.
Valuation:
| Criterion | Metric | Threshold |
|---|---|---|
| Cheap on sales | Price-to-Sales (FY) | < 1.0 |
Quality Filters:
| Criterion | Metric | Threshold |
|---|---|---|
| Margin quality | Gross Margin | > 20% |
| Operational efficiency | Operating Margin | > 5% |
| Capital returns | Return on Equity | > 10% |
Size:
| Criterion | Metric | Threshold |
|---|---|---|
| Institutional grade | Market Cap | > SEK 2B |
Stocks must pass all four to enter. The top 30 by lowest P/S ratio are selected each quarter, equal weighted.
The Screen
P/S Value Screen for STO (SQL)
SELECT
    f.symbol,
    p.companyName,
    p.exchange,
    p.sector,
    ROUND(f.priceToSalesRatioTTM, 3) AS ps_ratio,
    ROUND(f.grossProfitMarginTTM * 100, 1) AS gross_margin_pct,
    ROUND(f.operatingProfitMarginTTM * 100, 1) AS op_margin_pct,
    ROUND(k.returnOnEquityTTM * 100, 1) AS roe_pct,
    ROUND(k.marketCap / 1e9, 2) AS mktcap_b
FROM financial_ratios_ttm f
JOIN key_metrics_ttm k ON f.symbol = k.symbol
JOIN profile p ON f.symbol = p.symbol
WHERE f.priceToSalesRatioTTM > 0
  AND f.priceToSalesRatioTTM < 1
  AND f.grossProfitMarginTTM > 0.20
  AND f.operatingProfitMarginTTM > 0.05
  AND k.returnOnEquityTTM > 0.10
  AND k.marketCap > 2000000000
  AND p.exchange IN ('STO')
QUALIFY ROW_NUMBER() OVER (PARTITION BY f.symbol ORDER BY f.priceToSalesRatioTTM ASC) = 1
ORDER BY f.priceToSalesRatioTTM ASC
LIMIT 30
Run this query on Ceta Research
What We Found

22 years invested. Sharpe beats SPY. Drawdown is the risk.
| Metric | P/S Screen (STO) | S&P 500 |
|---|---|---|
| CAGR | 9.36% | 8.01% |
| Sharpe Ratio | 0.365 | 0.354 |
| Max Drawdown | -58.31% | -45.53% |
| Avg Stocks per Period (when invested) | 26.0 | - |
| Cash Periods | 13 of 100 | - |
Sweden's result is the most interesting risk-adjusted story in this series. The Sharpe ratio of 0.365 is the only number in the table that clearly beats SPY. The strategy generated more return per unit of risk, not just more raw return. That's a meaningful distinction.
The tradeoff is the max drawdown: -58.31%. That's substantially worse than SPY's -45.53%, and it reflects Sweden's smaller market size and concentrated sector exposure. Individual years can be brutal. The strategy isn't for investors who check their portfolio monthly.
The 13 cash periods are concentrated almost entirely in 2000-2002. Once the screen found qualifying stocks in 2003, it stayed invested.
The 2000-2002 cash period: accidental protection
Sweden's stock market in 2000 was dominated by Ericsson and a cluster of telecom-adjacent companies that had surged on the mobile internet boom. Many were trading at P/S ratios of 5x, 10x, or higher. The quality filters, gross margin above 20% and ROE above 10%, knocked out most of the tech names. What remained was a small pool that didn't hit the threshold of 10 qualifying stocks.
The result: the strategy held cash from 2000 to 2002 while the S&P 500 lost 34.6% over three years. That cash position wasn't a clever tactical call. It was a mechanical consequence of Stockholm's tech-heavy composition at the time. But it worked.
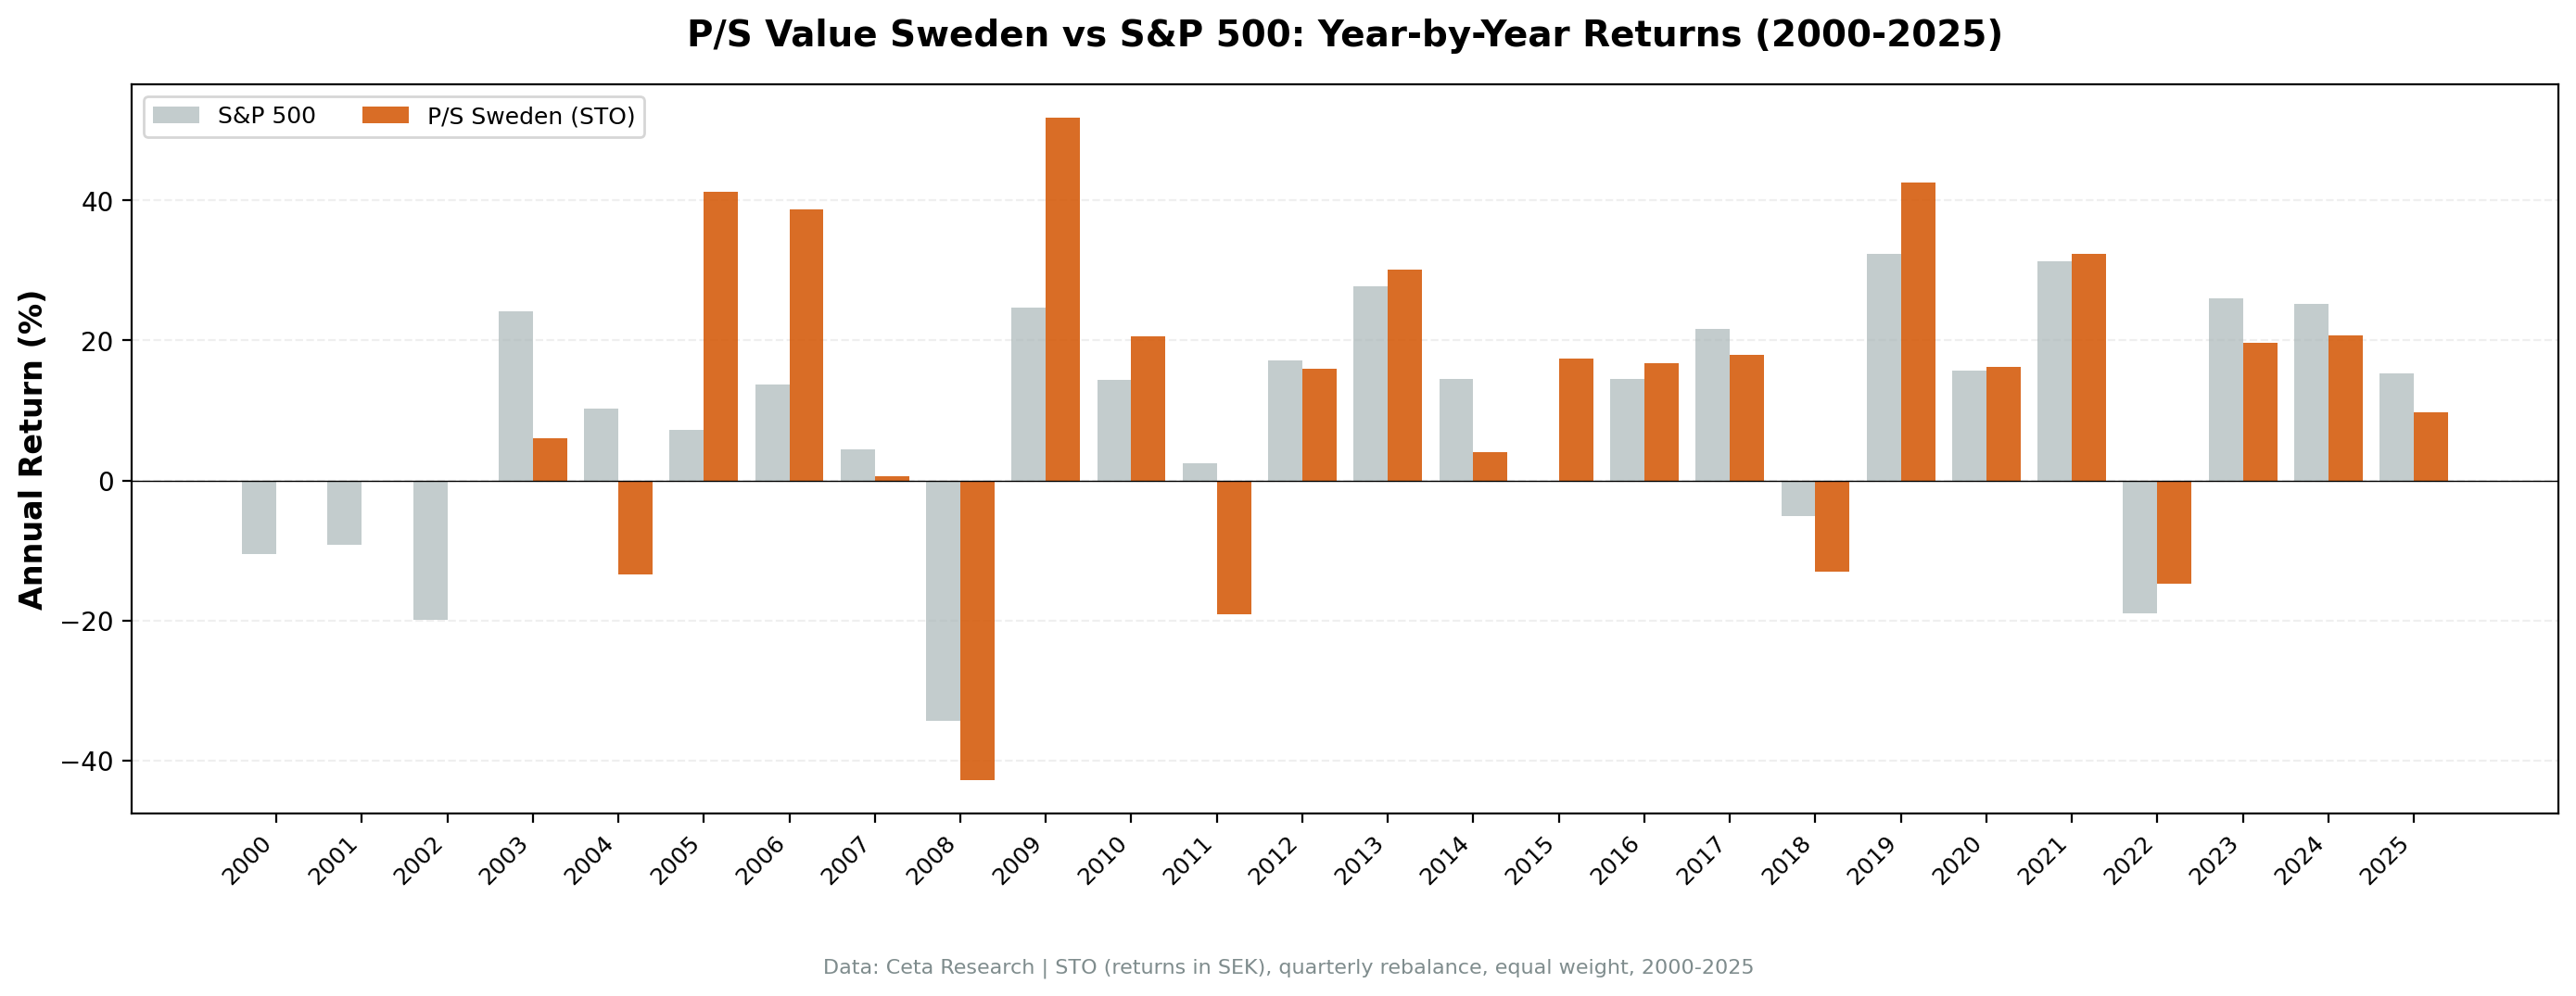
Year-by-year returns
| Year | P/S Screen (STO) | S&P 500 | Excess |
|---|---|---|---|
| 2000 | 0.0% (cash) | -10.50% | +10.50% |
| 2001 | 0.0% (cash) | -9.17% | +9.17% |
| 2002 | 0.0% (cash) | -19.92% | +19.92% |
| 2003 | +6.07% | +24.12% | -18.05% |
| 2004 | -13.48% | +10.24% | -23.72% |
| 2005 | +41.21% | +7.17% | +34.04% |
| 2006 | +38.76% | +13.65% | +25.11% |
| 2007 | +0.66% | +4.40% | -3.74% |
| 2008 | -42.84% | -34.31% | -8.53% |
| 2009 | +51.83% | +24.73% | +27.10% |
| 2010 | +20.64% | +14.31% | +6.33% |
| 2011 | -19.18% | +2.46% | -21.64% |
| 2012 | +15.97% | +17.09% | -1.12% |
| 2013 | +30.05% | +27.77% | +2.28% |
| 2014 | +4.06% | +14.50% | -10.44% |
| 2015 | +17.35% | -0.12% | +17.47% |
| 2016 | +16.78% | +14.45% | +2.33% |
| 2017 | +17.93% | +21.64% | -3.71% |
| 2018 | -12.98% | -5.15% | -7.83% |
| 2019 | +42.50% | +32.31% | +10.19% |
| 2020 | +16.26% | +15.64% | +0.62% |
| 2021 | +32.40% | +31.26% | +1.14% |
| 2022 | -14.79% | -18.99% | +4.20% |
| 2023 | +19.64% | +26.00% | -6.36% |
| 2024 | +20.69% | +25.28% | -4.59% |
| 2025 | +9.75% | +15.34% | -5.59% |
2003-2004: the slow start after cash
The portfolio's first invested period, starting in 2003, wasn't strong. 2003 returned +6.07% while SPY gained +24.12%. Then 2004 dropped -13.48% while the market rose +10.24%.
The gap in 2003 reflects a straightforward timing issue. The screen only found qualifying stocks partway through the year. 2004 is harder to explain. Swedish mid-cap industrials lagged the global recovery that year, which hit the concentrated small portfolio hard.
What followed redeemed it: 2005 at +41.21% and 2006 at +38.76%.
2005-2006: two big years
Back-to-back returns of +41.21% and +38.76% are the strategy's best consecutive run. Sweden's quality industrial mid-caps, defense and engineering companies, specialist manufacturers, had been left behind during the 2003-2004 recovery. When earnings growth caught up to valuations in 2005 and 2006, these stocks moved sharply.
The P/S screen had positioned the portfolio in exactly these companies: operationally solid, trading below 1x sales, with real ROE. That's the thesis working.
2008: the drawdown problem
2008 returned -42.84% vs SPY's -34.31%. That 8.5 percentage point gap contributed heavily to the -58.31% max drawdown. Sweden's smaller market means higher stock-level concentration. In a panic sell-off, concentrated portfolios in smaller markets suffer more.
The strategy has no mechanism to go defensive during systemic crises, other than the cash rule, which only triggers when qualifying stocks drop below 10. In 2008, there were still enough qualifying Swedish stocks to stay fully invested.
2015: outperforming a flat market
2015 was one of Sweden's best relative years: +17.35% when SPY returned -0.12%. The global market was flat to negative that year, partly on China slowdown fears and commodity weakness. Swedish quality industrials, which this screen targets, held up well. The gross margin and operating margin filters had kept out the commodity-exposed names that were selling off.
2019: the strongest single year
2019 returned +42.50%, the highest in the backtest's invested periods. The backdrop was a strong global equity rally as trade war fears eased and rates stayed low. Small and mid-cap quality stocks caught a tailwind, and the Swedish screen was concentrated in exactly those names.
Backtest Methodology
| Parameter | Choice |
|---|---|
| Universe | STO, Market Cap > SEK 2B |
| Signal | P/S < 1.0, Gross Margin > 20%, Op. Margin > 5%, ROE > 10% |
| Portfolio | Top 30 by lowest P/S, equal weight |
| Rebalancing | Quarterly (January, April, July, October) |
| Cash rule | Hold cash if < 10 qualify |
| Benchmark | S&P 500 Total Return (SPY) |
| Period | 2000-2025 (25 years, 100 quarterly periods, 13 in cash) |
| Data | Point-in-time (45-day lag on FY financial statements) |
Limitations
Severe drawdown. -58.31% max drawdown is the central risk. Sweden is a smaller, more concentrated market, and the portfolio's 26-stock average means individual stock blowups matter more. Investors need to model this explicitly.
High year-to-year volatility. Returns swing from +42.50% to -42.84%. The Sharpe ratio is better than SPY only because average returns are high enough to compensate. In any given year, the range of outcomes is wide.
Currency effects. Returns are in SEK. Non-Swedish investors carry an additional layer of SEK/currency risk not captured in these numbers.
Market concentration. The STO universe is smaller than NYSE or LSE. In some quarters, the screen holds fewer than 30 stocks with no sector diversification applied. Single-position and single-sector risk is real.
Early cash periods. 13 of 100 periods were in cash (all in 2000-2002). The CAGR of 9.36% is calculated over the full 25-year period including those years. An investor who entered in 2003 would have a different experience.
Survivorship bias. Exchange membership uses current profiles, not historical. Delistings aren't tracked.
Transaction costs not included. Quarterly rebalancing of ~26 stocks generates meaningful turnover. Cost drag at 0.2-0.5% per transaction one-way is approximately 0.4-1.0% annually.
Takeaway
The Sweden P/S screen delivers 9.36% CAGR and a Sharpe ratio of 0.365, both above the S&P 500 over 25 years. The better Sharpe is the headline. Most markets in this series produce similar or lower Sharpe ratios despite generating alpha. Sweden's quality industrial mid-caps turn out to be a good hunting ground for this screen.
The early cash periods in 2000-2002 were accidental protection against the dot-com bust. When the portfolio started investing in 2003, it went through a rough 2004 before delivering back-to-back 40% years in 2005-2006. 2019's +42.5% and 2021's +32.4% show the strategy still had legs two decades in.
The cost is the drawdown: -58.31% is the worst in this series. Sweden is a smaller, more concentrated market, and the portfolio reflects that. The Sharpe ratio looks good in retrospect. Sitting through -42.84% in 2008 or -19.18% in 2011 is a different experience in real time.
For investors who can hold through those years, the 25-year math makes a case.
Part of a Series
This analysis is part of our global P/S value screen comparison. We tested the same screen across multiple exchanges worldwide: - P/S Value Screen on US Stocks (NYSE + NASDAQ + AMEX) - 11.14% CAGR, strongest raw return - P/S Value Screen on Indian Stocks (BSE + NSE) - P/S Value Screen on German Stocks (XETRA) - P/S Value Screen on Canadian Stocks (TSX) - P/S Value Screen on South African Stocks (JNB) - P/S Value Screen on Japanese Stocks (JPX) - P/S Value Screen: Global Exchange Comparison
References
- Fisher, K. (1984). Super Stocks. Dow Jones-Irwin.
- Barbee, W., Mukherji, S. & Raines, G. (1996). "Do Sales-Price and Debt-Equity Explain Stock Returns Better than Book-Market and Firm Size?" Financial Analysts Journal, 52(2), 56-60.
- Gray, W. & Vogel, J. (2012). "Analyzing Valuation Measures: A Performance Horse-Race over the Past 40 Years." Journal of Portfolio Management, 39(1), 112-121.
- Novy-Marx, R. (2013). "The Other Side of Value: The Gross Profitability Premium." Journal of Financial Economics, 108(1), 1-28.
Run This Screen Yourself
Via web UI: Run the P/S value screen on Ceta Research. The query is pre-loaded. Hit "Run" and see what qualifies today.
Via Python:
import requests, time

API_KEY = "your_api_key"  # get one at cetaresearch.com
BASE = "https://tradingstudio.finance/api/v1"

resp = requests.post(f"{BASE}/data-explorer/execute", headers={
    "X-API-Key": API_KEY, "Content-Type": "application/json"
}, json={
    "query": """
        SELECT f.symbol, p.companyName, p.sector,
            ROUND(f.priceToSalesRatioTTM, 3) AS ps_ratio,
            ROUND(f.grossProfitMarginTTM * 100, 1) AS gross_margin_pct,
            ROUND(f.operatingProfitMarginTTM * 100, 1) AS op_margin_pct,
            ROUND(k.returnOnEquityTTM * 100, 1) AS roe_pct,
            ROUND(k.marketCap / 1e9, 2) AS mktcap_b
        FROM financial_ratios_ttm f
        JOIN key_metrics_ttm k ON f.symbol = k.symbol
        JOIN profile p ON f.symbol = p.symbol
        WHERE f.priceToSalesRatioTTM > 0
          AND f.priceToSalesRatioTTM < 1
          AND f.grossProfitMarginTTM > 0.20
          AND f.operatingProfitMarginTTM > 0.05
          AND k.returnOnEquityTTM > 0.10
          AND k.marketCap > 2000000000
          AND p.exchange IN ('STO')
        QUALIFY ROW_NUMBER() OVER (PARTITION BY f.symbol ORDER BY f.priceToSalesRatioTTM ASC) = 1
        ORDER BY f.priceToSalesRatioTTM ASC
        LIMIT 30
    """,
    "options": {"format": "json", "limit": 100}
})
task_id = resp.json()["taskId"]

while True:
    result = requests.get(f"{BASE}/tasks/data-query/{task_id}",
                          headers={"X-API-Key": API_KEY}).json()
    if result["status"] in ("completed", "failed"):
        break
    time.sleep(2)

for r in result["result"]["rows"][:10]:
    print(f"{r['symbol']:8s} P/S={r['ps_ratio']:.3f} GM={r['gross_margin_pct']:.1f}% ROE={r['roe_pct']:.1f}%")
Get your API key at cetaresearch.com. The full backtest code (Python + DuckDB) is on GitHub.
Part of a Series: Global | US | Southafrica Stocks | Japan | India | Germany | Canada
Data: Ceta Research, FMP financial data warehouse. Universe: STO (Stockholm). Returns in SEK. Quarterly rebalance, equal weight, 2003-2025 invested.


