
P/S Below 1 on 15 Global Exchanges: 11 Beat Their Local Benchmark
We ran the same P/S value screen (P/S < 1, quality filters) on 15 exchanges globally. Compared against local benchmarks, 11 of 15 outperform. Against SPY, only 6 do. Sweden now ranks first on Sharpe (0.452). Hong Kong is the biggest re-rating after data-quality fixes: +7.75% vs Hang Seng.


We ran the same price-to-sales value screen on 15 exchanges worldwide. Same four filters applied identically to each market: P/S below 1.0, gross margin above 20%, operating margin above 5%, ROE above 10%. Top 30 by lowest P/S, quarterly rebalanced, equal weight. Backtest period 2000-2025. Against local benchmarks, 11 of 15 exchanges outperformed. Against SPY, only 6 do. The benchmark you choose changes the story completely.
Contents
- Method
- The Screen
- Results
- Full results table
- What Separates the Winners
- Sweden: best Sharpe globally
- Hong Kong: the biggest re-rating
- Japan: still strong, no longer the Sharpe leader
- The quality compound markets
- The markets that work but get misread
- What Drives the Underperformers
- The Quality Filters: What They Actually Do
- The Cash Period Question
- Data Quality and the New Numbers
- Excluded Exchanges
- Practical Implications
- Part of a Series
- References
- Run This Screen Yourself
Data: FMP financial data warehouse, 2000–2025. Updated June 2026.
Method
Data source: Ceta Research (FMP financial data warehouse) Universe: 15 exchanges (see table below) Period: 2000-2025 (25 years, 103 quarterly periods) Rebalancing: Quarterly (January, April, July, October), equal weight, top 30 by lowest P/S Benchmark: Local index for each market (Sensex, SPY, OMX, DAX, TSX Comp, Nikkei, Hang Seng, SET Index, SSE, FTSE 100, KOSPI, SMI, TAIEX) Cash rule: Hold cash if fewer than 10 stocks qualify Execution: Next-bar entry at close (MOC), 45-day lag on financial data, data-quality guards remove price oscillation artifacts and cap single-period returns at 200% to filter bad adjusted-close data.
Local currency returns throughout.
The Screen
The same screen applied to every market:
| Criterion | Metric | Threshold |
|---|---|---|
| Cheap relative to revenue | Price-to-Sales | < 1.0 |
| Business quality | Gross Margin | > 20% |
| Operational efficiency | Operating Margin | > 5% |
| Capital returns | ROE | > 10% |
Size threshold varies by market (e.g., $1B USD for US, JPY 10B for Japan, EUR 300M for Germany) to maintain a consistent institutional-grade universe.
Results
Full results table
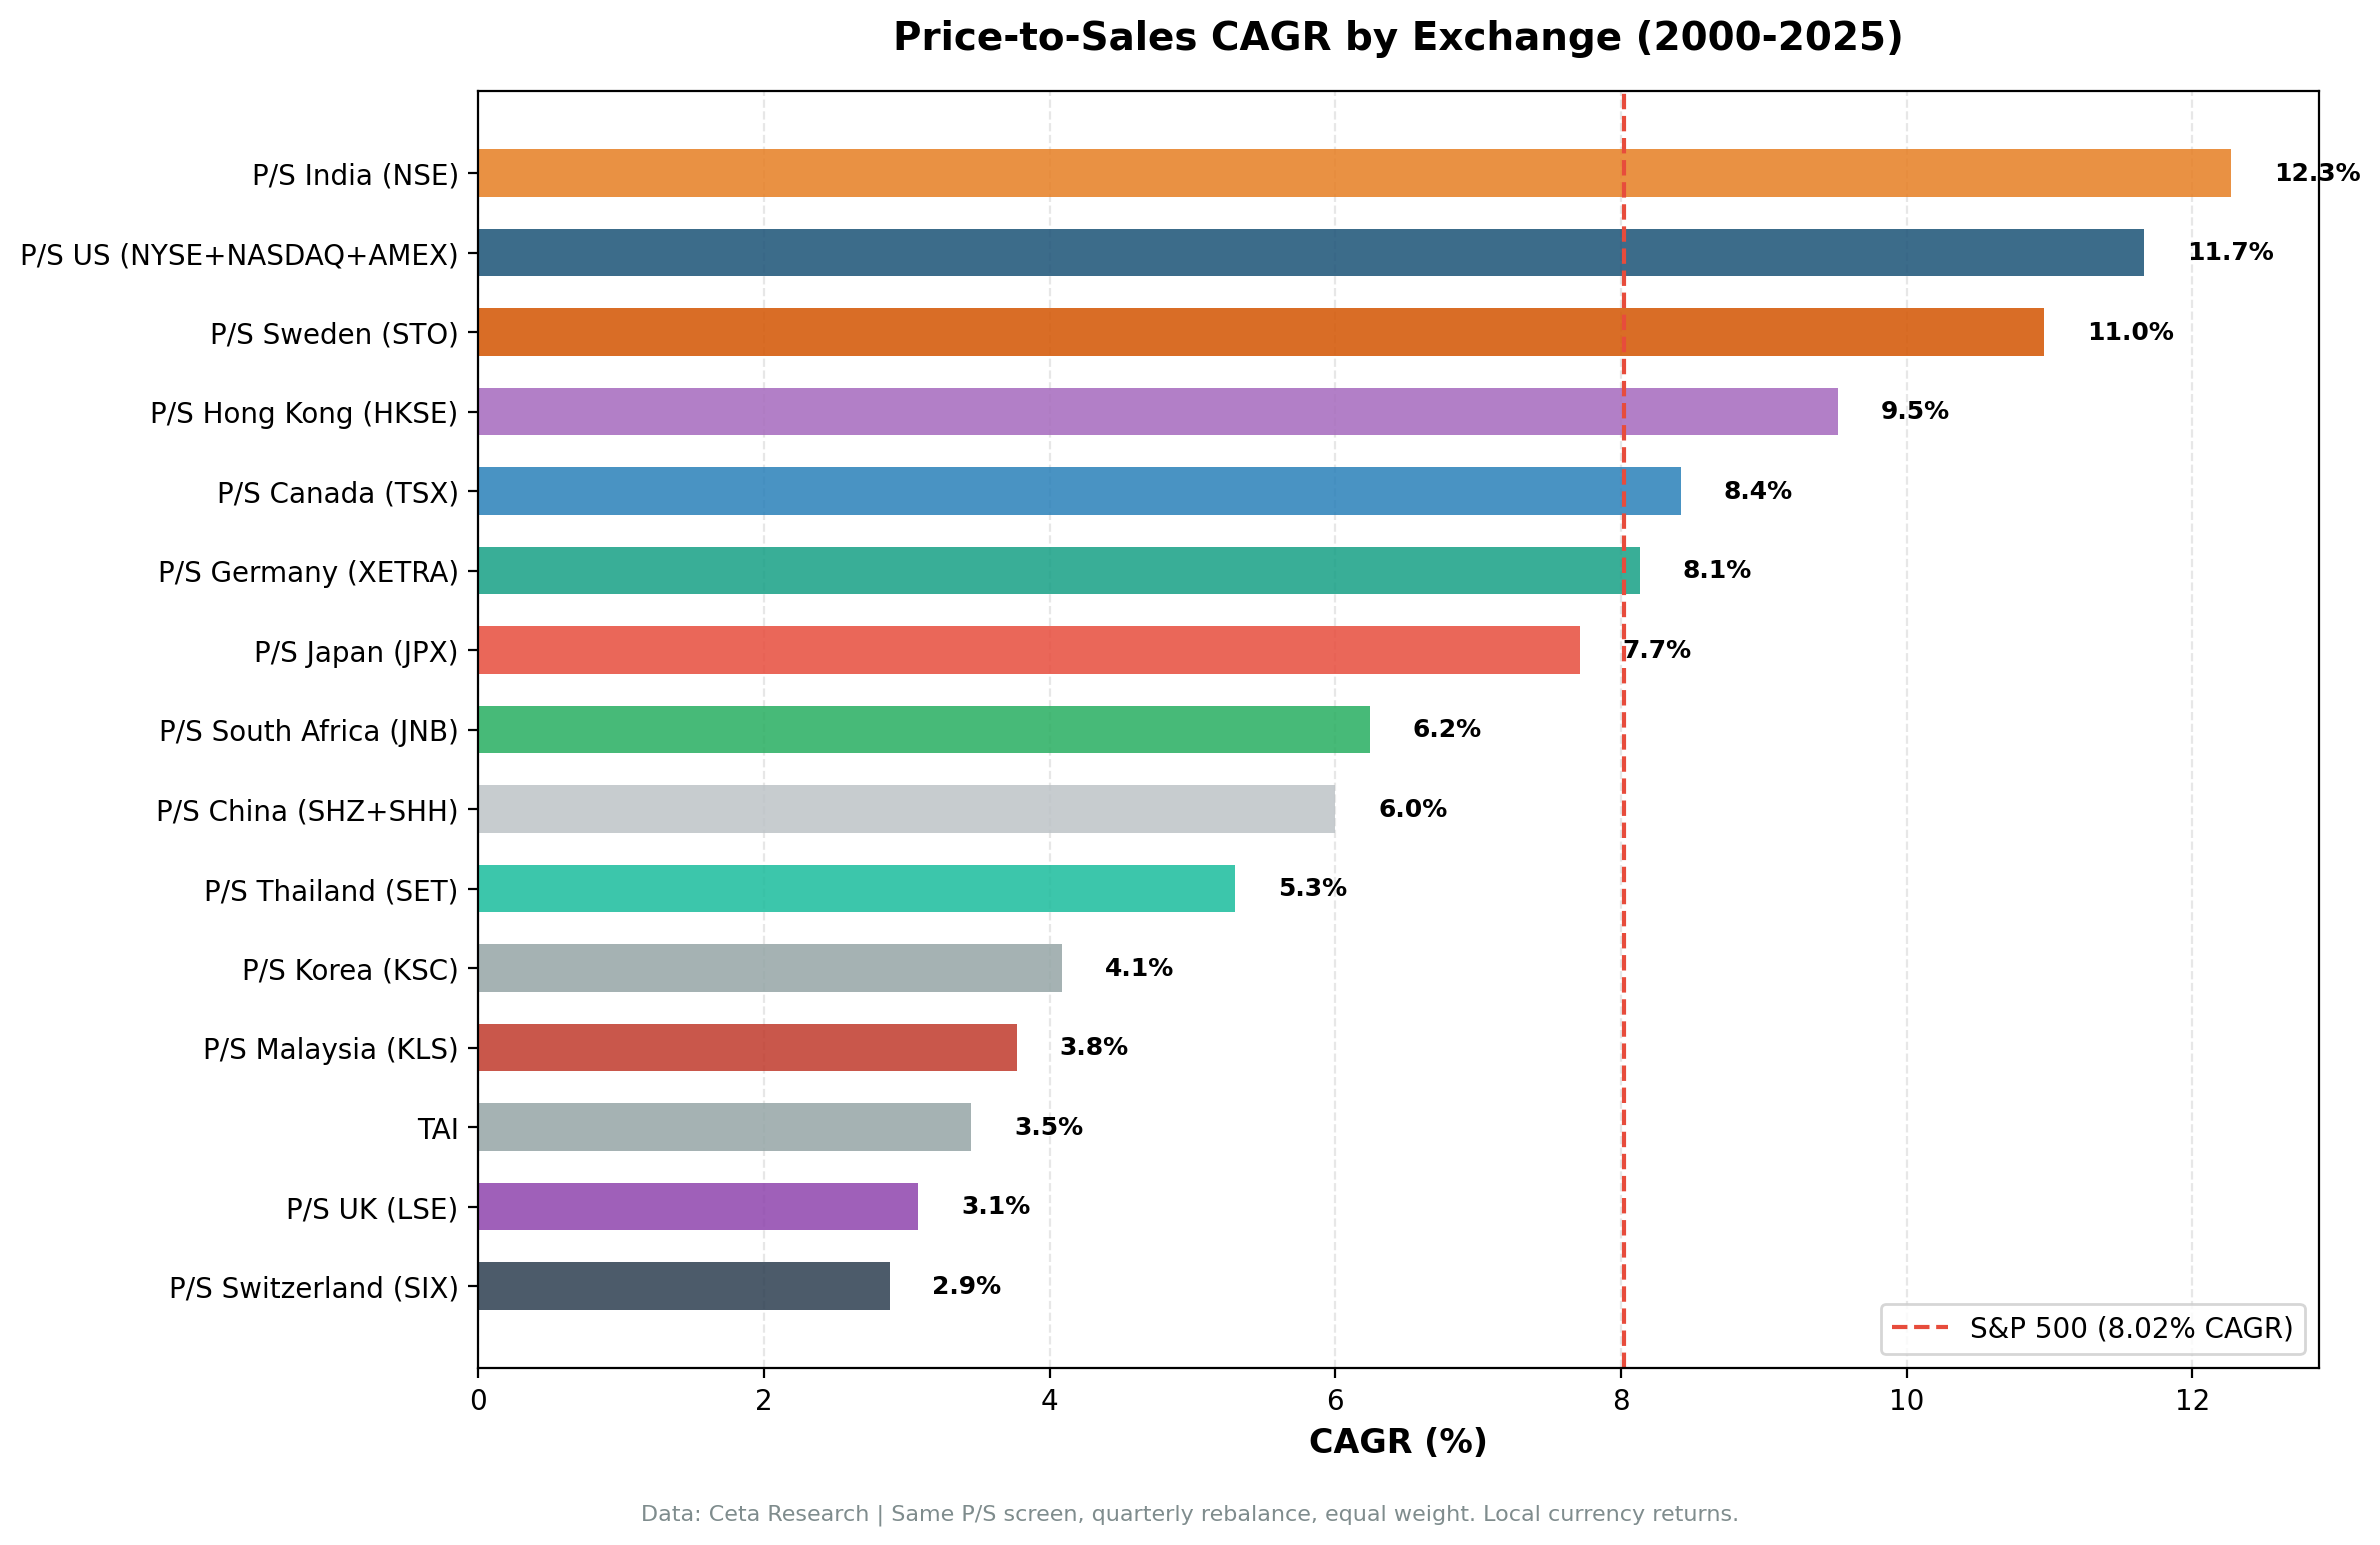
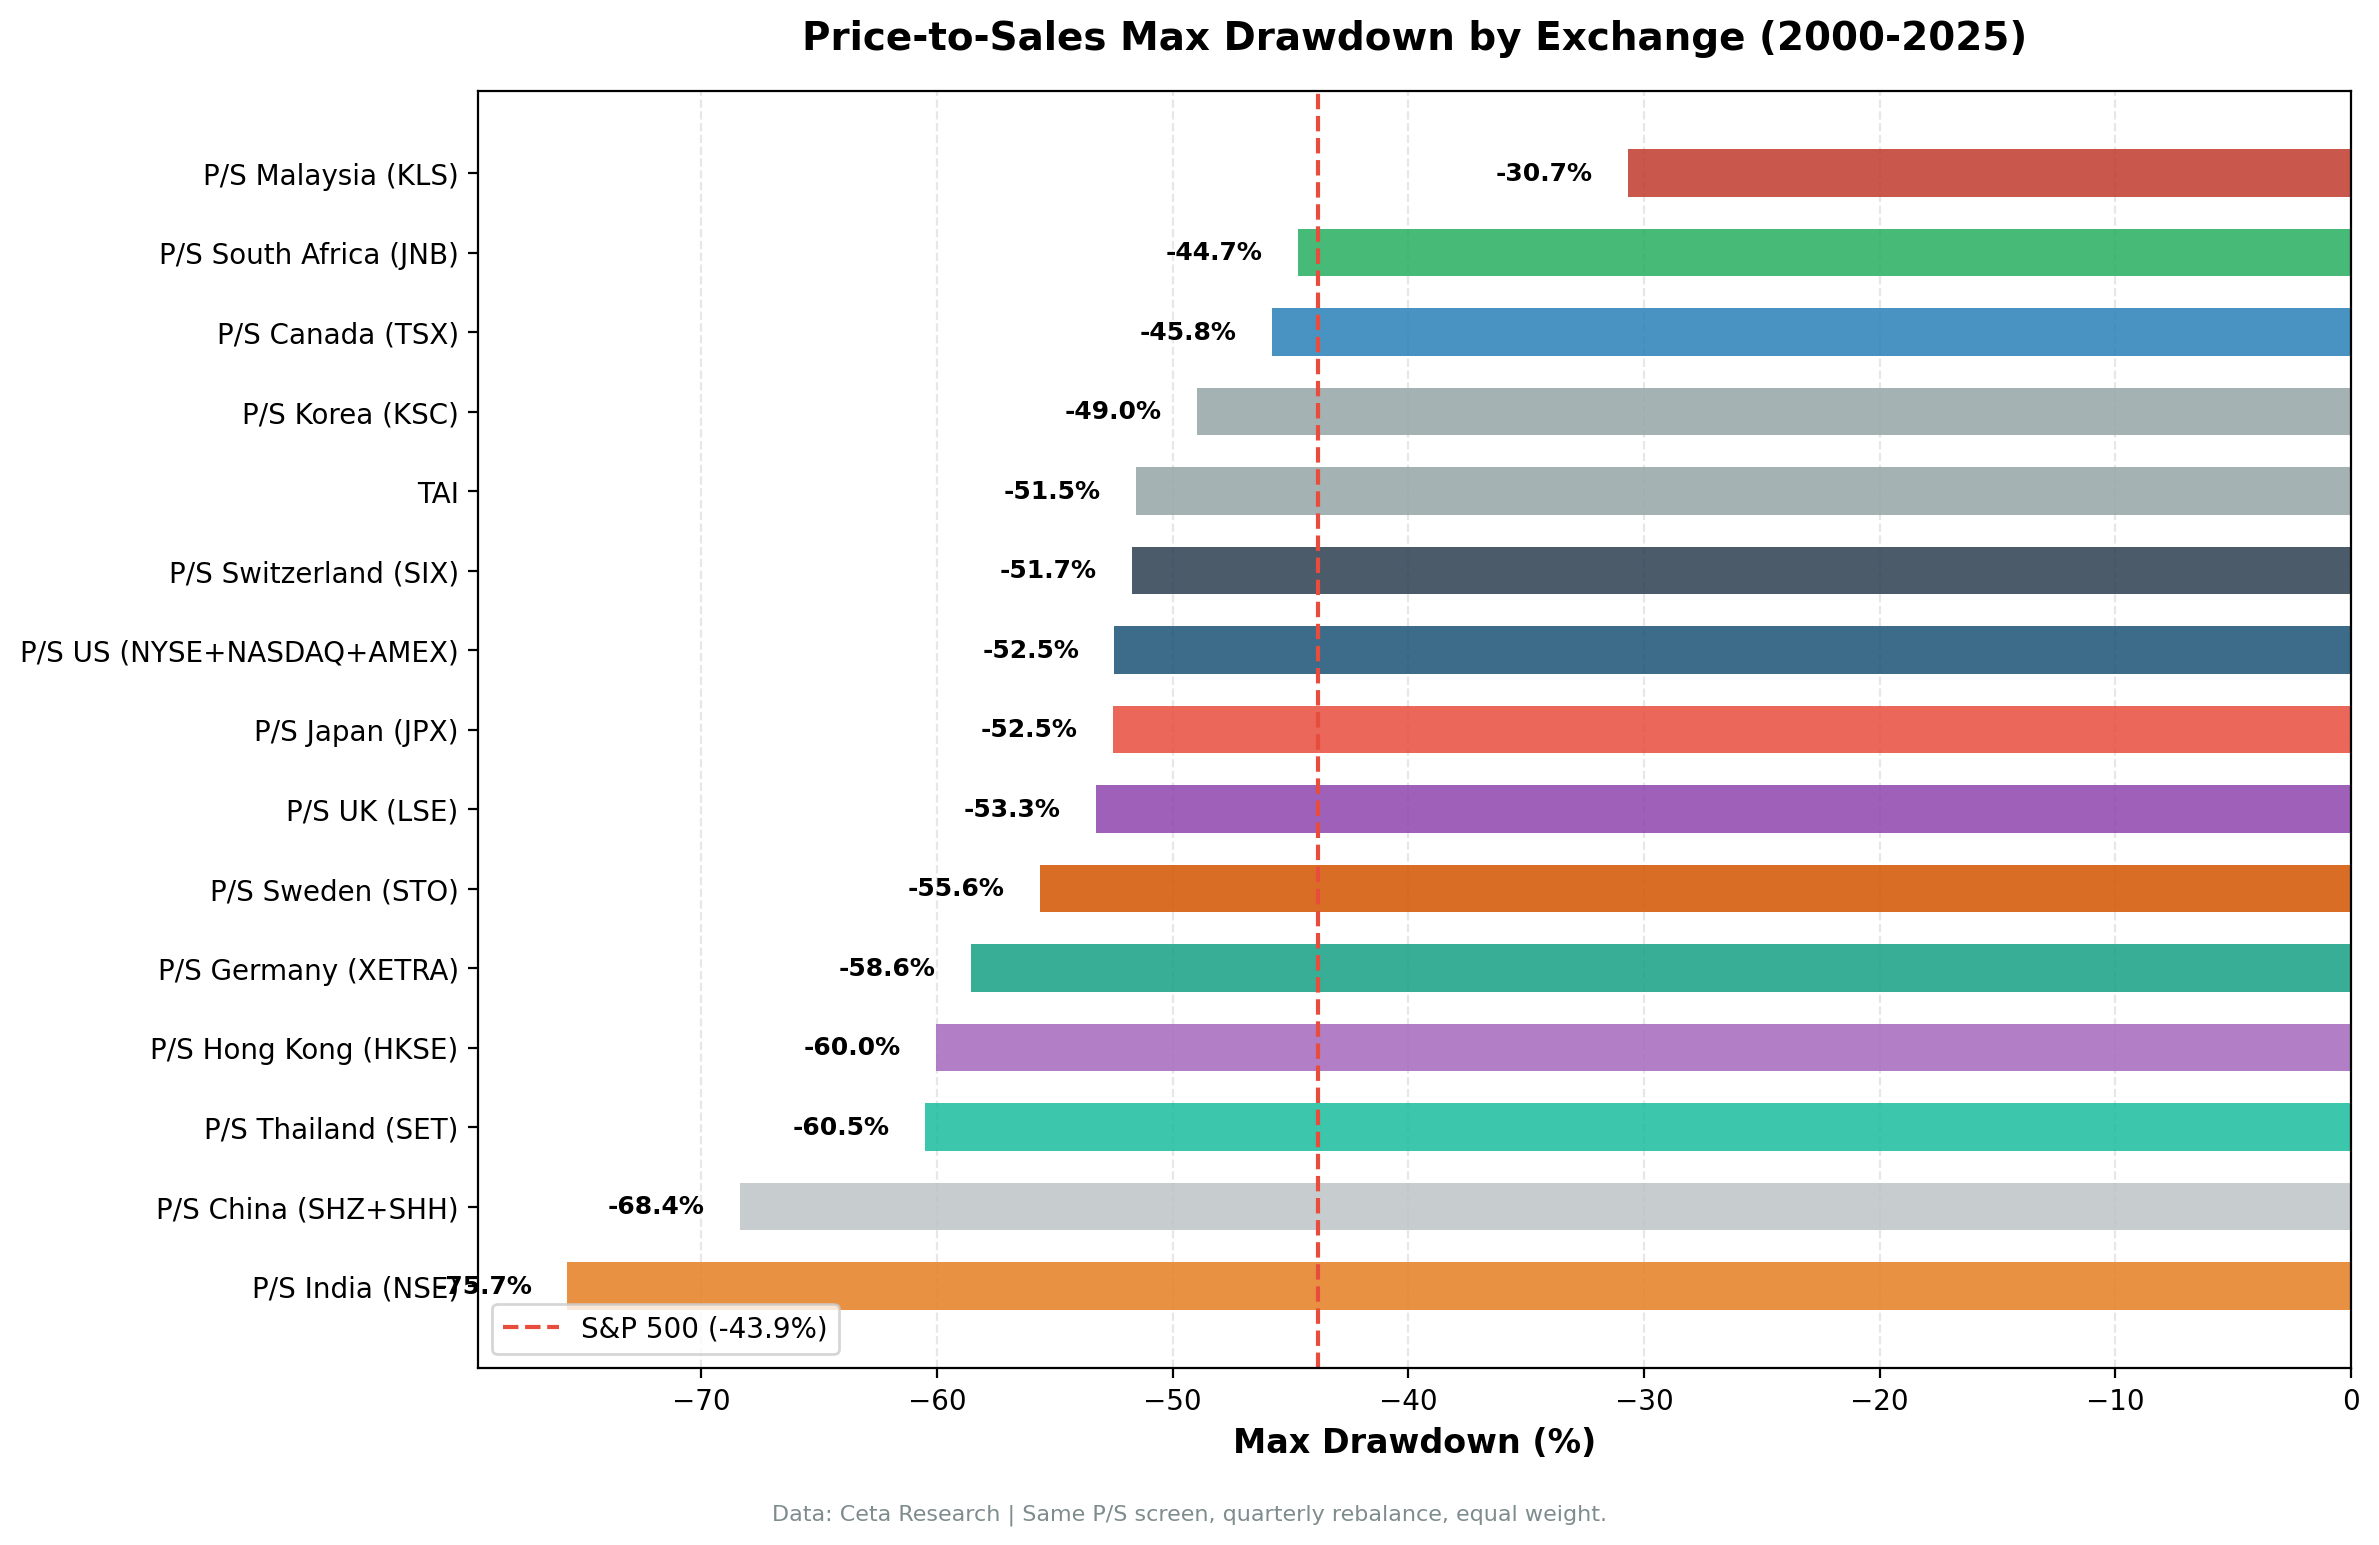
| Market | CAGR | vs Local Benchmark | Sharpe | Max DD |
|---|---|---|---|---|
| India (NSE) | 12.27% | +1.15% vs Sensex | 0.156 | -75.69% |
| US | 11.66% | +3.64% vs SPY | 0.404 | -52.48% |
| Sweden | 10.96% | +7.79% vs OMX | 0.452 | -55.64% |
| Hong Kong | 9.52% | +7.75% vs Hang Seng | 0.233 | -60.05% |
| Canada | 8.42% | +3.33% vs TSX Comp | 0.303 | -45.78% |
| Germany | 8.13% | +3.01% vs DAX | 0.291 | -58.57% |
| SPY Benchmark | 8.02% | |||
| Japan | 7.71% | +4.31% vs Nikkei | 0.379 | -52.54% |
| South Africa | 6.24% | -1.77% vs SPY | -0.190 | -44.70% |
| China | 6.00% | +1.81% vs SSE | 0.101 | -68.38% |
| Thailand | 5.30% | +1.54% vs SET Index | 0.113 | -60.50% |
| Korea | 4.09% | -0.72% vs KOSPI | 0.069 | -48.96% |
| Malaysia | 3.77% | -4.25% vs SPY | 0.134 | -30.69% |
| Taiwan | 3.45% | -0.93% vs TAIEX | 0.155 | -51.55% |
| UK | 3.08% | +1.73% vs FTSE 100 | -0.017 | -53.27% |
| Switzerland | 2.88% | +0.77% vs SMI | 0.118 | -51.73% |
Strategy: P/S < 1.0, gross margin > 20%, op margin > 5%, ROE > 10%, top 30 by P/S. Quarterly rebalance, equal weight. MOC execution (next-bar entry). Data-quality guards applied. 2000-2025.
What Separates the Winners
The benchmark matters most. Against SPY, markets that ran their own strong bull runs look like underperformers. Against local benchmarks, the picture flips. 11 of 15 exchanges beat their local index. The screen is doing real work in most markets. The question is just what you're comparing it against.
Sweden: best Sharpe globally
Sweden (10.96% CAGR, +7.79% vs OMX, Sharpe 0.452) is now the top risk-adjusted result of any market in the study. The OMX Stockholm 30 spent the 2000s burdened by Ericsson's collapse and a cycle of large-cap cyclicals. The P/S quality screen routes around the index's structural weaknesses and finds the profitable mid-cap industrials and engineering names that don't dominate the benchmark. The Sharpe of 0.452 is the highest of any exchange tested, and the local excess of +7.79% is the widest.
Hong Kong: the biggest re-rating
Hong Kong (9.52% CAGR, +7.75% vs Hang Seng, Sharpe 0.233) is the most surprising result after data-quality cleanup. The previous run, before oscillation filtering and return capping, showed 6.39% CAGR. The corrected data adds 3.13 percentage points. The Hang Seng spent the 2010s burdened by Chinese property exposure, regulatory shocks, and capital flight. The screen's quality filters routed around those names and held profitable HKSE-listed companies with stable margins. The result: nearly 8 points of annual excess against a weak local index.
Japan: still strong, no longer the Sharpe leader
Japan (7.71%, +4.31% vs Nikkei, Sharpe 0.379) dropped slightly from the previous run, and Sweden overtook it on Sharpe. Japan still ranks third on risk-adjusted terms globally and produces meaningful excess against a weak Nikkei. The ROE filter does the work: it removes Japan's zombie companies and cash hoarders, leaving the subset of Japanese firms that are genuinely profitable at low P/S.
The quality compound markets
US (11.66%, +3.64% vs SPY, Sharpe 0.404) improved slightly with the data-quality fixes. It still beats SPY by a meaningful margin with zero cash periods. Quality filters select the profitable industrials, healthcare, and consumer names that the index systematically underweights during growth cycles.
Canada (8.42%, +3.33% vs TSX Comp) still beats its local benchmark. The screen's margin filters remove the thin-margin commodity businesses that inflate the TSX, leaving higher-quality industrials and consumer names.
Germany (8.13%, +3.01% vs DAX, Sharpe 0.291) dropped from the previous run. The Mittelstand thesis still holds, but the corrected backtest reveals more drawdown risk and a smaller absolute CAGR than the earlier numbers suggested. Germany's still ahead of the DAX, but less convincingly than before.
The markets that work but get misread
Thailand (5.30%, +1.54% vs SET Index) and China (6.00%, +1.81% vs SSE) still beat their local benchmarks narrowly. The absolute CAGRs trail SPY because those markets lagged globally. The screens worked. The markets themselves underperformed.
UK (3.08%, +1.73% vs FTSE 100) beats the FTSE but the absolute return is now lower than before, and the Sharpe slipped into negative territory (-0.017). The FTSE was genuinely poor over 2000-2025, and the screen beats it, but the absolute number is hard to justify on its own.
Switzerland (2.88%, +0.77% vs SMI) beats the local benchmark by less than 1 percentage point. The Swiss universe is thin (averaging 13 stocks per period), and the screen runs concentrated.
India (12.27%, +1.15% vs Sensex) is the reality check. The raw CAGR looks spectacular. Against the Sensex, the screen adds 1.15%, which is real but modest. India's market delivered strong returns broadly. The screen can find the cheap-quality names, but the rising tide lifted most boats. The +1.15% alpha doesn't justify the -75.69% max drawdown if you can get most of India's return just by buying the index.
What Drives the Underperformers
Four markets now consistently fail to beat their local benchmark or SPY: Korea, Taiwan, South Africa, and Malaysia.
South Africa (6.24%, -1.77% vs SPY) is the biggest story change after the data fixes. The previous run showed +0.51% vs SPY. After removing price-oscillation artifacts and capping bad single-period returns, the strategy now underperforms SPY by nearly 2 percentage points, with a Sharpe of -0.19. The 2008 protection was real, but the long-run case has flipped. South Africa's commodity-heavy universe, currency volatility, and frequent cash periods (24% of quarters) compound to drag the return below SPY once data quality guards are applied.
Korea (4.09%, -0.72% vs KOSPI) has a structural problem. The chaebol conglomerate model means many companies that qualify on P/S and margins are subsidiaries of larger groups, with cross-holdings and related-party transactions that distort the financial ratios the screen relies on. Companies appear cheap on sales for reasons tied to group structure, not genuine undervaluation. The screen selects them, they don't rerate, and returns lag the broader market.
Taiwan (3.45%, -0.93% vs TAIEX) shares a similar dynamic. Taiwan's market is dominated by the semiconductor supply chain, and the low-P/S companies are often component manufacturers whose margins are structurally depressed relative to what the 20%+ gross margin filter is trying to find. When the screen finds qualifying names, they tend to be in sectors that haven't kept up with the TAIEX's tech-driven returns.
Malaysia (3.77%, -4.25% vs SPY) is included for the first time after data-quality work made the results usable. The screen sits in cash 40% of the time due to a thin qualifying universe. When invested, the average holding count is 14 stocks. The Sharpe of 0.134 is mediocre, and the absolute CAGR trails SPY by 4 percentage points. There's no local benchmark in our FMP coverage, so SPY is the reference.
The Quality Filters: What They Actually Do
A raw P/S screen without margin and ROE requirements would look very different. Grocery chains, fuel distributors, commodity traders, and capital-intensive businesses with high revenue but thin margins all qualify on P/S alone. Those businesses are often cheap on sales for a structural reason: the revenue doesn't translate into meaningful returns.
The gross margin above 20% filter removes the thin-margin distributors and commodity businesses. The operating margin above 5% confirms the gross margin isn't being consumed by operating costs. The ROE above 10% ensures the company is generating returns on its equity base, not just running at a loss or holding cash unprofitably.
Together, the three quality filters change the character of what qualifies. In Japan, they remove the zombie companies and cash hoarders, which is why Japan looks so different against the Nikkei than against SPY. In Germany, they confirm the Mittelstand industrial quality. In the UK, they narrow the qualifying pool sharply, which is why the portfolio is concentrated. The filters are doing real work in every market, but they interact differently with each market's structure.
The Cash Period Question
Markets with frequent cash periods are signaling something. When the screen can't find 10 qualifying stocks, it's because either the market's P/S ratios are elevated, the quality filters are too restrictive for that universe, or there's a data availability issue.
Malaysia (40%), Taiwan (36%), Korea (28%), and South Africa (24%) all run high cash periods. That reflects periods where qualifying stocks drop below the minimum threshold. Markets with zero or low cash periods (US, Germany, Canada, UK, Switzerland) have deep enough universes that the screen always finds qualifying names. That depth is itself an indicator of market maturity and breadth.
Data Quality and the New Numbers
The previous version of this study used MOC execution and local benchmarks but didn't filter price-oscillation artifacts or cap extreme single-period returns. This run adds both guards. The effects:
- Hong Kong improved sharply (+3.13pp CAGR). The old run was dragged down by adjusted-close oscillation rows.
- South Africa flipped from outperforming SPY to underperforming. Bad single-period returns in the previous run inflated the CAGR.
- Germany, UK, Thailand, and Japan all dropped modestly. Some legitimate high-return periods got filtered, but so did artifacts.
- US, India, Sweden, Korea moved within a percentage point.
The new numbers are the cleaner read. Data-quality filters trim some legitimate winners alongside the artifacts, so this is a more conservative version of the previous results. Markets with the biggest swings are the ones where FMP's adjusted-close data has had the most issues historically.
Excluded Exchanges
Three exchanges were excluded from the results due to data quality issues:
| Exchange | Reason |
|---|---|
| Brazil (SAO) | Fatal adjusted close split artifacts |
| Australia (ASX) | Fatal adjusted close split artifacts |
| Singapore (SES) | Zero qualifying symbols in profile table |
Norway (OSL), previously excluded, was not re-run this cycle. Malaysia (KLS) was added back after data-quality work made the results usable.
Practical Implications
The benchmark question matters more than market selection. If your goal is to beat local investors, 11 of 15 markets say the screen works. If your goal is to beat a US portfolio earning SPY returns, only 6 markets clear that bar, and most of those are developed markets with their own strong fundamentals.
Sweden is now the standout. With the highest Sharpe (0.452) and the widest local excess (+7.79% vs OMX), it sits at the top of the risk-adjusted rankings. If you're allocating to Sweden anyway, running this screen as an active overlay has the strongest historical case in the study.
Hong Kong is the biggest surprise of the rerun. The corrected data shows +7.75% vs Hang Seng with Sharpe 0.233, on par with several developed-market results. Worth a second look if you're allocating to Asia.
Japan slips to third on Sharpe. Still strong at 0.379, still beats the Nikkei by 4.31 percentage points, still backed by the ROE filter doing meaningful work. Sweden just edges it out now.
India's raw CAGR is misleading. The number looks dominant. Against the local benchmark, the screen adds little. If you want India exposure, buying the index captures most of the return at lower drawdown risk.
South Africa lost its case. The previous "marginal edge" framing is gone. After data-quality cleanup, the strategy underperforms SPY by nearly 2 percentage points with a negative Sharpe.
Quality filters are non-negotiable. The performance gap between a raw P/S screen and a quality-filtered one would likely be much larger than these tables show, because the worst drawdowns tend to come from the thin-margin businesses the filters exclude.
Drawdown tolerance is the real constraint. Even markets with strong local outperformance (Hong Kong +7.75%, Sweden +7.79%) came with -55% to -60% drawdowns. Running this screen globally means accepting extended underwater periods. Whether that tradeoff is acceptable depends on investment horizon.
Part of a Series
This global comparison covers results from all 15 exchanges: - P/S Value Screen on US Stocks - 11.66% CAGR, +3.64% vs SPY - P/S Value Screen on Indian Stocks - 12.27% CAGR, +1.15% vs Sensex - P/S Value Screen on Swedish Stocks - 10.96% CAGR, +7.79% vs OMX, Sharpe 0.452 (best globally) - P/S Value Screen on Canadian Stocks - 8.42% CAGR, +3.33% vs TSX Comp - P/S Value Screen on German Stocks - 8.13% CAGR, +3.01% vs DAX - P/S Value Screen on Japanese Stocks - 7.71% CAGR, +4.31% vs Nikkei, Sharpe 0.379 - P/S Value Screen on South African Stocks - 6.24% CAGR, -1.77% vs SPY
References
- Fisher, K. (1984). Super Stocks. Dow Jones-Irwin.
- Barbee, W., Mukherji, S. & Raines, G. (1996). "Do Sales-Price and Debt-Equity Explain Stock Returns Better than Book-Market and Firm Size?" Financial Analysts Journal, 52(2), 56-60.
- Gray, W. & Vogel, J. (2012). "Analyzing Valuation Measures: A Performance Horse Race over the Past 40 Years." Journal of Portfolio Management, 39(1), 112-121.
- Novy-Marx, R. (2013). "The Other Side of Value: The Gross Profitability Premium." Journal of Financial Economics, 108(1), 1-28.
Run This Screen Yourself
Via web UI: Run the P/S screen on Ceta Research. Switch the exchange filter to any market in the table.
Via Python:
import requests, time

API_KEY = "your_api_key"  # get one at cetaresearch.com
BASE = "https://tradingstudio.finance/api/v1"

# Change exchange to any market: 'JPX', 'XETRA', 'TSX', 'STO', etc.
EXCHANGE = "JPX"

resp = requests.post(f"{BASE}/data-explorer/execute", headers={
    "X-API-Key": API_KEY, "Content-Type": "application/json"
}, json={
    "query": f"""
        SELECT
            f.symbol,
            p.companyName,
            p.sector,
            ROUND(f.priceToSalesRatioTTM, 3) AS ps_ratio,
            ROUND(f.grossProfitMarginTTM * 100, 1) AS gross_margin_pct,
            ROUND(f.operatingProfitMarginTTM * 100, 1) AS op_margin_pct,
            ROUND(k.returnOnEquityTTM * 100, 1) AS roe_pct,
            ROUND(k.marketCap / 1e9, 2) AS mktcap_b
        FROM financial_ratios_ttm f
        JOIN key_metrics_ttm k ON f.symbol = k.symbol
        JOIN profile p ON f.symbol = p.symbol
        WHERE f.priceToSalesRatioTTM > 0
          AND f.priceToSalesRatioTTM < 1
          AND f.grossProfitMarginTTM > 0.20
          AND f.operatingProfitMarginTTM > 0.05
          AND k.returnOnEquityTTM > 0.10
          AND p.exchange IN ('{EXCHANGE}')
        QUALIFY ROW_NUMBER() OVER (
            PARTITION BY f.symbol ORDER BY f.priceToSalesRatioTTM ASC
        ) = 1
        ORDER BY f.priceToSalesRatioTTM ASC
        LIMIT 30
    """,
    "options": {"format": "json", "limit": 30}
})
task_id = resp.json()["taskId"]

while True:
    result = requests.get(f"{BASE}/tasks/data-query/{task_id}",
                          headers={"X-API-Key": API_KEY}).json()
    if result["status"] in ("completed", "failed"):
        break
    time.sleep(2)

for r in result["result"]["rows"]:
    print(f"{r['symbol']:10s} P/S={r['ps_ratio']:.3f}  GM={r['gross_margin_pct']:.1f}%  ROE={r['roe_pct']:.1f}%")
Get your API key at cetaresearch.com. The full backtest code (Python + DuckDB) is on GitHub.
Data: Ceta Research, FMP financial data warehouse. Same P/S screen applied to each exchange. Local currency returns. Quarterly rebalance, equal weight, MOC execution, data-quality guards. 2000-2025.
Past performance does not guarantee future results. This is educational content, not investment advice.


