
Price-to-Sales Below 1 in South Africa: 6.24% CAGR, Underperforms SPY by 1.77%

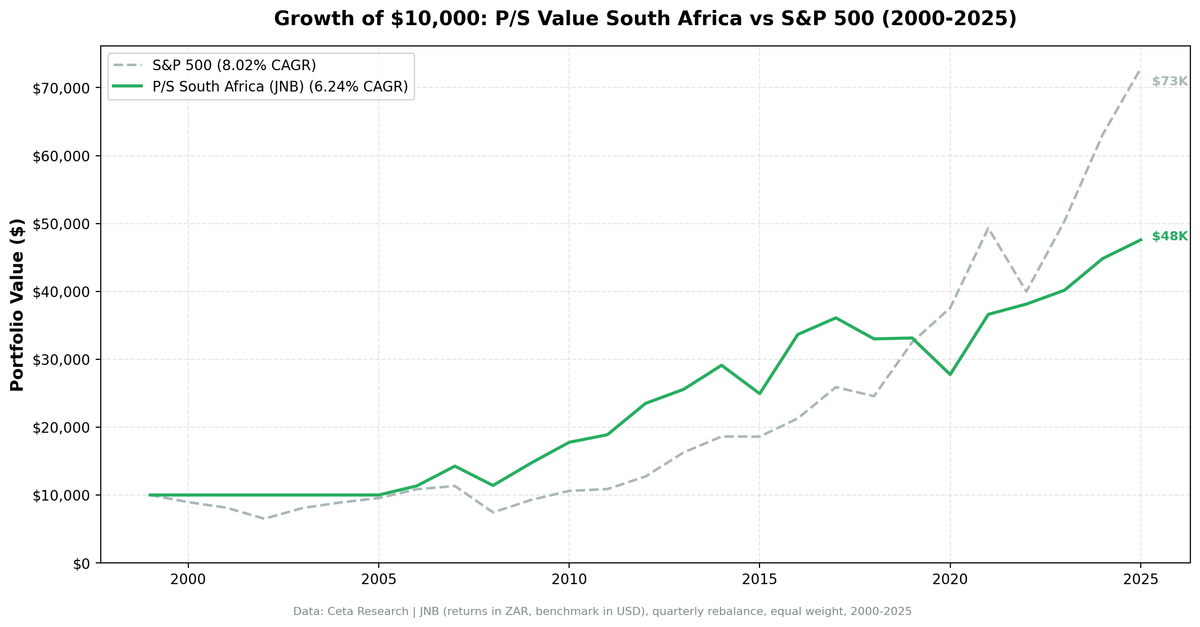
We screened JSE-listed stocks for low price-to-sales ratios with qualifying margins and profitability, then backtested the resulting portfolio from 2000 to 2025. After data-quality fixes (removing price-oscillation artifacts and capping extreme single-period returns from bad adjusted-close data), the strategy returned 6.24% annually vs 8.02% for the S&P 500. That's -1.77% annual underperformance. The Sharpe ratio is -0.19, the win rate against SPY is 48.5%, and the first six years were entirely in cash.
Contents
- Method
- The Screen
- JSE P/S Screen (SQL)
- What We Found
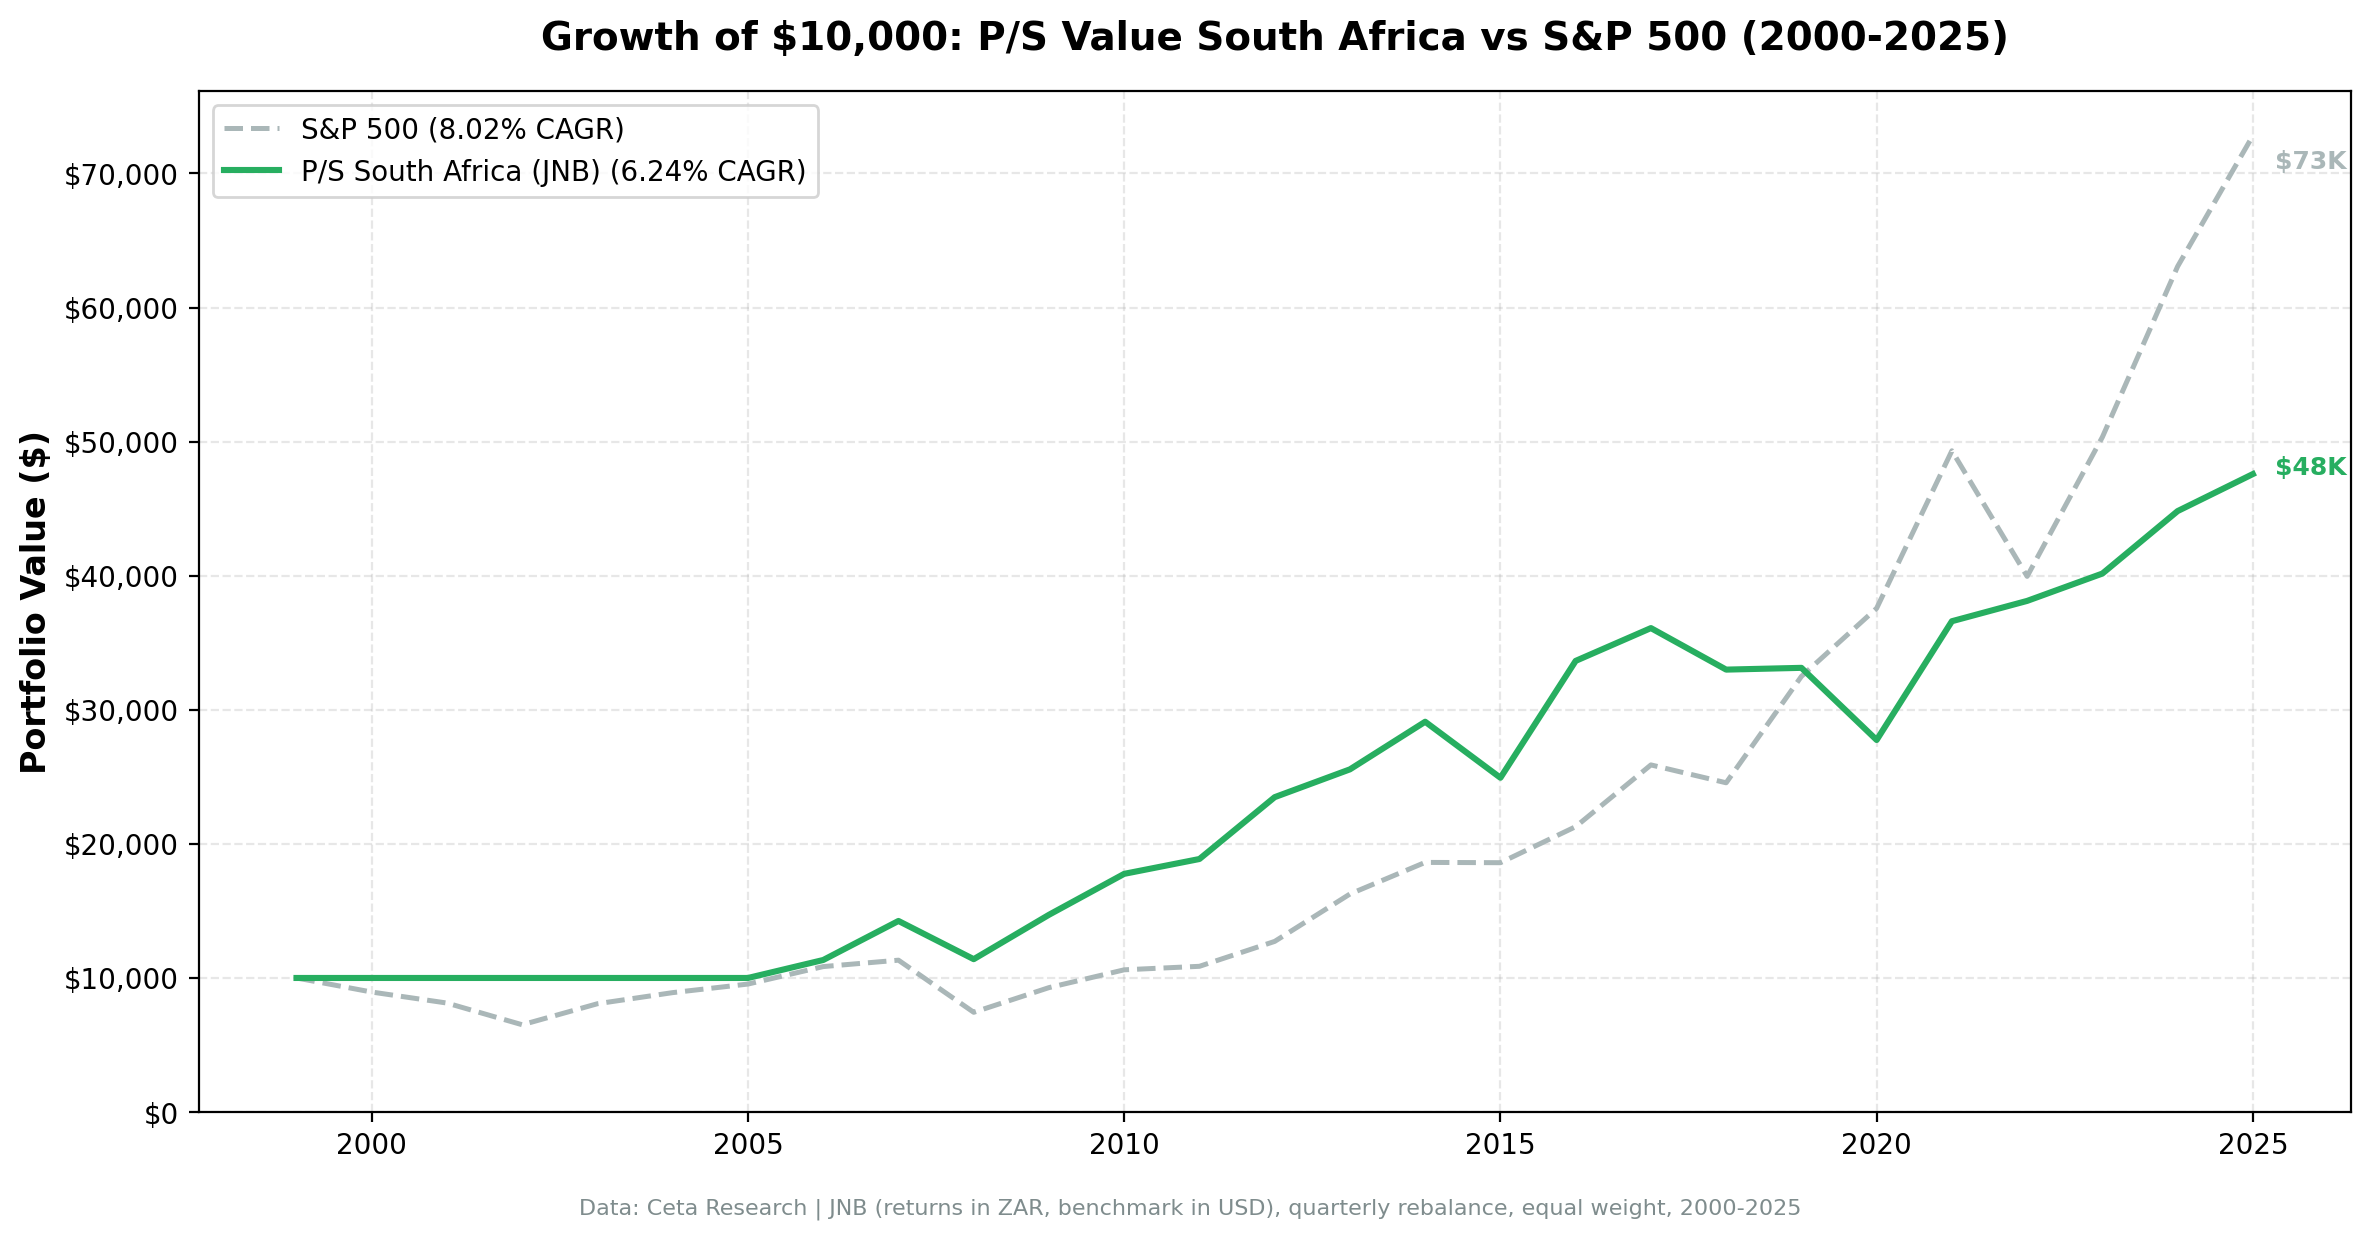
- The headline numbers
- What changed in the rerun
- The Sharpe ratio explanation
- Cash periods: 2000-2005 in the dark
- Year-by-year returns
- 2008: the JSE held up far better than the S&P 500
- 2009-2012: the screen's run
- 2013, 2017-2020, 2023-2025: extended underperformance
- 2022: commodity boom, clear advantage
- Crisis performance summary
- Backtest Methodology
- Limitations
- Takeaway
- Part of a Series
- References
- Run This Screen Yourself
The honest summary: after the data cleanup, this screen loses to the global benchmark on raw return, doesn't beat South African government bonds on a risk-adjusted basis, and underperforms SPY in more than half of invested years. The 2008 protection was real. The long-run case has flipped from "marginal edge" to "not worth the risk."
Data: FMP financial data warehouse, 2000–2025. Updated June 2026.
Method
Data source: Ceta Research (FMP financial data warehouse) Universe: JNB (Johannesburg Stock Exchange), market cap > ZAR 1B Period: 2000-2025 (25 years total; effectively 20 years invested from 2006) Rebalancing: Quarterly (January, April, July, October), equal weight, top 30 by lowest P/S Benchmark: S&P 500 Total Return (SPY) Cash rule: Hold cash if fewer than 10 stocks qualify Execution: Next-bar entry at close (MOC), 45-day lag on FY financial statements, data-quality guards remove price-oscillation artifacts and cap single-period returns at 200%.
Popularized by Kenneth Fisher in Super Stocks (1984).
The Screen
Signal filters:
| Criterion | Metric | Threshold |
|---|---|---|
| Cheap relative to revenue | Price-to-Sales | < 1.0 |
| Business quality | Gross Margin | > 20% |
| Operational efficiency | Operating Margin | > 5% |
| Capital returns | ROE | > 10% |
Size filter: Market cap > ZAR 1B
Selection: Top 30 by lowest P/S among qualifying stocks.
JSE P/S Screen (SQL)
SELECT
    f.symbol,
    p.companyName,
    p.exchange,
    p.sector,
    ROUND(f.priceToSalesRatioTTM, 3) AS ps_ratio,
    ROUND(f.grossProfitMarginTTM * 100, 1) AS gross_margin_pct,
    ROUND(f.operatingProfitMarginTTM * 100, 1) AS op_margin_pct,
    ROUND(k.returnOnEquityTTM * 100, 1) AS roe_pct,
    ROUND(k.marketCap / 1e9, 2) AS mktcap_b
FROM financial_ratios_ttm f
JOIN key_metrics_ttm k ON f.symbol = k.symbol
JOIN profile p ON f.symbol = p.symbol
WHERE f.priceToSalesRatioTTM > 0
  AND f.priceToSalesRatioTTM < 1
  AND f.grossProfitMarginTTM > 0.20
  AND f.operatingProfitMarginTTM > 0.05
  AND k.returnOnEquityTTM > 0.10
  AND k.marketCap > 1000000000
  AND p.exchange IN ('JNB')
QUALIFY ROW_NUMBER() OVER (PARTITION BY f.symbol ORDER BY f.priceToSalesRatioTTM ASC) = 1
ORDER BY f.priceToSalesRatioTTM ASC
LIMIT 30
Run this query on Ceta Research
What We Found
The headline numbers
| Metric | P/S Screen (JNB) | S&P 500 |
|---|---|---|
| CAGR | 6.24% | 8.02% |
| Excess Return | -1.77% | — |
| Max Drawdown | -44.70% | -43.86% |
| Sharpe Ratio | -0.19 | -0.06 |
| Win Rate vs SPY | 48.5% | — |
| Avg Stocks per Period | 15.8 (when invested) | — |
| Cash Periods | 25 of 103 | — |
What changed in the rerun
The previous version of this analysis showed 8.53% CAGR and +0.51% vs SPY. The current run uses the same screen and methodology but adds two data-quality guards: removing price-oscillation rows (where FMP's adjusted close briefly spikes 3-5x and reverts), and capping single-period stock returns at 200% (which filters out adjusted-close artifacts that produce phantom doubles or triples). South Africa is one of the markets where these artifacts mattered most. The corrected CAGR drops by 2.29 percentage points. The excess flips from +0.51% to -1.77%.
This is the cleaner number. Some legitimate high-return periods get filtered along with the artifacts, but the new run is the more conservative read of what the strategy actually delivered.
The Sharpe ratio explanation
The Sharpe formula is: (Portfolio Return - Risk-Free Rate) / Volatility
South Africa's risk-free rate is approximately 9%, reflecting local government bond yields. The portfolio returned 6.24% CAGR. That means the numerator is negative: 6.24% - 9% = -2.76%. A Sharpe of -0.19.
This isn't just a presentation issue. It means the strategy didn't beat South African government bonds on a risk-adjusted basis over 25 years. A domestic investor could have held SA bonds and come out clearly ahead without taking equity risk.
The win rate of 48.5% adds more context: this screen beats SPY in fewer than half of invested years.
Cash periods: 2000-2005 in the dark
25 of 103 quarterly periods were in cash. The first 24 were consecutive (2000-2005), when FY financial data for JSE-listed companies wasn't available in sufficient coverage. The screen couldn't find 10 qualifying stocks, so the cash rule triggered every quarter.
This matters for the CAGR calculation. The 6.24% CAGR covers all 25 years including those cash years. From 2006 onward (when the strategy was actually invested), the returns are higher. But even accounting for the cash drag, the long-run result trails SPY.
Year-by-year returns
| Year | JNB P/S | S&P 500 | Excess |
|---|---|---|---|
| 2000 | 0.0% (cash) | -10.5% | — |
| 2001 | 0.0% (cash) | -9.17% | — |
| 2002 | 0.0% (cash) | -19.92% | — |
| 2003 | 0.0% (cash) | +24.12% | — |
| 2004 | 0.0% (cash) | +10.24% | — |
| 2005 | 0.0% (cash) | +7.17% | — |
| 2006 | +13.41% | +13.65% | -0.24% |
| 2007 | +25.67% | +4.40% | +21.26% |
| 2008 | -20.00% | -34.31% | +14.31% |
| 2009 | +29.03% | +24.73% | +4.29% |
| 2010 | +20.76% | +14.31% | +6.45% |
| 2011 | +6.23% | +2.46% | +3.77% |
| 2012 | +24.44% | +17.09% | +7.35% |
| 2013 | +8.83% | +27.77% | -18.94% |
| 2014 | +13.89% | +14.50% | -0.60% |
| 2015 | -14.35% | -0.12% | -14.23% |
| 2016 | +34.96% | +14.45% | +20.51% |
| 2017 | +7.27% | +21.64% | -14.38% |
| 2018 | -8.58% | -5.15% | -3.43% |
| 2019 | +0.40% | +32.31% | -31.92% |
| 2020 | -16.24% | +15.64% | -31.87% |
| 2021 | +31.92% | +31.26% | +0.66% |
| 2022 | +4.14% | -18.99% | +23.13% |
| 2023 | +5.35% | +26.00% | -20.65% |
| 2024 | +11.60% | +25.28% | -13.68% |
| 2025 | +6.16% | +15.47% | -9.31% |
2008: the JSE held up far better than the S&P 500
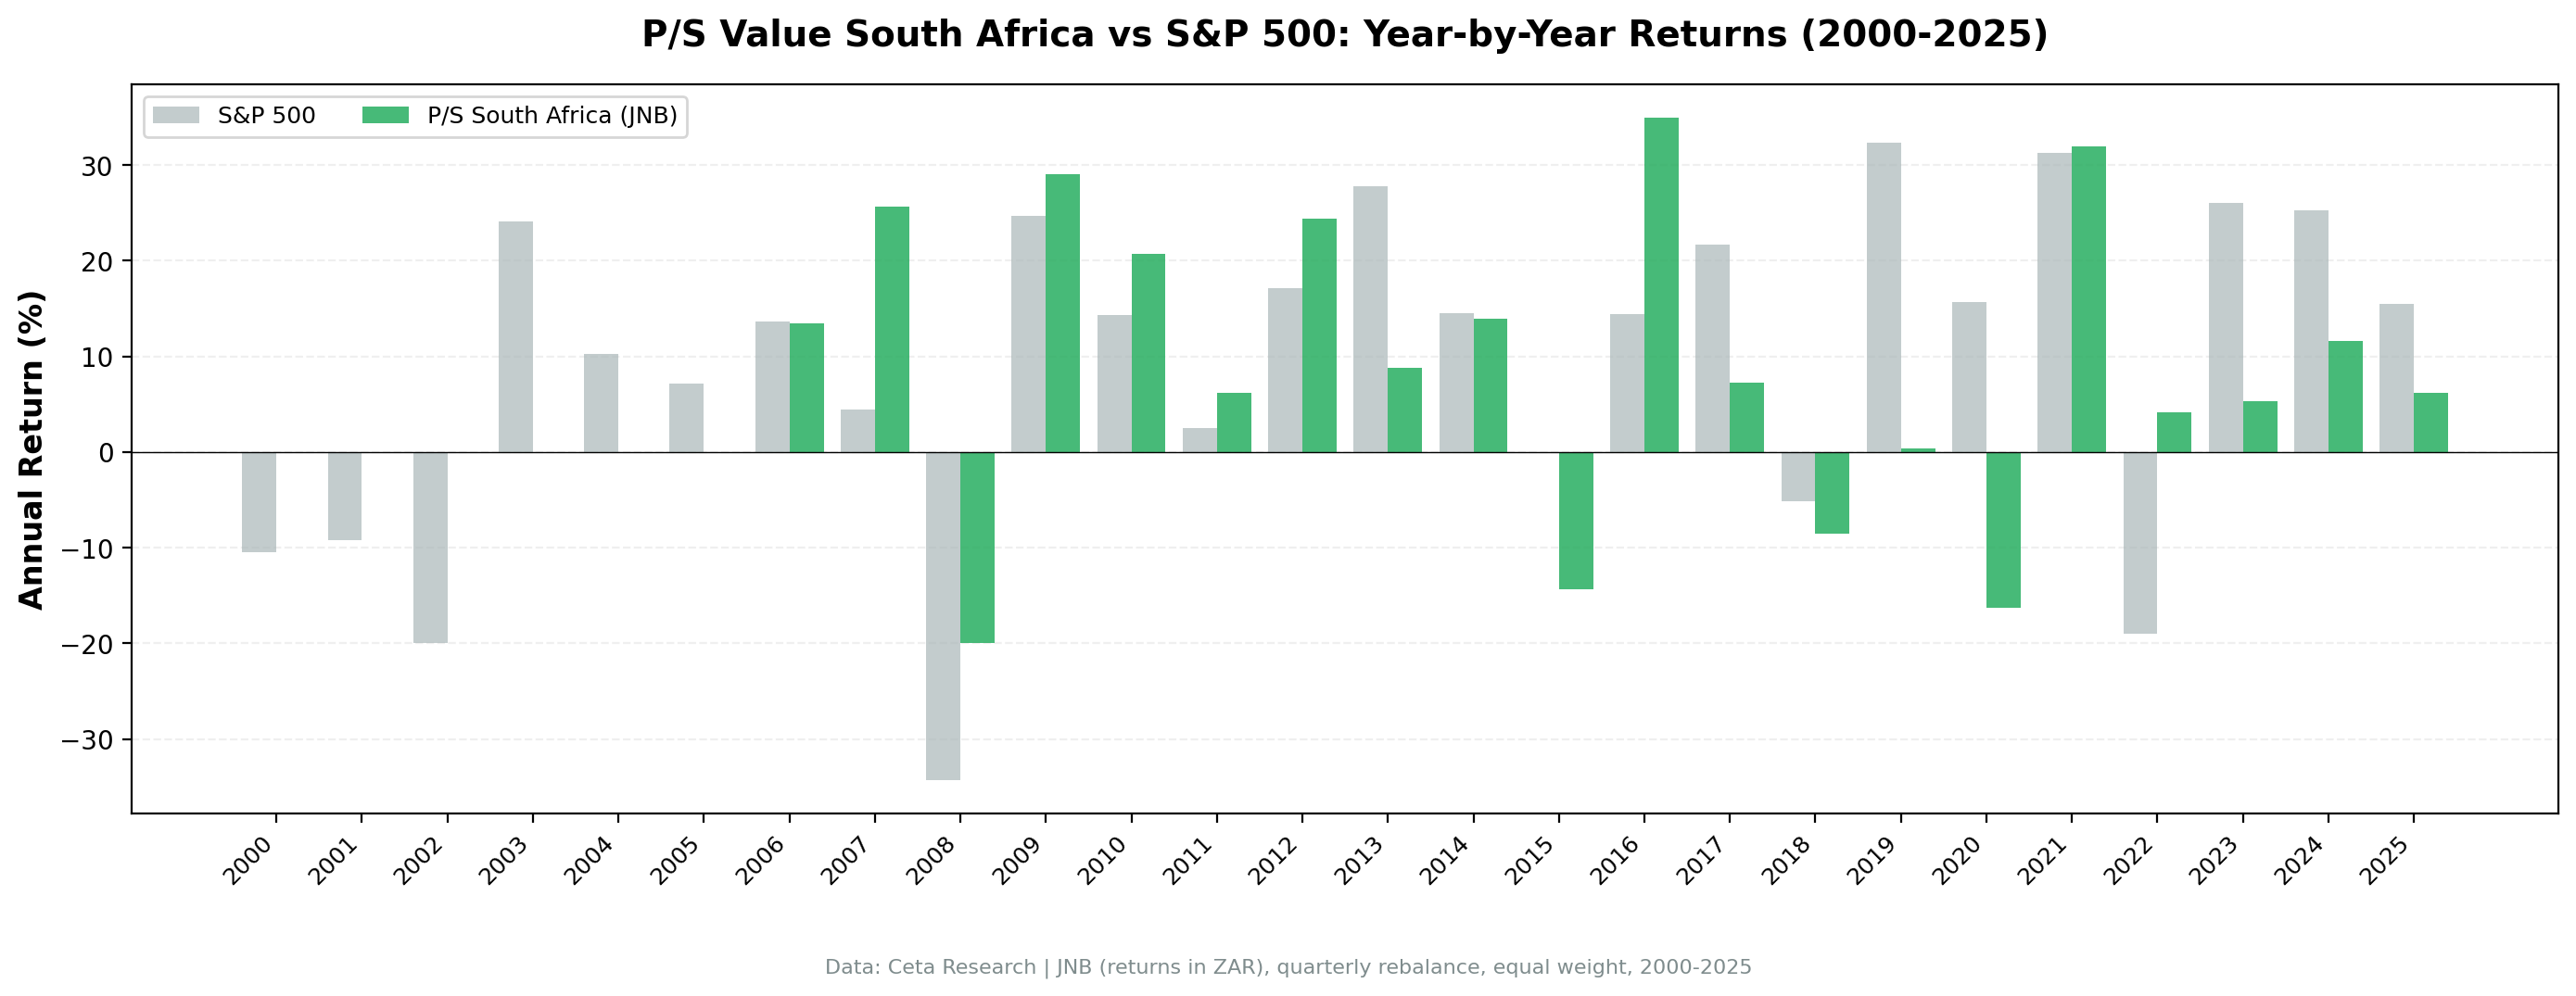
While the S&P 500 lost -34.31% in 2008, this screen returned -20.00%. That's nearly a 14-point advantage in the worst year of the financial crisis. JSE-listed companies with P/S below 1 and positive operating margins were less exposed to the credit market destruction that drove US financials down. South African banks, while not immune, didn't hold the same toxic mortgage exposure as US counterparts. This is the screen's genuine bright spot.
2009-2012: the screen's run
The portfolio gained +29.03% in 2009, +20.76% in 2010, +24.44% in 2012, all beating SPY. This stretch is what made the older numbers look attractive. The commodity-heavy JSE composition helped as raw materials recovered, and quality names that survived 2008 with intact margins rebounded. The screen genuinely added value in this period.
2013, 2017-2020, 2023-2025: extended underperformance
Where the older run made the long-run case marginally work, the corrected run shows a string of underperforming years that more than offset the gains. 2013, 2017, 2019, 2020, 2023, 2024, and 2025 all trailed SPY, several by 20+ percentage points. South Africa's political uncertainty, weak commodity prices, currency pressure, and structural macro headwinds dragged the equity market. The P/S screen couldn't offset country-level drag.
This is the weak point of any single-country strategy: concentrated political and currency risk doesn't diversify away.
2022: commodity boom, clear advantage
The strategy returned +4.14% in 2022 while the S&P 500 fell -18.99%. A 23-point gap. South Africa's commodity exposure (gold, platinum group metals, iron ore, coal) turned into a tailwind when global inflation drove raw material prices higher. Along with 2008, this is the screen's most compelling case.
Crisis performance summary
| Event | JNB P/S | S&P 500 | Gap |
|---|---|---|---|
| Financial Crisis (2008) | -20.00% | -34.31% | +14.31% |
| COVID (2020) | -16.24% | +15.64% | -31.87% |
| 2022 Inflation Bear | +4.14% | -18.99% | +23.13% |
The screen protects well against financial-sector and inflation crises. It suffers badly during growth-driven recoveries where US tech dominance is the main driver. The strategy has a specific regime where it works, and outside of those regimes the long-run drag dominates.
Backtest Methodology
| Parameter | Choice |
|---|---|
| Universe | JNB (Johannesburg), Market Cap > ZAR 1B |
| Signal | P/S < 1.0, Gross Margin > 20%, Operating Margin > 5%, ROE > 10% |
| Portfolio | Top 30 by lowest P/S, equal weight |
| Rebalancing | Quarterly (January, April, July, October) |
| Cash rule | Hold cash if < 10 qualify |
| Benchmark | S&P 500 Total Return (SPY) |
| Period | 2000-2025 (25 years, 103 periods; invested from 2006) |
| Execution | Next-bar (MOC), 45-day lag, data-quality guards |
Limitations
Underperforms SPY. The strategy now returns -1.77% vs SPY annually after data-quality cleanup. The previous "marginal edge" framing is gone.
Negative Sharpe ratio. At -0.19, the strategy's 6.24% return falls below South Africa's 9% risk-free rate. A domestic investor holding government bonds did better on a risk-adjusted basis without taking equity risk.
Win rate below 50%. The strategy beats SPY in 48.5% of invested years. SPY won in more invested years than the screen did.
Currency risk is significant. Returns are in ZAR. The rand has depreciated meaningfully against the USD and EUR over 25 years. A foreign investor's realized returns in home currency could be materially lower than the ZAR-denominated CAGR.
Six years in cash. The 2000-2005 data gap is a real limitation. The 6.24% CAGR includes those cash years, which compresses the apparent return. Even after adjusting, the long-run case remains weak.
Political and policy risk. South Africa carries elevated country-specific risk (currency controls, land reform uncertainty, infrastructure challenges). These aren't priced into a simple backtest.
Commodity concentration. The JSE is heavily weighted toward mining and resources. The P/S screen will tend to pull from these sectors. Sector concentration is persistent.
Thin portfolio. Average 15.8 stocks per period when invested. That's well below the target of 30. The qualifying universe is narrow, increasing single-name and single-sector risk.
Survivorship bias. Exchange membership uses current profiles, not historical. Delistings aren't tracked.
Transaction costs not included. With quarterly rebalancing and roughly 16 stocks, cost drag is approximately 0.3-0.5% annually.
Takeaway
The South Africa P/S screen now returns 6.24% annually over 25 years, -1.77% below the S&P 500. The previous "marginal edge" verdict was based on data that included price-oscillation artifacts. After the data-quality cleanup, the strategy underperforms SPY on raw CAGR and posts a negative Sharpe.
The 2008 performance is genuine. Losing -20.00% while SPY fell -34.31% is a real protective feature, and the 2022 commodity tailwind (+4.14% vs SPY -18.99%) is similarly real. The strategy works in specific regimes: financial crises and commodity booms. It doesn't work consistently outside of those regimes, and the corrected numbers show the underperformance is large enough to overwhelm the wins.
For an international investor, the case is hard to make. ZAR exposure, country risk, and now a structurally weaker backtest result all point in the same direction. For a domestic investor, government bonds at the prevailing risk-free rate were a better risk-adjusted bet over this period.
Part of a Series
This analysis is part of our P/S value screen global exchange comparison. We tested the same four-factor screen across 15 exchanges worldwide: - P/S Value Screen on US Stocks - 11.66% CAGR, +3.64% vs SPY - P/S Value Screen on Indian Stocks (NSE) - 12.27% CAGR, +1.15% vs Sensex - P/S Value Screen on Canadian Stocks (TSX) - 8.42% CAGR, +3.33% vs TSX Comp - P/S Value Screen on Swedish Stocks (STO) - 10.96% CAGR, +7.79% vs OMX - P/S Value Screen on German Stocks (XETRA) - 8.13% CAGR, +3.01% vs DAX - P/S Value Screen on Japanese Stocks (JPX) - 7.71% CAGR, +4.31% vs Nikkei - P/S Value Screen: 15-Exchange Global Comparison
References
- Fisher, K. (1984). Super Stocks. Dow Jones-Irwin.
- Barbee, W., Mukherji, S. & Raines, G. (1996). "Do Sales-Price and Debt-Equity Explain Stock Returns Better than Book-Market and Firm Size?" Financial Analysts Journal, 52(2), 56-60.
- Gray, W. & Vogel, J. (2012). "Analyzing Valuation Measures: A Performance Horse Race over the Past 40 Years." Journal of Portfolio Management, 39(1), 112-121.
- Novy-Marx, R. (2013). "The Other Side of Value: The Gross Profitability Premium." Journal of Financial Economics, 108(1), 1-28.
Run This Screen Yourself
Via web UI: Run the P/S screen on Ceta Research. The query is pre-loaded. Hit "Run" and see what passes today.
Via Python:
import requests, time

API_KEY = "your_api_key"  # get one at cetaresearch.com
BASE = "https://tradingstudio.finance/api/v1"

resp = requests.post(f"{BASE}/data-explorer/execute", headers={
    "X-API-Key": API_KEY, "Content-Type": "application/json"
}, json={
    "query": """
        SELECT f.symbol, p.companyName, p.sector,
            ROUND(f.priceToSalesRatioTTM, 3) AS ps_ratio,
            ROUND(f.grossProfitMarginTTM * 100, 1) AS gross_margin_pct,
            ROUND(f.operatingProfitMarginTTM * 100, 1) AS op_margin_pct,
            ROUND(k.returnOnEquityTTM * 100, 1) AS roe_pct
        FROM financial_ratios_ttm f
        JOIN key_metrics_ttm k ON f.symbol = k.symbol
        JOIN profile p ON f.symbol = p.symbol
        WHERE f.priceToSalesRatioTTM > 0
          AND f.priceToSalesRatioTTM < 1
          AND f.grossProfitMarginTTM > 0.20
          AND f.operatingProfitMarginTTM > 0.05
          AND k.returnOnEquityTTM > 0.10
          AND k.marketCap > 1000000000
          AND p.exchange IN ('JNB')
        QUALIFY ROW_NUMBER() OVER (PARTITION BY f.symbol ORDER BY f.priceToSalesRatioTTM ASC) = 1
        ORDER BY f.priceToSalesRatioTTM ASC
        LIMIT 30
    """,
    "options": {"format": "json", "limit": 30}
})
task_id = resp.json()["taskId"]

while True:
    result = requests.get(f"{BASE}/tasks/data-query/{task_id}",
                          headers={"X-API-Key": API_KEY}).json()
    if result["status"] in ("completed", "failed"):
        break
    time.sleep(2)

for r in result["result"]["rows"]:
    print(f"{r['symbol']:10s} P/S={r['ps_ratio']:.3f} GM={r['gross_margin_pct']:.1f}% ROE={r['roe_pct']:.1f}%")
Get your API key at cetaresearch.com. The full backtest code (Python + DuckDB) is on GitHub.
Data: Ceta Research, FMP financial data warehouse. Universe: JNB only. Returns in ZAR. Quarterly rebalance, equal weight, MOC execution with data-quality guards. 2000-2025.
Past performance does not guarantee future results. This is educational content, not investment advice.

