
Price-to-Sales Below 1 in Germany: 10.74% CAGR, Best Risk-Adjusted

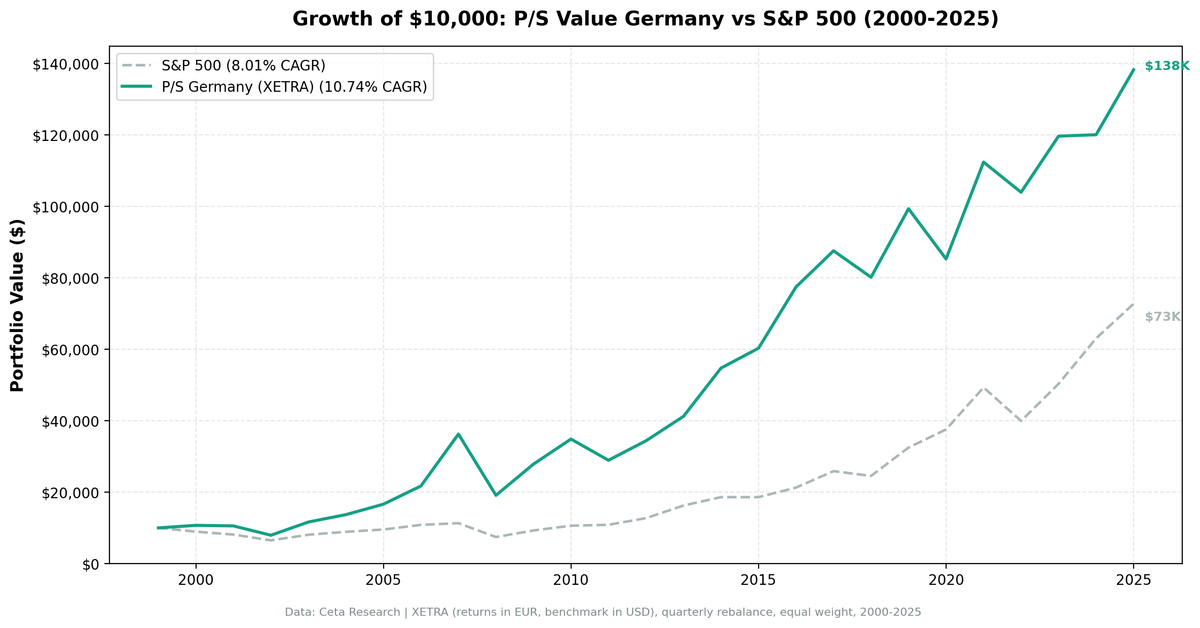
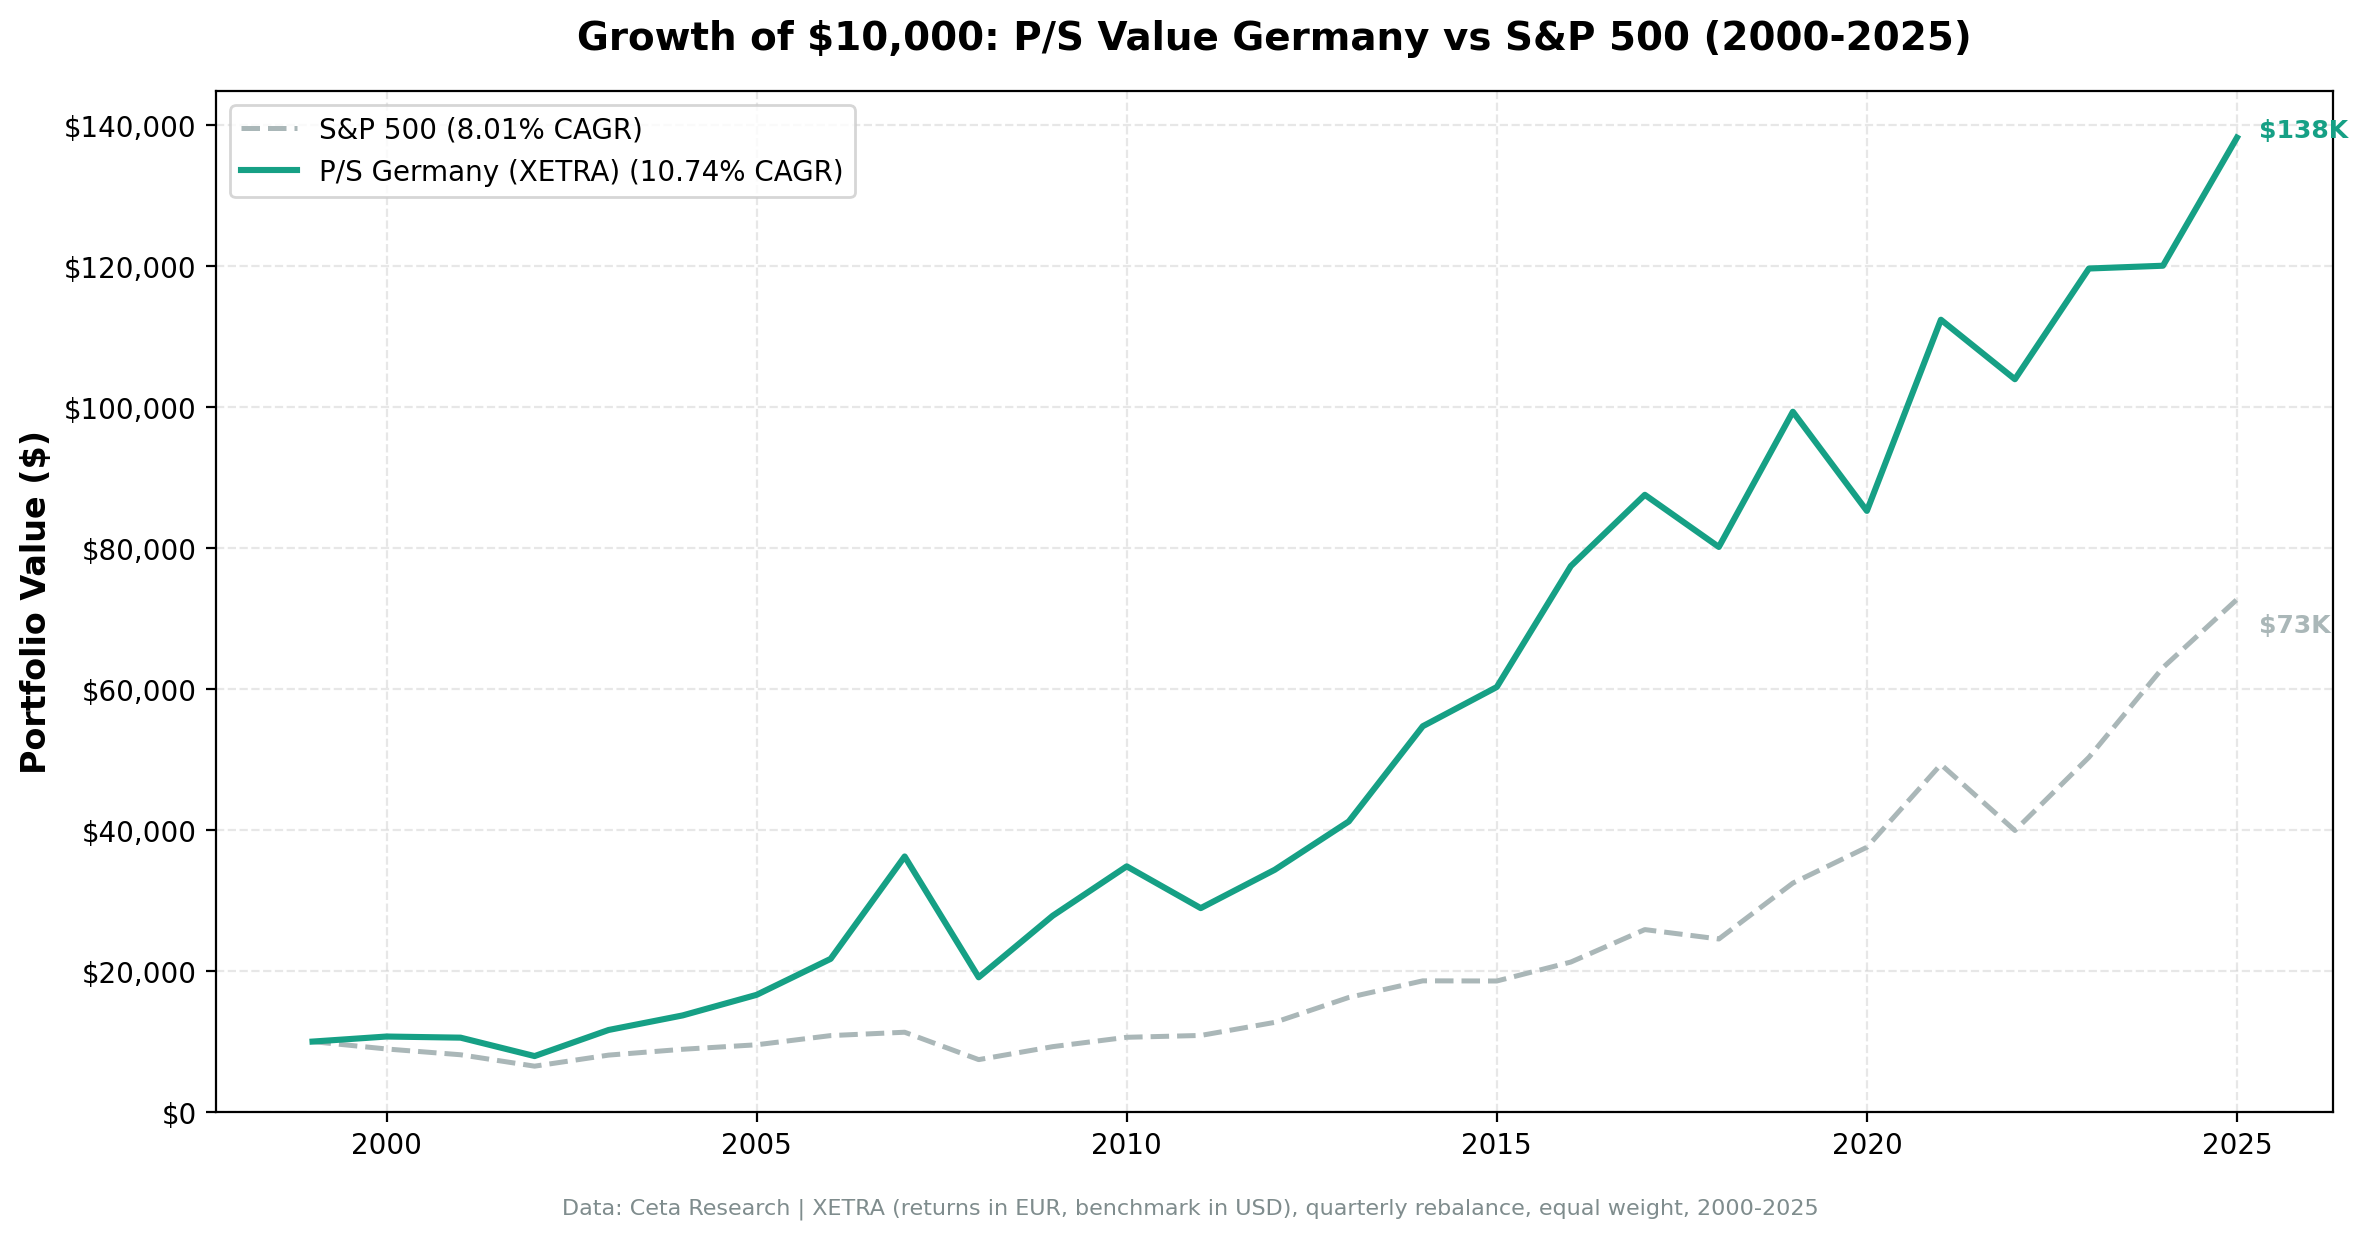
We screened XETRA-listed stocks for low price-to-sales ratios with qualifying margins and profitability, then backtested the resulting portfolio from 2000 to 2025. The strategy returned 10.74% annually vs 8.01% for the S&P 500, over 25 years and 100 quarterly periods. The Sharpe ratio of 0.408 was the highest of all 13 exchanges we tested globally. The portfolio was never in cash.
Contents
- Method
- The Screen
- XETRA P/S Screen (SQL)
- What We Found
- 25 years. Best Sharpe ratio of any exchange we tested.
- Year-by-year returns
- 2007: the standout year
- 2008: the flip side
- 2020: COVID hit European industrials differently
- 2024: flat amid structural weakness
- Where Germany's P/S screen works best
- Why Germany's Mittelstand fits this screen
- Backtest Methodology
- Limitations
- Takeaway
- Part of a Series
- References
- Run This Screen Yourself
Method
- Data source: Ceta Research (FMP financial data warehouse)
- Universe: XETRA, market cap > €300M EUR
- Period: 2000-2025 (25 years, 100 quarterly periods)
- Rebalancing: Quarterly (January, April, July, October), equal weight, top 30 by lowest P/S
- Benchmark: S&P 500 Total Return (SPY)
- Cash rule: Hold cash if fewer than 10 stocks qualify
Popularized by Kenneth Fisher in Super Stocks (1984). The P/S ratio avoids the noise in earnings-based metrics and works particularly well for companies with temporarily depressed margins. 45-day lag on financial data to prevent look-ahead bias.
The Screen
Signal filters:
| Criterion | Metric | Threshold |
|---|---|---|
| Cheap relative to revenue | Price-to-Sales | < 1.0 |
| Business quality | Gross Margin | > 20% |
| Operational efficiency | Operating Margin | > 5% |
| Capital returns | ROE | > 10% |
Size filter: Market cap > €300M EUR
Selection: Top 30 by lowest P/S among qualifying stocks.
XETRA P/S Screen (SQL)
SELECT
 f.symbol,
 p.companyName,
 p.exchange,
 p.sector,
 ROUND(f.priceToSalesRatioTTM, 3) AS ps_ratio,
 ROUND(f.grossProfitMarginTTM * 100, 1) AS gross_margin_pct,
 ROUND(f.operatingProfitMarginTTM * 100, 1) AS op_margin_pct,
 ROUND(k.returnOnEquityTTM * 100, 1) AS roe_pct,
 ROUND(k.marketCap / 1e9, 2) AS mktcap_b
FROM financial_ratios_ttm f
JOIN key_metrics_ttm k ON f.symbol = k.symbol
JOIN profile p ON f.symbol = p.symbol
WHERE f.priceToSalesRatioTTM > 0
 AND f.priceToSalesRatioTTM < 1
 AND f.grossProfitMarginTTM > 0.20
 AND f.operatingProfitMarginTTM > 0.05
 AND k.returnOnEquityTTM > 0.10
 AND k.marketCap > 300000000
 AND p.exchange IN ('XETRA')
QUALIFY ROW_NUMBER() OVER (PARTITION BY f.symbol ORDER BY f.priceToSalesRatioTTM ASC) = 1
ORDER BY f.priceToSalesRatioTTM ASC
LIMIT 30
Run this query on Ceta Research
What We Found
25 years. Best Sharpe ratio of any exchange we tested.
| Metric | P/S Screen (XETRA) | S&P 500 |
|---|---|---|
| CAGR | 10.74% | 8.01% |
| Excess Return | +2.73% | — |
| Max Drawdown | -55.29% | -45.53% |
| Sharpe Ratio | 0.408 | 0.354 |
| Avg Stocks per Period | 20.9 | — |
| Cash Periods | 0 of 100 | — |
The strategy turned €10,000 into approximately €125,000. The S&P 500 turned $10,000 into $68,000. Zero cash periods across 100 quarters: German mid-cap companies consistently had enough stocks trading below 1x revenue to stay fully invested the entire time.
The Sharpe of 0.408 is the headline number. Across all 13 exchanges we tested, no market produced better risk-adjusted returns with this screen. Germany combines a deep Mittelstand manufacturing base, consistent profitability, and modest market valuations relative to earnings and sales.
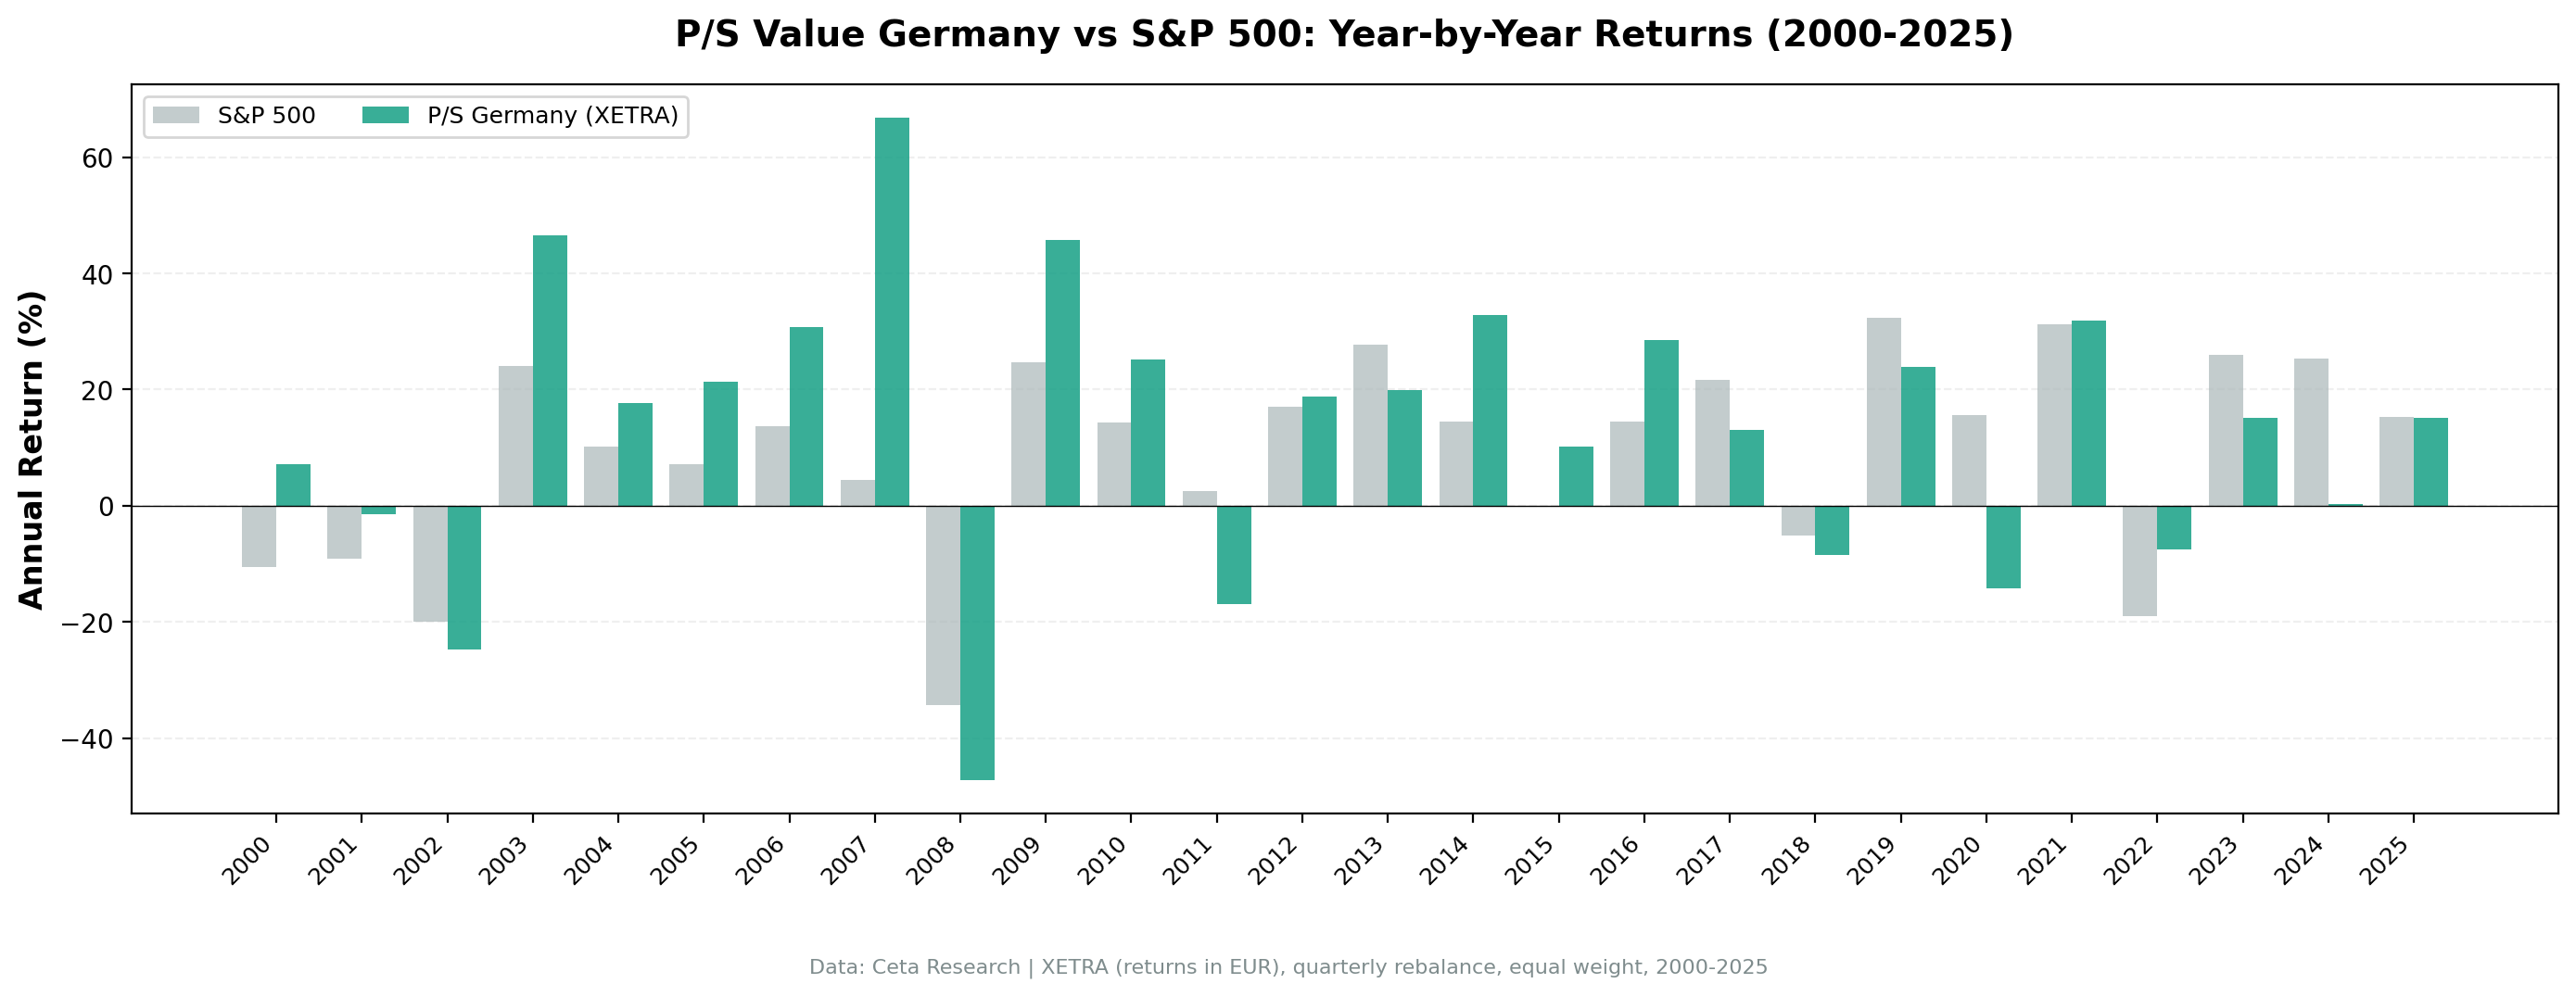
Year-by-year returns
| Year | XETRA P/S | S&P 500 | Excess |
|---|---|---|---|
| 2000 | +7.17% | -10.5% | +17.67% |
| 2001 | -1.49% | -9.17% | +7.68% |
| 2002 | -24.76% | -19.92% | -4.84% |
| 2003 | +46.61% | +24.12% | +22.49% |
| 2004 | +17.74% | +10.24% | +7.50% |
| 2005 | +21.31% | +7.17% | +14.14% |
| 2006 | +30.69% | +13.65% | +17.04% |
| 2007 | +66.83% | +4.40% | +62.43% |
| 2008 | -47.28% | -34.31% | -12.97% |
| 2009 | +45.69% | +24.73% | +20.96% |
| 2010 | +25.17% | +14.31% | +10.86% |
| 2011 | -17.01% | +2.46% | -19.47% |
| 2012 | +18.81% | +17.09% | +1.72% |
| 2013 | +19.94% | +27.77% | -7.83% |
| 2014 | +32.77% | +14.50% | +18.27% |
| 2015 | +10.16% | -0.12% | +10.28% |
| 2016 | +28.45% | +14.45% | +14.00% |
| 2017 | +13.06% | +21.64% | -8.58% |
| 2018 | -8.45% | -5.15% | -3.30% |
| 2019 | +23.93% | +32.31% | -8.38% |
| 2020 | -14.16% | +15.64% | -29.80% |
| 2021 | +31.80% | +31.26% | +0.54% |
| 2022 | -7.51% | -18.99% | +11.48% |
| 2023 | +15.11% | +26.00% | -10.89% |
| 2024 | +0.33% | +25.28% | -24.95% |
| 2025 | +15.14% | +15.34% | -0.20% |
2007: the standout year
The portfolio gained +66.83% in 2007 while the S&P 500 returned +4.40%. This wasn't luck. Germany's export machine was running at full capacity. Chinese industrialization drove demand for German capital equipment, machine tools, and automotive components. Companies that were trading below 1x revenue in 2006 re-rated sharply as their revenue base expanded. The P/S screen loaded up on exactly those names.
2008: the flip side
The same industrial exposure that drove 2007's gains produced a -47.28% drawdown in 2008, worse than the S&P 500's -34.31%. This is the honest tradeoff. XETRA industrials and exporters are cyclical. When global demand collapses, so do their revenues, and low P/S stocks get hit harder than defensive names. The max drawdown of -55.29% is higher than SPY's -45.53%.
If you're investing in this strategy, the 2008 experience is what you're signing up to survive through.
2020: COVID hit European industrials differently
The portfolio returned -14.16% in 2020 while the S&P 500 gained +15.64%. That's a 30-point gap in a single year. US large-cap tech pulled the S&P 500 through COVID. German industrials, with no equivalent tech sector to cushion the fall, took the full hit of lockdowns and supply chain disruption. This year alone explains much of the long-term Sharpe advantage eroding in recent periods.
2024: flat amid structural weakness
The portfolio returned +0.33% in 2024 while the S&P 500 gained +25.28%. XETRA was weak across the board that year. The auto sector (BMW, Mercedes-Benz, Volkswagen) suffered margin compression from Chinese EV competition and weak domestic demand. Energy-intensive manufacturers were still working through post-2022 cost structures. Stocks that looked cheap on P/S kept getting cheaper.
Where Germany's P/S screen works best
The screen performs best during global growth cycles where German exports are in demand (2003-2007, 2009-2010, 2014-2016). It struggles when the US market is being driven by technology multiples that have nothing to do with XETRA's industrial base (2019-2020, 2023-2024).
| Period | XETRA P/S | S&P 500 | Excess |
|---|---|---|---|
| Growth cycle (2003-07) | +183% cumulative | +87% cumulative | +96% |
| Post-crisis recovery (2009-10) | +83% cumulative | +42% cumulative | +41% |
| Recent drag (2019-24) | +40% cumulative | +151% cumulative | -111% |
Why Germany's Mittelstand fits this screen
German mid-cap companies (the Mittelstand) are often family-controlled, export-oriented manufacturers. They run lean balance sheets, maintain consistent margins, and rarely trade at high revenue multiples because they're not growth stories. They're durable businesses generating consistent cash flow.
That's exactly what a P/S < 1 screen with margin requirements is designed to find. The screen isn't just coincidentally working in Germany. Germany's market structure is naturally suited to it.
Backtest Methodology
| Parameter | Choice |
|---|---|
| Universe | XETRA, Market Cap > €300M EUR |
| Signal | P/S < 1.0, Gross Margin > 20%, Operating Margin > 5%, ROE > 10% |
| Portfolio | Top 30 by lowest P/S, equal weight |
| Rebalancing | Quarterly (January, April, July, October) |
| Cash rule | Hold cash if < 10 qualify |
| Benchmark | S&P 500 Total Return (SPY) |
| Period | 2000-2025 (25 years, 100 periods) |
| Data | Point-in-time (45-day lag for financial statements) |
Limitations
Higher drawdowns than the benchmark. The -55.29% max drawdown exceeds SPY's -45.53%. Industrial cyclicality is real. Any investor in this strategy needs to be prepared for a 2008-type event.
Currency exposure. Returns are in EUR. A US investor holding XETRA stocks takes on EUR/USD currency risk. EUR depreciation reduces USD-denominated returns; appreciation adds to them.
Concentration in industrials and materials. The P/S filter naturally pulls toward capital-intensive manufacturers. Sector concentration is a persistent feature, not an accident.
2024 structural headwinds. The auto sector's de-rating and ongoing energy cost pressures create genuine fundamental risks that a backward-looking screen won't flag. These aren't cyclical dips. Some may be structural.
Survivorship bias. Exchange membership uses current profiles, not historical. Delistings and restructurings aren't tracked.
Transaction costs not included. With quarterly rebalancing and roughly 21 stocks, cost drag is approximately 0.3-0.5% annually at standard institutional rates.
Takeaway
The XETRA P/S screen produced the best risk-adjusted return of any exchange we tested globally. 10.74% CAGR over 25 years, 2.73% annual alpha over the S&P 500, and a Sharpe of 0.408 with zero cash periods.
The reason isn't mysterious. Germany has a deep base of mid-cap industrial companies with genuine profitability, consistent margins, and modest market valuations. The P/S screen finds them systematically. The 45-day lag keeps the data clean. Quarterly rebalancing keeps the portfolio current.
The tradeoff is drawdown. The worst year was 2008 at -47.28%. The max drawdown hit -55.29%. If you hold XETRA industrials through a global demand collapse, they'll fall harder than the S&P 500. That's the deal. The 25-year track record says the long-run math works in your favor, but you have to actually stay in through those years.
Returns are in EUR. For international investors, the EUR/USD component adds another layer of risk and return to factor in.
Part of a Series
This analysis is part of our P/S value screen global exchange comparison. We tested the same four-factor screen across 13 exchanges worldwide: - P/S Value Screen on US Stocks - P/S Value Screen on Indian Stocks - P/S Value Screen on Canadian Stocks - P/S Value Screen on Swedish Stocks - P/S Value Screen on South African Stocks - P/S Value Screen on Japanese Stocks - P/S Value Screen: 13-Exchange Global Comparison
References
- Fisher, K. (1984). Super Stocks. Dow Jones-Irwin.
- Barbee, W., Mukherji, S. & Raines, G. (1996). "Do Sales-Price and Debt-Equity Explain Stock Returns Better than Book-Market and Firm Size?" Financial Analysts Journal, 52(2), 56-60.
- Gray, W. & Vogel, J. (2012). "Analyzing Valuation Measures: A Performance Horse Race over the Past 40 Years." Journal of Portfolio Management, 39(1), 112-121.
- Novy-Marx, R. (2013). "The Other Side of Value: The Gross Profitability Premium." Journal of Financial Economics, 108(1), 1-28.
Run This Screen Yourself
Via web UI: Run the P/S screen on Ceta Research. The query is pre-loaded. Hit "Run" and see what passes today.
Via Python:
import requests, time

API_KEY = "your_api_key" # get one at cetaresearch.com
BASE = "https://tradingstudio.finance/api/v1"

resp = requests.post(f"{BASE}/data-explorer/execute", headers={
 "X-API-Key": API_KEY, "Content-Type": "application/json"
}, json={
 "query": """
 SELECT
 f.symbol,
 p.companyName,
 ROUND(f.priceToSalesRatioTTM, 3) AS ps_ratio,
 ROUND(f.grossProfitMarginTTM * 100, 1) AS gross_margin_pct,
 ROUND(f.operatingProfitMarginTTM * 100, 1) AS op_margin_pct,
 ROUND(k.returnOnEquityTTM * 100, 1) AS roe_pct,
 ROUND(k.marketCap / 1e9, 2) AS mktcap_b
 FROM financial_ratios_ttm f
 JOIN key_metrics_ttm k ON f.symbol = k.symbol
 JOIN profile p ON f.symbol = p.symbol
 WHERE f.priceToSalesRatioTTM > 0
 AND f.priceToSalesRatioTTM < 1
 AND f.grossProfitMarginTTM > 0.20
 AND f.operatingProfitMarginTTM > 0.05
 AND k.returnOnEquityTTM > 0.10
 AND k.marketCap > 300000000
 AND p.exchange IN ('XETRA')
 QUALIFY ROW_NUMBER() OVER (
 PARTITION BY f.symbol ORDER BY f.priceToSalesRatioTTM ASC
 ) = 1
 ORDER BY f.priceToSalesRatioTTM ASC
 LIMIT 30
 """,
 "options": {"format": "json", "limit": 30}
})
task_id = resp.json()["taskId"]

while True:
 result = requests.get(f"{BASE}/tasks/data-query/{task_id}",
 headers={"X-API-Key": API_KEY}).json()
 if result["status"] in ("completed", "failed"):
 break
 time.sleep(2)

for r in result["result"]["rows"]:
 print(f"{r['symbol']:10s} P/S={r['ps_ratio']:.3f} GM={r['gross_margin_pct']:.1f}% ROE={r['roe_pct']:.1f}%")
Get your API key at cetaresearch.com. The full backtest code (Python + DuckDB) is on GitHub.
Part of a Series: Global | US | Sweden | Southafrica Stocks | Japan | India | Canada
Data: Ceta Research, FMP financial data warehouse. Universe: XETRA. Returns in EUR. Quarterly rebalance, equal weight, 2000-2025.


