
Switzerland P/E Compression: Low Volatility Can't Save Strategy

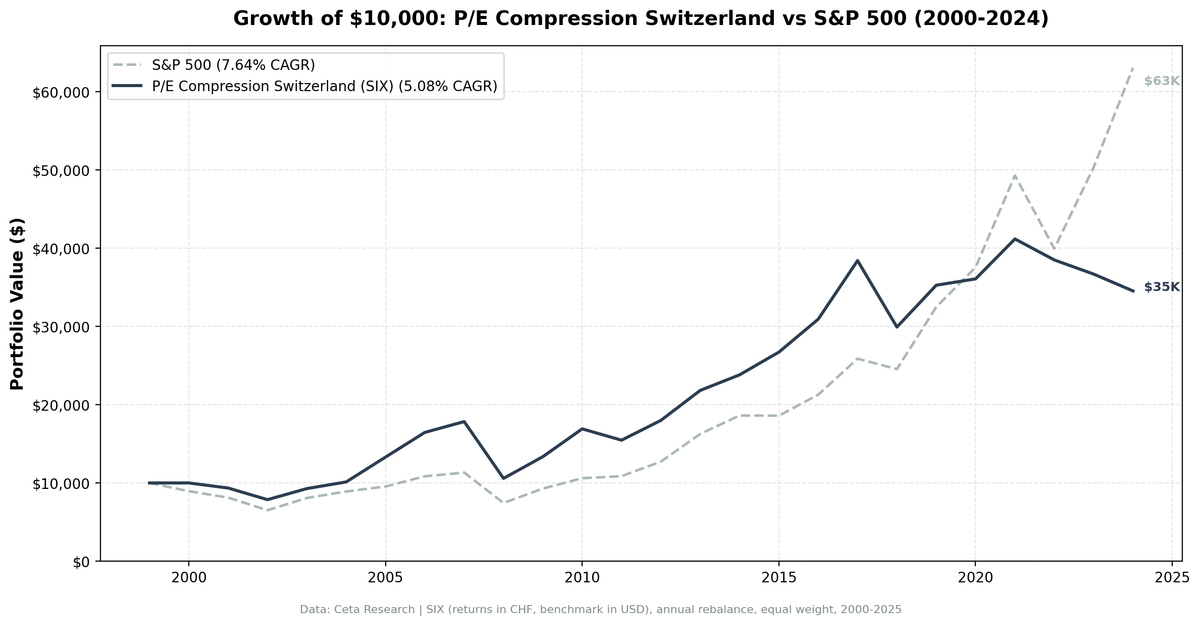
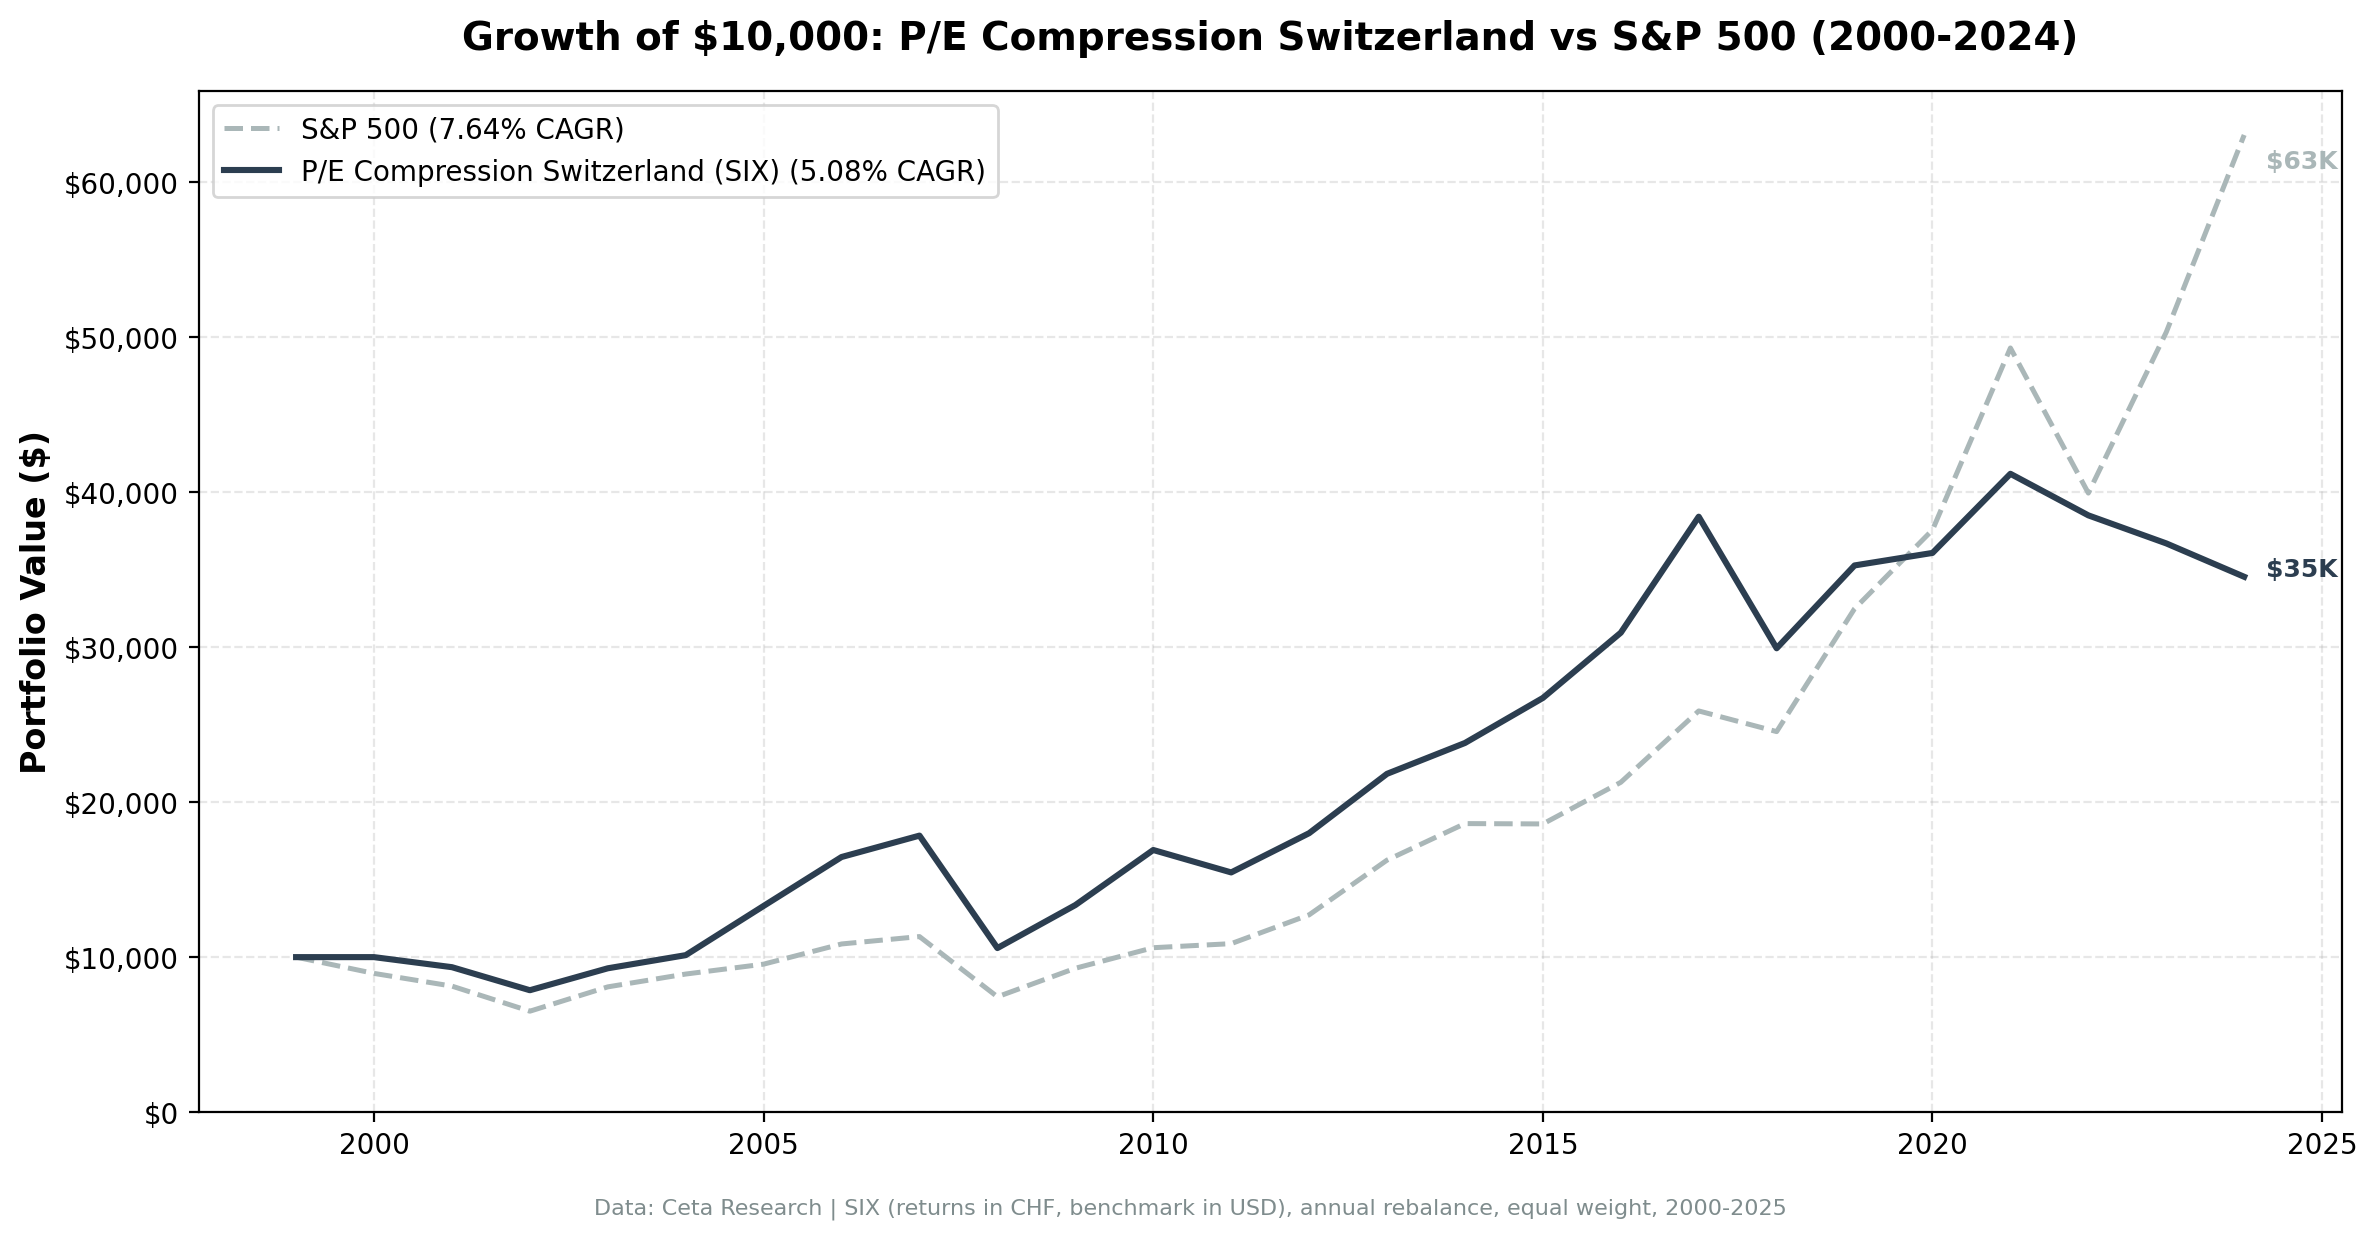
P/E compression on Swiss stocks underperforms SPY by 2.56% annually. The strategy returned 5.08% (CHF-denominated) vs 7.64% for SPY. Switzerland's reputation for stability and low volatility doesn't translate to profitable mean reversion. Compressed P/E ratios in defensive, mature Swiss companies often reflect genuine valuation concerns, not temporary sentiment.
Contents
Method
- Universe: SIX, market cap > CHF500M
- Period: 2000-2025 (25 years)
- Benchmark: S&P 500 Total Return (SPY, USD)
Returns in CHF. Benchmark in USD.
What We Found
| Metric | Switzerland | S&P 500 |
|---|---|---|
| CAGR | 5.08% | 7.64% |
| Excess | -2.56% | - |
| Sharpe | 0.264 | 0.322 |
| MaxDD | -40.68% | -34.90% |
| Down-Cap | 80.98% | 100% |
| Avg Stocks | 15.0 | - |
| Cash | 1/25 (4%) | - |
The Sharpe ratio of 0.264 is worse than SPY's 0.322. The max drawdown of -40.68% exceeds SPY's -34.90%. Low volatility didn't help.
Why Switzerland Underperforms
Swiss companies are defensive, mature, and globally diversified. They trade at stable multiples for good reason. When a Swiss stock's P/E compresses 15%, it's often because growth expectations have permanently reset, not because of temporary sentiment.
Methodology
- Screen: P/E compression ratio below 0.85 (current P/E at least 15% below 5-year average)
- Quality filters: ROE above 10%, debt-to-equity below 2.0
- Rebalancing: Annual, equal-weight top 30 qualifying stocks
- Period: 25 years of out-of-sample data (2000-2025)
The screen looks for stocks trading cheaply relative to their own history, not relative to peers. It filters out low-quality companies to avoid permanent capital loss.
Run It Yourself
Screen Swiss stocks with P/E compression filters on Ceta Research. Market cap threshold: CHF 500M, P/E compression ratio below 0.85, ROE above 10%, D/E below 2.0.
Part of a Series: US +2.32% | UK +1.38% | China -8.32% | India -3.50%
Conclusion
Low volatility alone doesn't make P/E compression work. Switzerland's mature, defensive companies experience compression when growth slows permanently, not temporarily. -2.56% annual underperformance shows the strategy fails here.
Run It Yourself
Explore the data behind this analysis on Ceta Research. Query our financial data warehouse with SQL, build custom screens, and run your own backtests across 70,000+ stocks on 20 exchanges.
Data: Ceta Research. Returns in CHF. github.com/ceta-research/backtests


