
India P/E Compression: 5.79% CAGR, Lagging the Sensex by 5.61% a Year
P/E compression on Indian NSE stocks delivers 5.79% CAGR vs 11.40% for the Sensex, underperforming by 5.61% a year. Most of the gap is one eight-year hole at the start where thin price data left the strategy with no position.

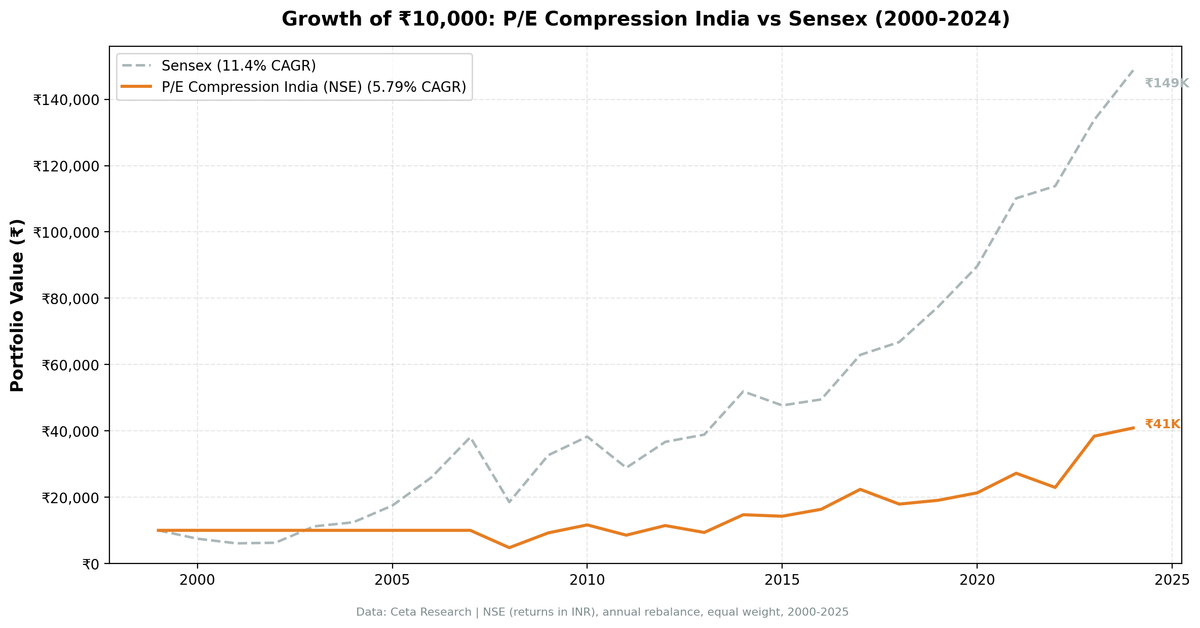
We tested P/E compression mean reversion on 25 years of Indian NSE stock data. The strategy returned 5.79% annually (INR-denominated) vs 11.40% for the Sensex, underperforming by 5.61% a year. Two things drive the gap: India's equity market has been one of the world's strongest, and the strategy had no position at all in the first eight years of the study, which covered a Sensex run of roughly 280%.
Contents
- Method
- What We Found
- 25 years. -5.61% annual underperformance vs the Sensex.
- Why P/E Compression Underperforms in India
- Year-by-Year Returns
- The invested record is close to even
- Backtest Methodology
- Limitations
- Conclusion
Data: FMP financial data warehouse, 2000-2025. Updated August 2026.
Method
Data source: Ceta Research (FMP financial data warehouse) Universe: NSE, market cap > ₹50B Period: 2000-2025 (25 years, 25 annual periods, 17 invested) Rebalancing: Annual (January), equal weight, top 30 by compression ratio Benchmark: BSE Sensex (^BSESN, INR, price index) Execution: Next-day close (mark-on-close) Cash rule: Hold cash if fewer than 10 stocks qualify and can be priced
Returns are in INR. The Sensex is the local benchmark a domestic Indian investor would compare against.
What We Found
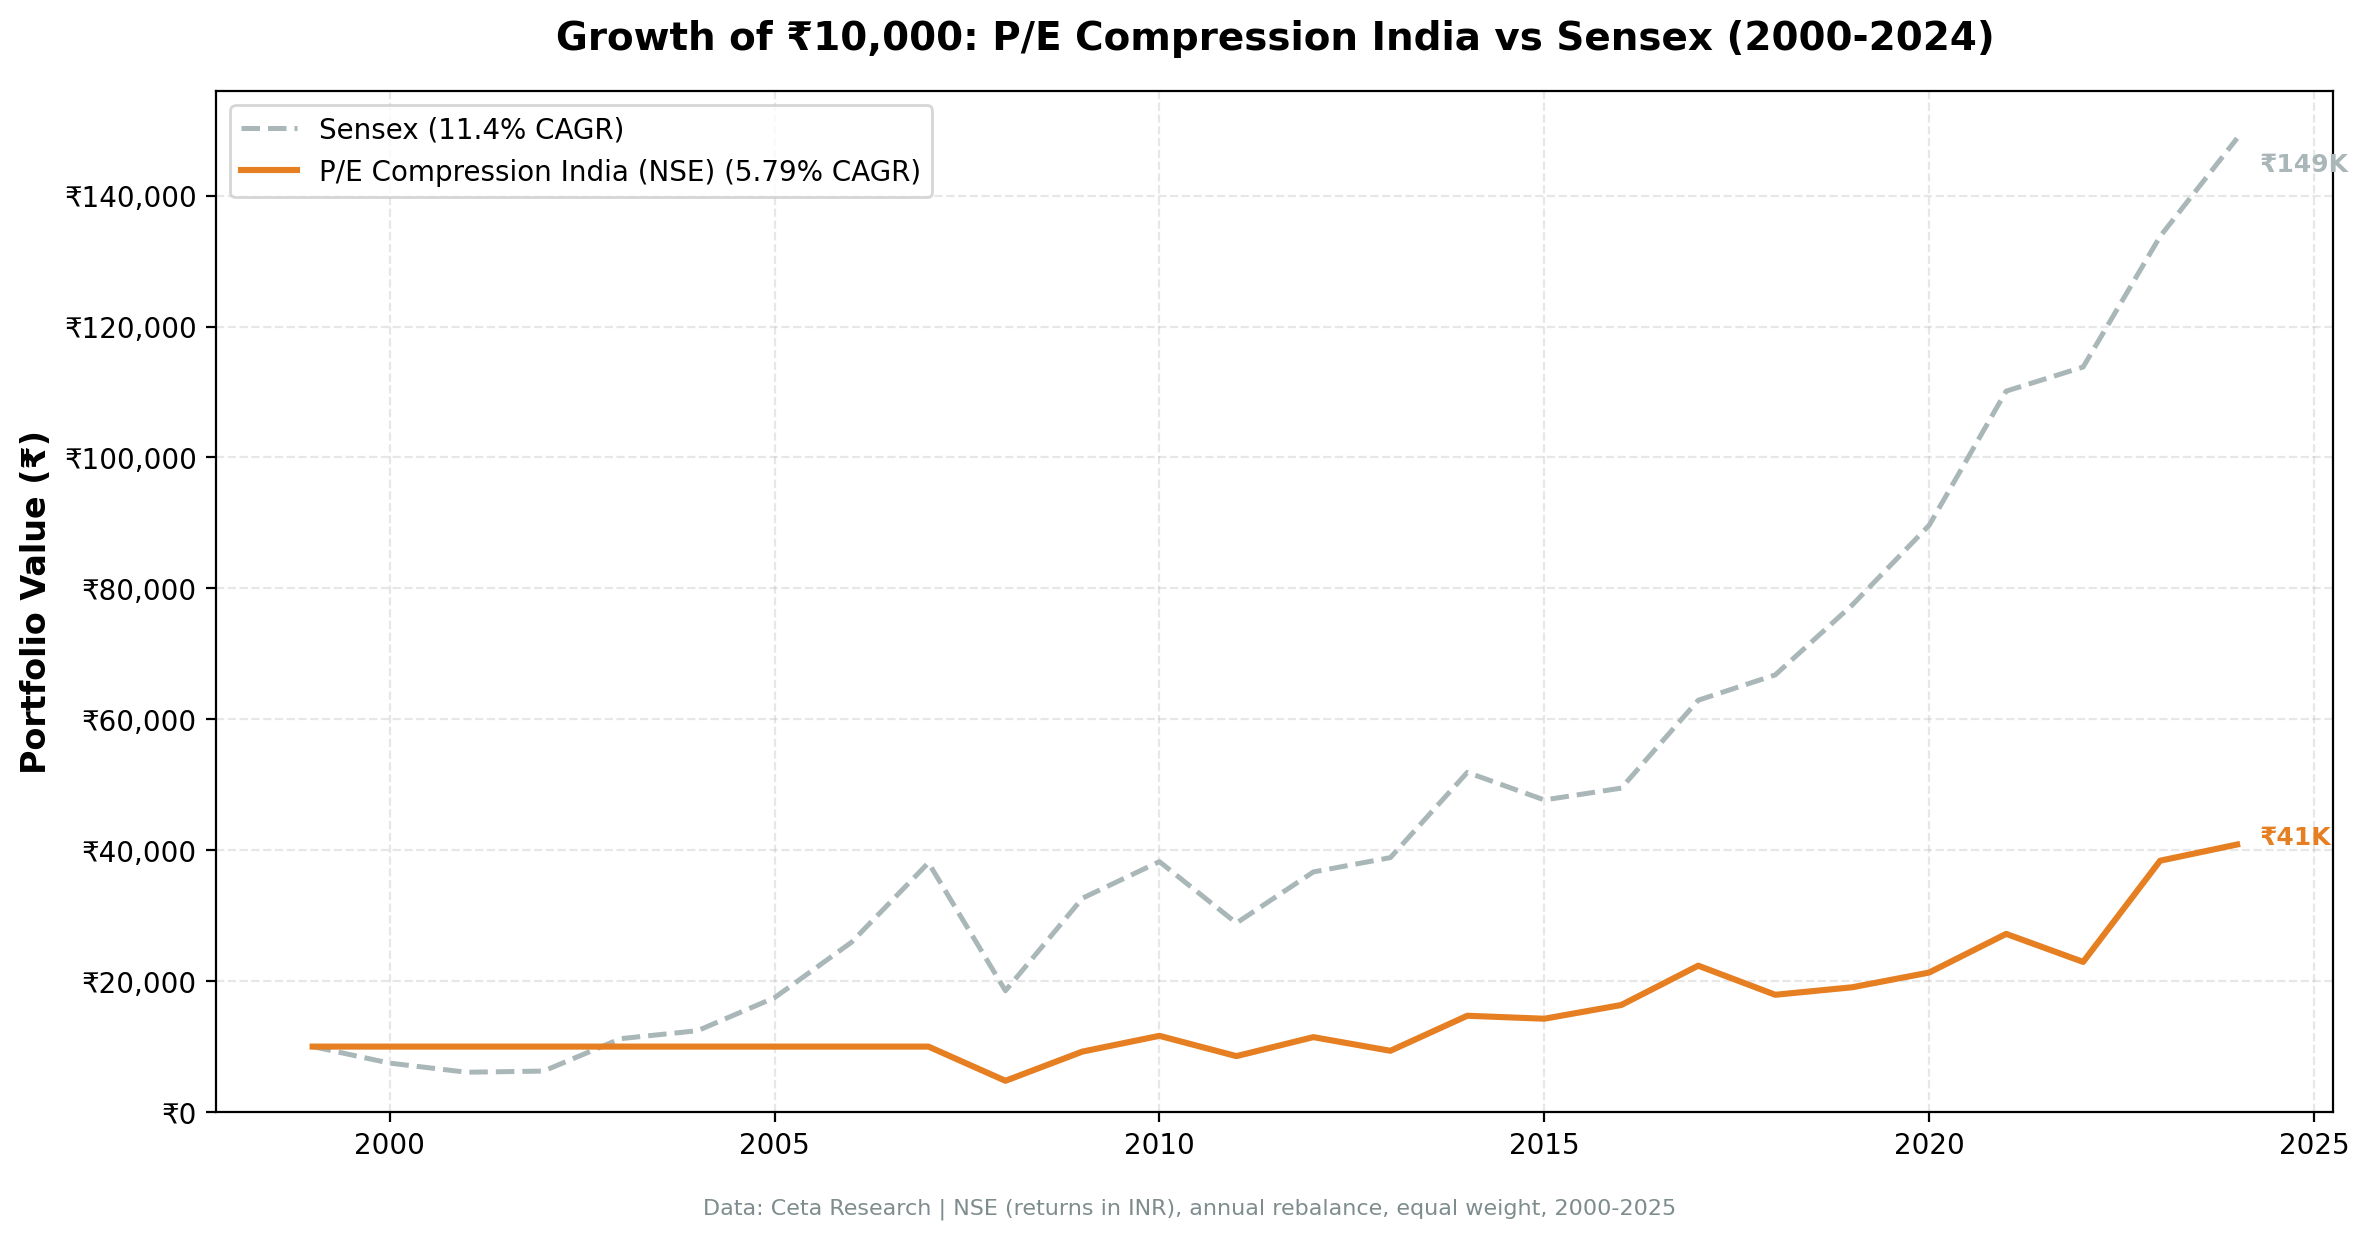
25 years. -5.61% annual underperformance vs the Sensex.
| Metric | P/E Compression (India) | Sensex |
|---|---|---|
| CAGR | 5.79% | 11.40% |
| Total Return | 309% | 1,387% |
| Excess CAGR | -5.61% | - |
| Sharpe Ratio | -0.023 | 0.165 |
| Sortino Ratio | -0.043 | 0.312 |
| Max Drawdown | -52.25% | -51.34% |
| Up Capture | 64.02% | 100% |
| Down Capture | 64.09% | 100% |
| Avg Stocks per Year | 22.8 | - |
| Cash Periods | 8 of 25 (32%) | - |
₹10,000 grew to about ₹41,000 under the strategy against ₹149,000 in the Sensex. The strategy's Sharpe ratio is negative, meaning its 5.79% CAGR didn't clear the Indian risk-free rate over this period.
The capture ratios are the clearest summary of what went wrong: 64% up and 64% down. The portfolio participates in about two-thirds of the Sensex's gains and absorbs about two-thirds of its losses. There's no asymmetry at all. In a market that compounded at 11.40%, taking two-thirds of the upside is simply a large drag.
The benchmark excludes dividends. Portfolio returns use dividend-adjusted prices, but ^BSESN is the Sensex price index and does not reinvest dividends. The Sensex has yielded roughly 1% to 1.5% a year over this period, so a like-for-like total-return comparison would widen the -5.61% deficit by approximately that much. This caveat works against the strategy here rather than for it.
Why P/E Compression Underperforms in India
The first eight years have no position. 2000 through 2007 are all cash. FMP's Indian price coverage doesn't reach far enough back to price 10 qualifying NSE names in those years, so the strategy sat out a stretch in which the Sensex returned roughly 280% cumulatively. That single gap accounts for most of the 25-year deficit. It's a data limitation, not a signal, and it means the honest version of this test starts in 2008.
India's equity market is a strong benchmark. The Sensex returned 11.40% annually over 25 years, one of the highest rates among major global markets. Most active strategies fail to beat a strong index over 25 years.
Emerging market volatility overwhelms the signal. Indian markets swing violently. P/E ratios compress and expand based on earnings volatility, policy changes and liquidity shocks, not just sentiment. Mean reversion assumes some stability in P/E dynamics. India doesn't always provide that.
Earnings quality. Indian companies have less predictable earnings than mature-market counterparts. A compressed P/E often reflects genuine concern about future earnings, not temporary sentiment.
Year-by-Year Returns
| Year | P/E Compression | Sensex | Excess |
|---|---|---|---|
| 2000 | cash | -25.2% | +25.2% |
| 2001 | cash | -18.6% | +18.6% |
| 2002 | cash | +2.9% | -2.9% |
| 2003 | cash | +79.1% | -79.1% |
| 2004 | cash | +10.8% | -10.8% |
| 2005 | cash | +40.6% | -40.6% |
| 2006 | cash | +48.5% | -48.5% |
| 2007 | cash | +46.8% | -46.8% |
| 2008 | -52.2% | -51.3% | -0.9% |
| 2009 | +93.5% | +76.3% | +17.1% |
| 2010 | +26.1% | +17.1% | +9.0% |
| 2011 | -26.6% | -24.5% | -2.1% |
| 2012 | +33.9% | +27.0% | +6.9% |
| 2013 | -18.2% | +6.0% | -24.2% |
| 2014 | +57.2% | +33.5% | +23.7% |
| 2015 | -3.1% | -8.1% | +5.0% |
| 2016 | +14.7% | +3.8% | +10.9% |
| 2017 | +36.7% | +27.1% | +9.6% |
| 2018 | -19.9% | +6.2% | -26.0% |
| 2019 | +6.4% | +16.0% | -9.6% |
| 2020 | +11.8% | +15.7% | -3.9% |
| 2021 | +27.7% | +22.9% | +4.8% |
| 2022 | -15.7% | +3.4% | -19.1% |
| 2023 | +67.4% | +17.5% | +49.9% |
| 2024 | +6.5% | +11.2% | -4.8% |
The invested record is close to even
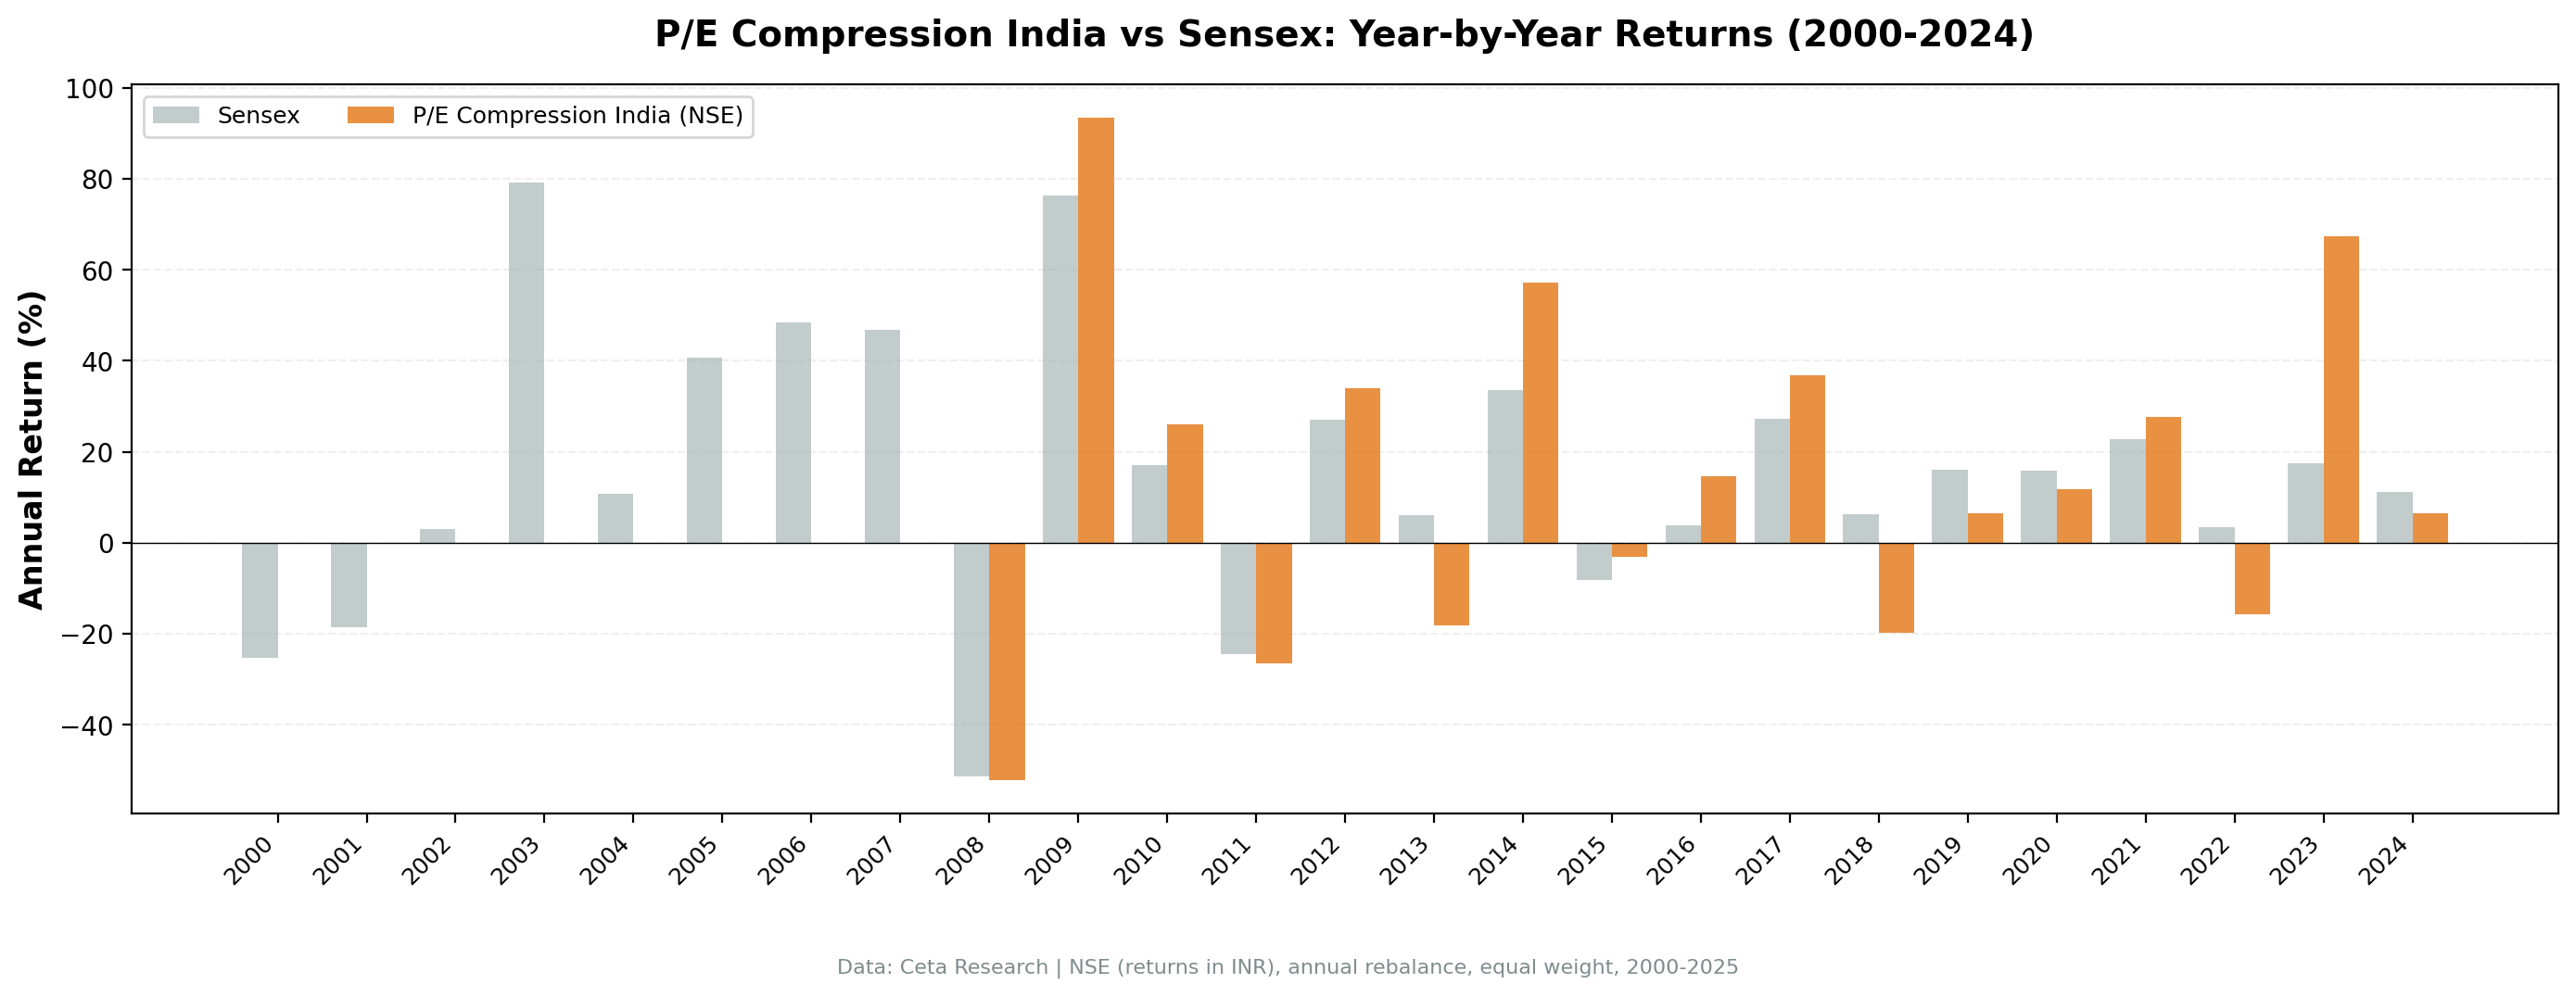
Count only the 17 years the strategy actually held stocks and it beat the Sensex in 9 of them, including a +49.9% year in 2023 and +23.7% in 2014. Over 2008-2024 the two are much closer than the headline suggests.
That's the more useful read of India. The strategy isn't structurally broken here. It missed the single best stretch in modern Indian market history because the price data to run it didn't exist, and no amount of later performance recovers a 280% index move you weren't in.
The offsetting weak years are real too: 2013 (-24.2%), 2018 (-26.0%) and 2022 (-19.1%) were all years when compressed multiples kept compressing.
Backtest Methodology
| Parameter | Choice |
|---|---|
| Universe | NSE, Market Cap > ₹50B |
| Signal | Current P/E < 85% of 5-year avg, P/E 5-40, ROE > 10%, D/E < 2.0 |
| Portfolio | Top 30 by lowest compression ratio, equal weight |
| Rebalancing | Annual (January) |
| Execution | Next-day close (mark-on-close) |
| Cash rule | Hold cash if fewer than 10 qualify and can be priced |
| Benchmark | BSE Sensex (^BSESN, INR, price index) |
| Period | 2000-2025 (25 years, 17 invested) |
| Data | Point-in-time (45-day lag on FY financial statements) |
| Transaction costs | 0.3% one-way (mid-cap tier) |
Limitations
Eight years with no position, and they're the wrong eight. 2000-2007 is 32% of the study and the strongest stretch the Sensex had. The cause is FMP price coverage, not a market judgment.
The benchmark excludes dividends. At a roughly 1% to 1.5% Sensex yield, a like-for-like comparison widens the deficit slightly.
Universe restricted to NSE only. BSE stocks were excluded because dual listings duplicate the same company and distort return calculations. This narrows the eligible universe.
Strong benchmark is a high bar. 11.40% CAGR from the Sensex over 25 years is exceptional. P/E compression works best against weak-to-moderate benchmark returns.
Survivorship bias. Exchange membership uses current NSE profiles. Delistings over 25 years aren't fully tracked, which in a market that grew this fast is a meaningful omission.
Conclusion
India's P/E compression strategy generates 5.79% CAGR in INR terms and underperforms the Sensex by 5.61% annually. For a domestic Indian investor over this period, a Sensex index fund would have done far better.
The nuance worth keeping: most of that gap is one eight-year hole at the start of the study where the strategy had no position, and across the 17 years it was actually invested it beat the Sensex in 9. That doesn't rescue the 25-year number, but it does mean the right conclusion is "we can't test this properly in India before 2008", not "mean reversion is dead in Indian equities".
Data: Ceta Research (FMP financial data warehouse). Returns in INR. Universe: NSE only. Benchmark: BSE Sensex price index, which does not reinvest dividends. Past performance does not guarantee future results. Not investment advice. See full methodology at github.com/ceta-research/backtests.

