
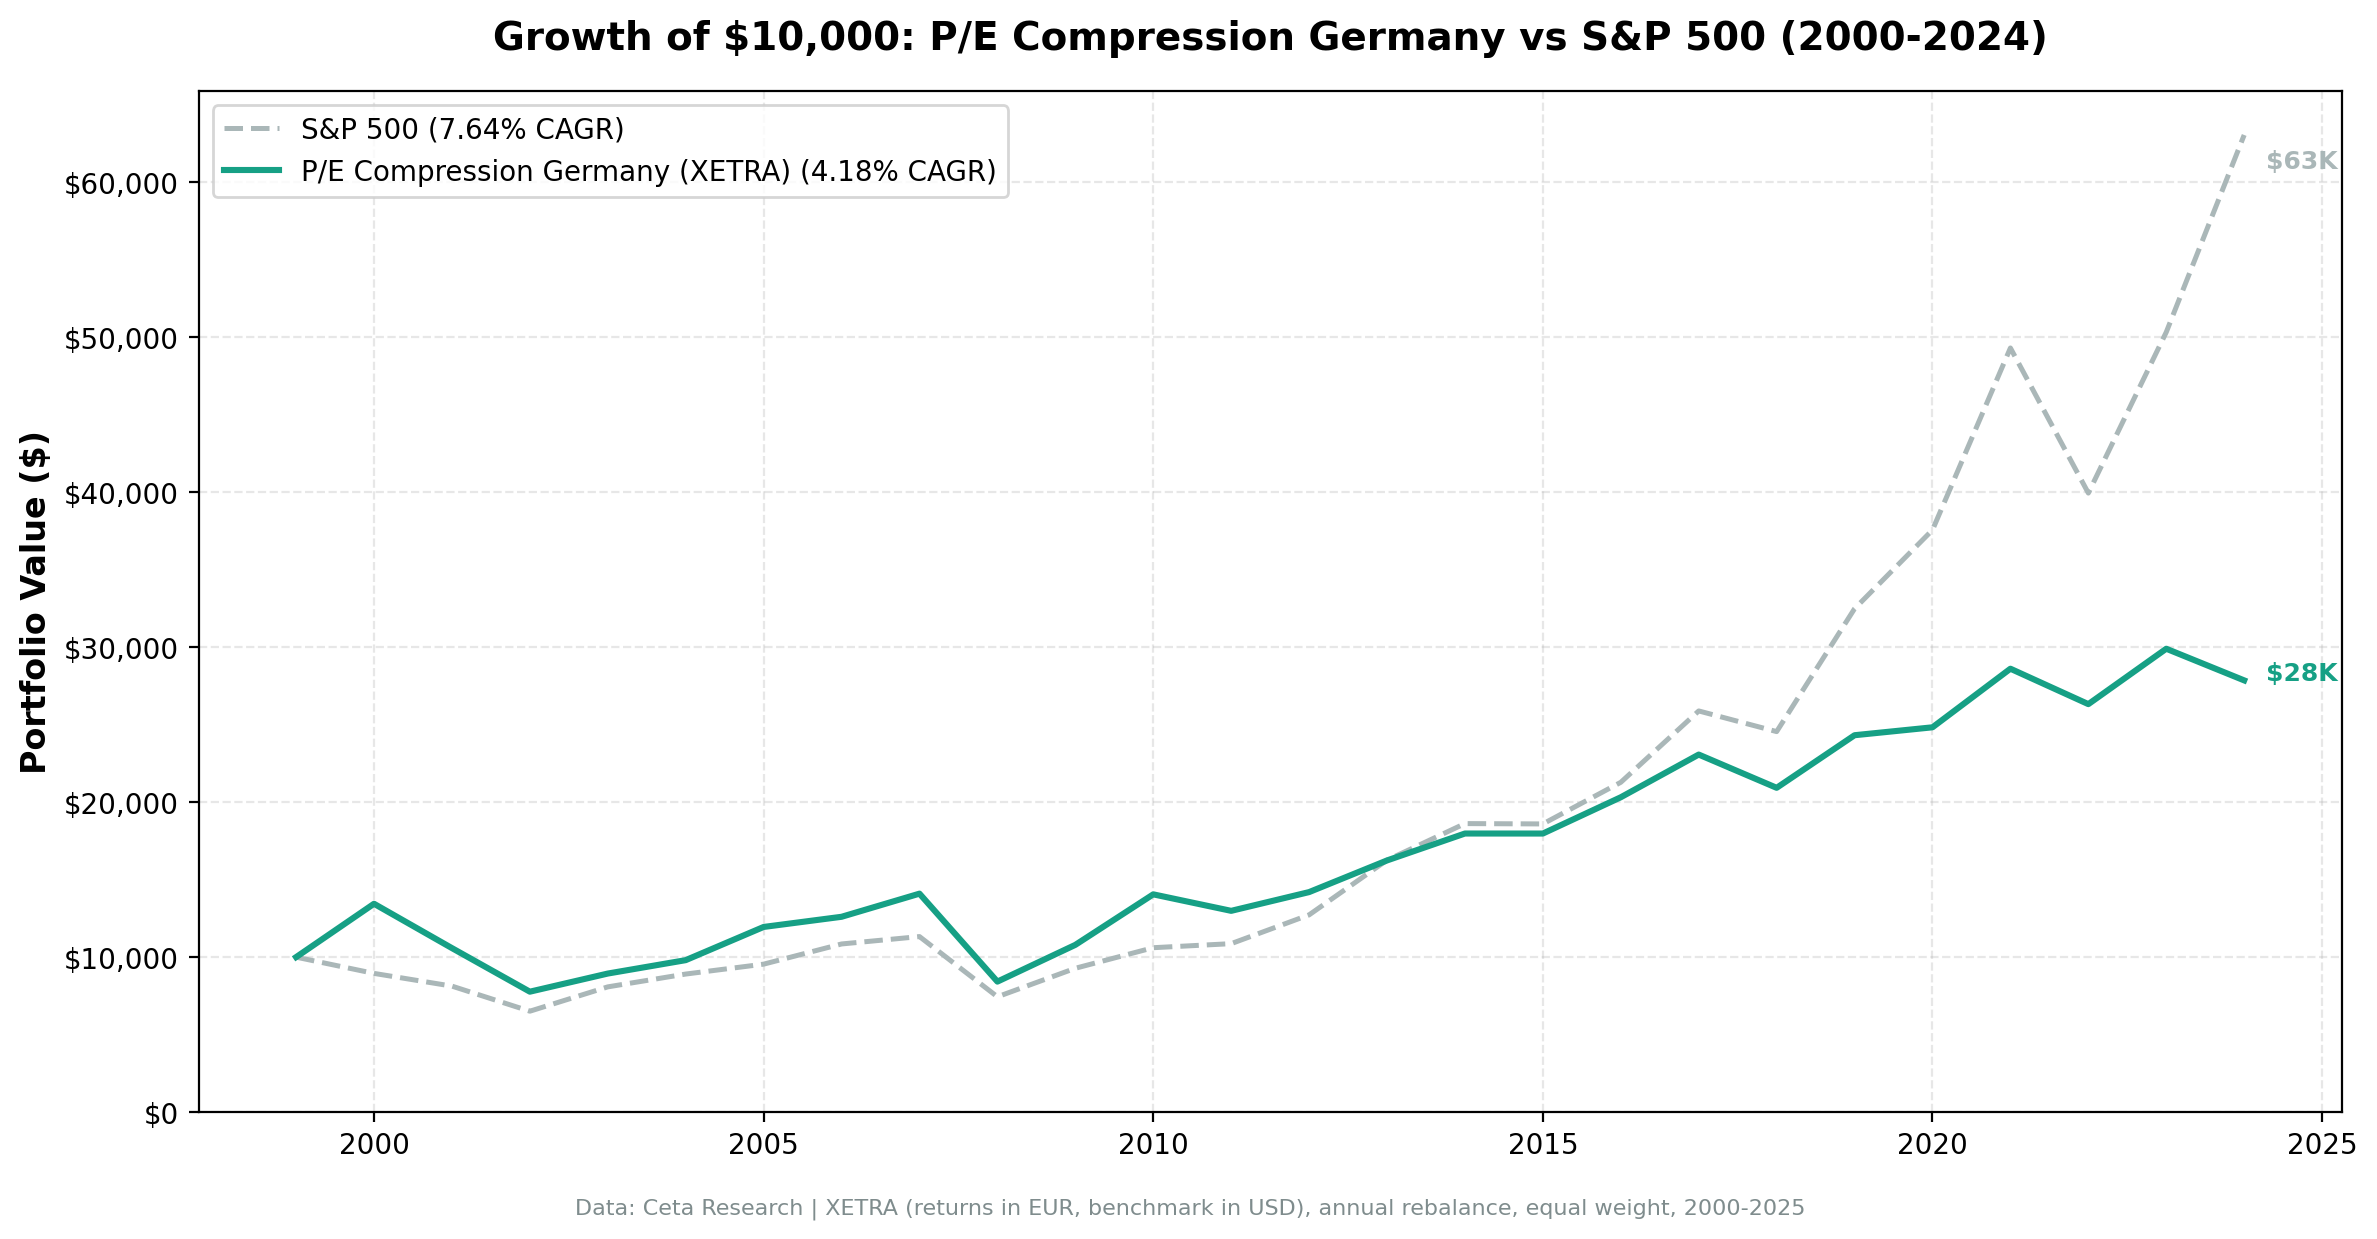
Germany P/E Compression: When Mean Reversion Doesn't Work (-3.46%)

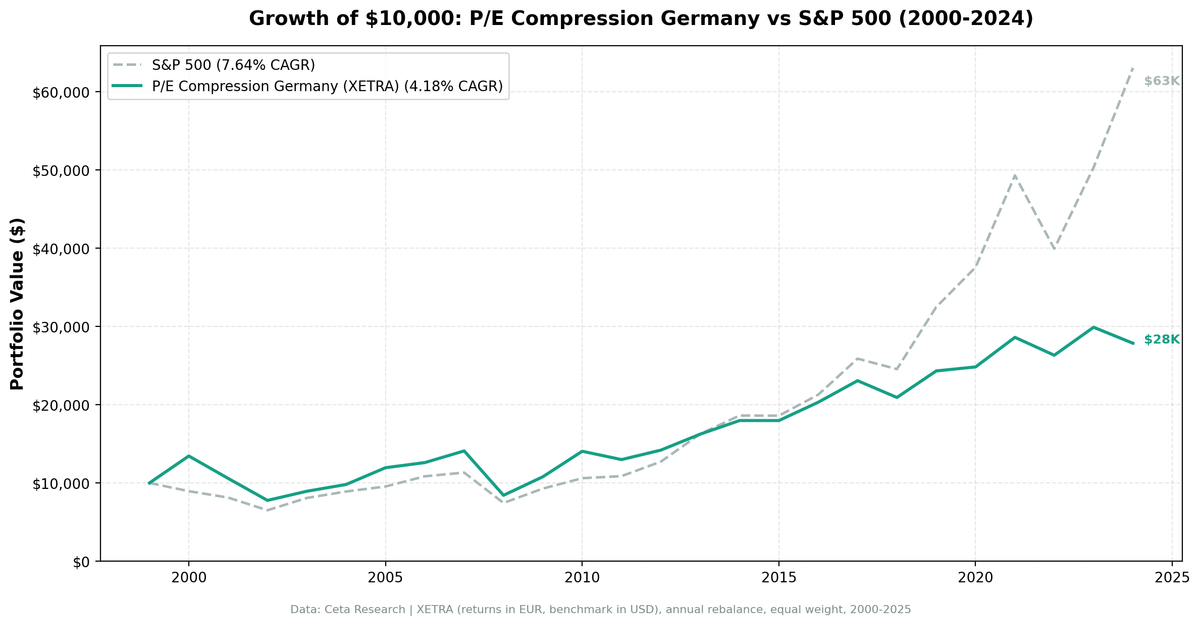
P/E compression on German stocks underperforms SPY by 3.46% annually. The strategy returned 4.18% (EUR-denominated) vs 7.64% for SPY. Despite zero cash periods and good diversification (19.7 stocks on average), the strategy failed. Compressed P/E ratios in Germany's export-driven economy often reflect genuine headwinds, not temporary undervaluation.
Contents
Method
- Universe: XETRA, market cap > €500M
- Period: 2000-2025 (25 years)
- Benchmark: S&P 500 Total Return (SPY, USD)
Returns in EUR. Benchmark in USD.
What We Found
| Metric | Germany | S&P 500 |
|---|---|---|
| CAGR | 4.18% | 7.64% |
| Excess | -3.46% | - |
| Sharpe | 0.123 | 0.322 |
| MaxDD | -42.21% | -34.90% |
| Down-Cap | 72.33% | 100% |
| Avg Stocks | 19.7 | - |
| Cash | 0/25 | - |
Zero cash periods mean the strategy always found qualifying stocks. But it still underperformed. The Sharpe ratio of 0.123 is terrible. Max drawdown of -42.21% exceeds SPY.
Why Germany Underperforms
German companies are heavily export-driven and cyclical. P/E compression often reflects real economic headwinds (eurozone crises, trade wars, energy shocks), not temporary sentiment. When a German industrial stock's P/E compresses, it's usually because earnings forecasts have dropped, not because the market overreacted.
Methodology
- Screen: P/E compression ratio below 0.85 (current P/E at least 15% below 5-year average)
- Quality filters: ROE above 10%, debt-to-equity below 2.0
- Rebalancing: Annual, equal-weight top 30 qualifying stocks
- Period: 25 years of out-of-sample data (2000-2025)
Zero cash periods mean the XETRA universe always produced enough qualifying stocks. The screen found plenty of compressed P/E stocks in Germany. They just didn't bounce back.
Run It Yourself
Screen German stocks with P/E compression filters on Ceta Research. Market cap threshold: EUR 500M, P/E compression ratio below 0.85, ROE above 10%, D/E below 2.0.
Part of a Series: US +2.32% | UK +1.38% | China -8.32% | India -3.50%
Conclusion
Germany's P/E compression strategy underperforms by 3.46% annually despite zero cash periods. The strategy doesn't work because compressed multiples reflect genuine economic risks in an export-driven, cyclical economy. Mean reversion requires stability. Germany doesn't provide it.
Run It Yourself
Explore the data behind this analysis on Ceta Research. Query our financial data warehouse with SQL, build custom screens, and run your own backtests across 70,000+ stocks on 20 exchanges.
Data: Ceta Research. Returns in EUR. github.com/ceta-research/backtests


