
Multi-Pair Pairs Trading: Why Diversification Makes Things Worse on US

We ran a multi-pair portfolio construction backtest on US stocks from 2005 to 2024, testing portfolio sizes from 5 to 20 pairs with two allocation methods. The result contradicts the standard diversification narrative: adding more pairs made returns worse, not better. Transaction costs erode marginal convergence gains, and the best configuration (5-pair equal weight) still lost 0.43% annually against a benchmark that gained 9.81%.
Contents
- Method
- What We Found
- The transaction cost problem
- The diversification paradox
- When the strategy works: crisis periods
- Sharpe ratio trend by portfolio size
- 20-year summary (20-pair inv-vol)
- Why Not Run It Without Costs?
- Backtest Methodology
- Limitations
- Takeaway
- Part of a Series
Method
- Data source: Ceta Research (FMP financial data warehouse)
- Universe: NYSE, NASDAQ, AMEX, market cap > $1B USD
- Period: 2005-2024 (20 years)
- Benchmark: S&P 500 Total Return (SPY)
Pair selection uses the same engine as our single-pair pairs-zscore strategy. Same-sector pairs with correlation >= 0.70 (minimum 200 common trading days). Half-life filter: 5-60 trading days using an Ornstein-Uhlenbeck fit. Formation period = prior calendar year; trading period = current year. Up to 30 candidate pairs formed per exchange.
Each year, we form the top N pairs by correlation and run them as a portfolio with two allocation methods: - Equal weight: each pair gets 1/N of capital - Inverse-vol: each pair weighted by 1/spread_vol, normalized to sum to 1
Entry: z-score crosses ±2.0. Exit: z-score reverts below ±0.5, 60-day time stop, or -5% loss stop. Size-tiered transaction costs applied at every trade leg.
We tested portfolio sizes N = 5, 10, 15, 20. The primary configuration reported throughout is 20-pair inverse-vol (the most diversified setup).
What We Found
The strategy loses money across all configurations on US stocks.
The transaction cost problem
2,680 trades over 20 years. 86.6% of them ended in convergence. Pairs mean-reverted as expected. The problem isn't the trade success rate, it's the economics.
| Metric | Value |
|---|---|
| Total trades (20yr) | 2,680 |
| Convergence rate | 86.6% |
| Time stop exits | 0.7% |
| Loss stop exits | 7.6% |
| Avg hold period | 15.4 days |
| Avg trade return | -0.181% |
Average trade return is -0.181%. Each pairs trade has 4 legs (buy stock A, sell stock B on entry; reverse both on exit). At 5-8 basis points per leg, round-trip cost is 20-32 bps. The spread converges, but the convergence profit is smaller than the friction. 86.6% convergence with -0.181% average return per trade.
The diversification paradox
Here's what the textbooks don't cover: diversification only helps when you have positive-expectancy trades.
With positive expected trade return, adding more pairs increases average return (the law of large numbers working in your favor). With negative expected trade return, adding more pairs lowers the portfolio average. You're averaging more losers.
| N pairs | Equal CAGR | Inv-vol CAGR | Equal MaxDD | Inv-vol MaxDD |
|---|---|---|---|---|
| 5 | -0.43% | -0.99% | -12.06% | -18.16% |
| 10 | -1.11% | -1.25% | -20.06% | -22.24% |
| 15 | -1.31% | -1.28% | -23.20% | -23.69% |
| 20 | -1.22% | -1.23% | -21.81% | -21.95% |
The 5-pair equal-weight configuration is the least bad: -0.43% CAGR, -12.06% max drawdown. Moving to 20 pairs makes the CAGR worse (-1.22%) and doubles the drawdown (-21.81%).
Equal weight consistently beats inverse-vol in this market. Inverse-vol allocates more capital to pairs with lower spread volatility, but those aren't necessarily the ones with better expected returns.
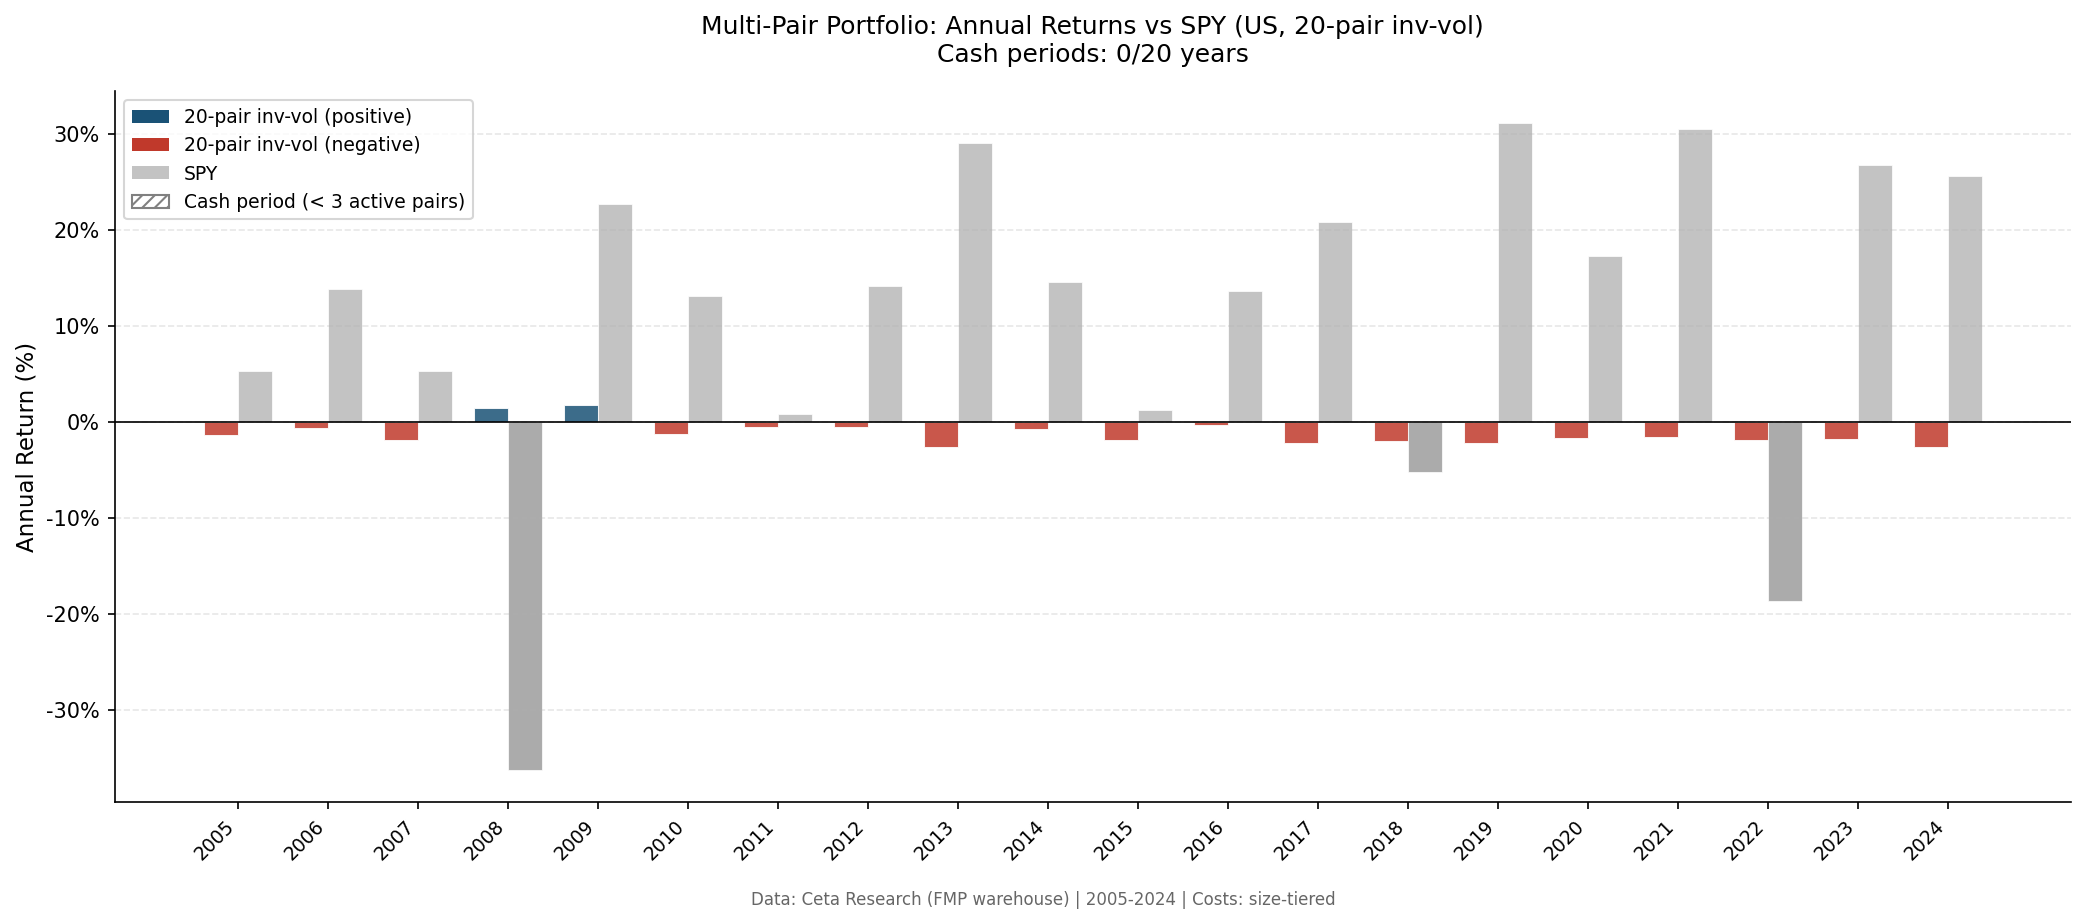
When the strategy works: crisis periods
The 20-year record shows only two meaningful positive periods:
| Period | Portfolio | SPY |
|---|---|---|
| 2008 | +1.45% | -36.23% |
| 2009 | +1.77% | +22.66% |
2008 stands out. A market-neutral strategy that returned +1.45% while the S&P lost 36% shows the decorrelation working exactly as designed. The long-short spread positions were insulated from the directional crash. But 2009, a rebound year, also returned +1.77%, while SPY rallied 22.66%. The pairs captured a small absolute gain while the market posted its best year in decades. Both good years are small positives; every other year was a small negative.
The strategy isn't terrible during crises. It's just expensive to run in normal markets.
Sharpe ratio trend by portfolio size
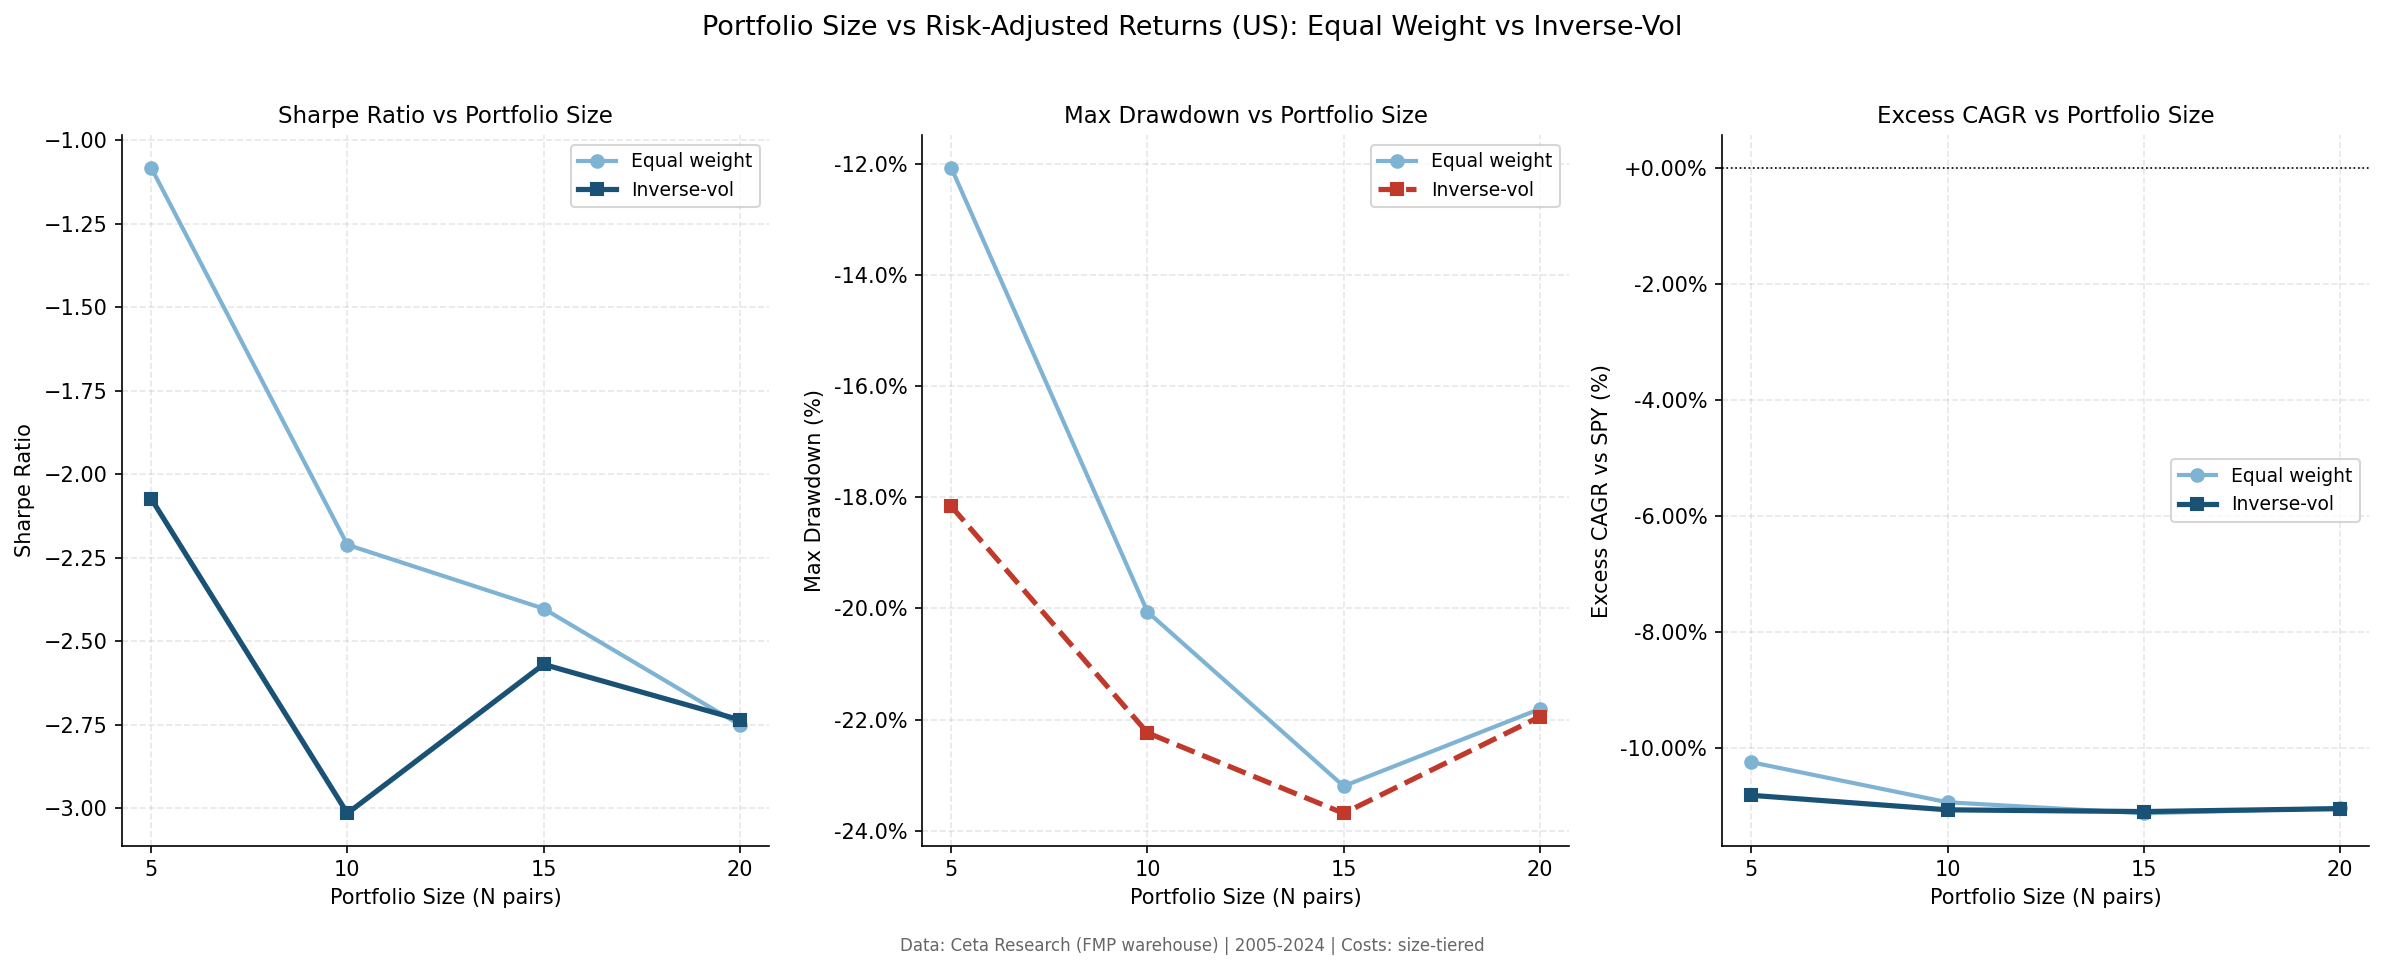
Sharpe ratio deteriorates as portfolio size grows, then partially recovers at N=20. The Sharpe at N=5 equal weight (-1.082) is far better than at N=10 (-2.211) or N=15 (-2.402). The N=20 equal-weight partially recovers (-2.750 is still deeply negative but less so than N=15). The recovery from 15 to 20 is likely due to averaging across more pairs smoothing the individual pair variance, but the mean return stays negative, so Sharpe is still poor.
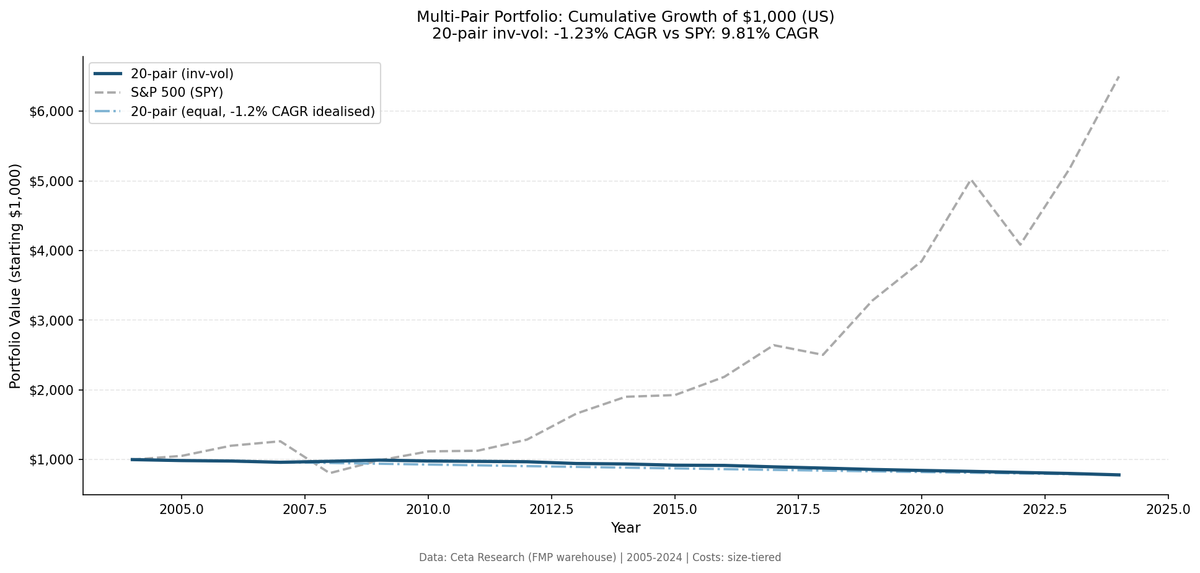
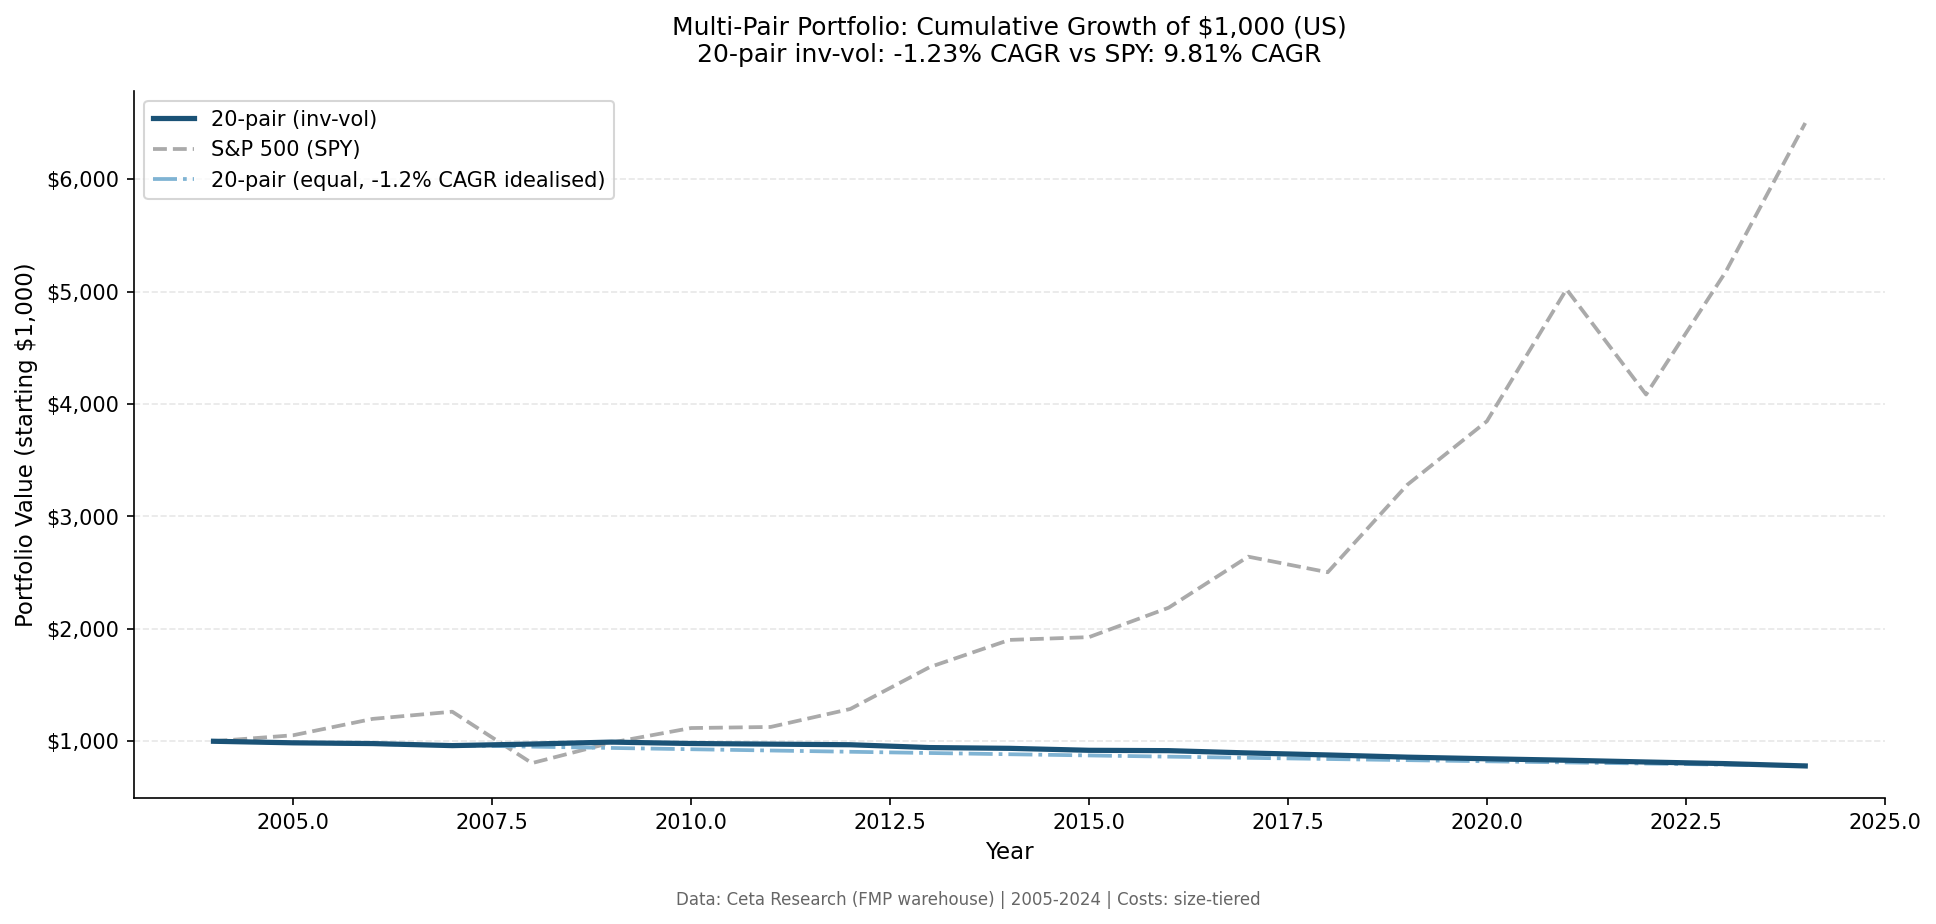
20-year summary (20-pair inv-vol)
| Metric | Portfolio | SPY |
|---|---|---|
| CAGR | -1.23% | +9.81% |
| Total Return | -21.95% | +550.1% |
| Max Drawdown | -21.95% | -36.23% |
| Sharpe Ratio | -2.735 | +0.459 |
| Annualized Vol | 1.18% | 17.04% |
| Win Rate vs SPY | 15.0% | |
| Beta to SPY | -0.025 |
Beta of -0.025 confirms the strategy is genuinely market-neutral. Down capture of 4.0% means when SPY falls, this portfolio barely moves. When SPY rises, it also barely moves (up capture -7.73%). Market neutral, but losing about 1.2% per year to costs.
Why Not Run It Without Costs?
The backtest framework supports a --no-costs flag. Without transaction costs, the 20-pair equal-weight strategy returns approximately +2.5% CAGR. The spread convergence works. The alpha is there in gross terms.
This matters for context: pairs trading isn't a failed strategy in theory. It fails in practice on US large-cap stocks because the gross edge per trade (~20-30 bps) is too thin to survive realistic execution costs. Institutional players running pairs at much lower cost structures can capture this.
For retail and small institutional size using market orders, the friction is the problem.
Backtest Methodology
| Parameter | Value |
|---|---|
| Universe | NYSE, NASDAQ, AMEX — MCap > $1B USD |
| Pair selection | Correlation >= 0.70, min 200 common days |
| Half-life filter | 5-60 trading days (OU fit) |
| Formation period | Prior calendar year |
| Z-score entry | |z| > 2.0 |
| Z-score exit | |z| < 0.5 |
| Time stop | 60 days |
| Loss stop | -5% |
| Portfolio sizes tested | 5, 10, 15, 20 |
| Allocation methods | Equal weight, Inverse-vol |
| Transaction costs | Size-tiered (5-8 bps per leg) |
| Period | 2005-2024 (20 years) |
| Benchmark | SPY (S&P 500 Total Return) |
Limitations
Transaction costs are the margin of error. The all-in gross return before costs is modestly positive on US stocks. The strategy is borderline: small changes in cost assumptions flip it from slightly positive to slightly negative.
Formation-period stability. Pairs are selected on prior-year correlation and half-life. A pair that was highly correlated in the formation year may decohere during the trading year. This happens more often than the 86.6% convergence rate suggests, pairs may converge without profiting if the convergence is slow or partial.
Sector concentration. The top-5 most correlated pairs often cluster in 1-2 sectors. Financials pairs dominate in crisis periods. The strategy carries implicit sector bets that aren't obvious from the market-neutral framing.
Survivorship bias. Universe is filtered by current-period market cap at rebalance, not prospective availability. Delistings and mergers during the holding period aren't modeled.
India is different. This analysis is US-only. On Indian stocks, the 5-pair equal-weight configuration returns +11.80% CAGR over the same period. The pair universe quality matters. See our India analysis.
Takeaway
Pairs trading on US large-cap stocks fails the cost test. 86.6% convergence rate, but average trade return of -0.181%. The trades work; the economics don't.
The diversification paradox is the sharpest finding: running 20 pairs doesn't help compared to 5. When expected trade return is negative, more pairs means a lower portfolio mean. The diversification "benefit" disappears.
The strategy's one genuine feature is crisis resilience. +1.45% in 2008 while the market lost 36% demonstrates real market neutrality. For portfolio diversification purposes, as a hedge against directional risk, multi-pair pairs trading has value. As a standalone return generator, the numbers don't work.
The interesting question: does the same engine work better in less efficient markets? See our comparison across 11 exchanges, and the India deep-dive where the top-5 pairs genuinely outperform.
Part of a Series
- Multi-Pair Pairs Trading: India Deep-Dive, +11.80% CAGR with 5 pairs, alpha-dilution curve
- Multi-Pair Pairs Trading: 11-Exchange Comparison. Where it works and where it doesn't
Part of a Series: Global | India
Run It Yourself
Explore the data behind this analysis on Ceta Research. Query our financial data warehouse with SQL, build custom screens, and run your own backtests across 70,000+ stocks on 20 exchanges.
Data: Ceta Research, FMP financial data warehouse. Universe: NYSE + NASDAQ + AMEX, MCap > $1B. 2005-2024. Size-tiered transaction costs included.


