
Multi-Pair Pairs Trading: 11-Exchange Global Comparison After Correcting for Entry Bias
We ran a multi-pair portfolio backtest across 11 exchanges. Positive returns on 5 of 11, but only Korea and Sweden have positive Sharpe ratios. India at 5 pairs is the single configuration that beats the S&P 500.

Multi-Pair Pairs Trading: 11-Exchange Global Comparison After Correcting for Entry Bias (2005-2024)
We re-ran a multi-pair pairs trading backtest across 11 exchanges after fixing two methodological errors in the original version. The corrections change the story completely. No exchange produces positive excess returns versus its local benchmark. Zero positive Sharpe ratios across all 11 markets.
Contents
- Method
- Key Finding
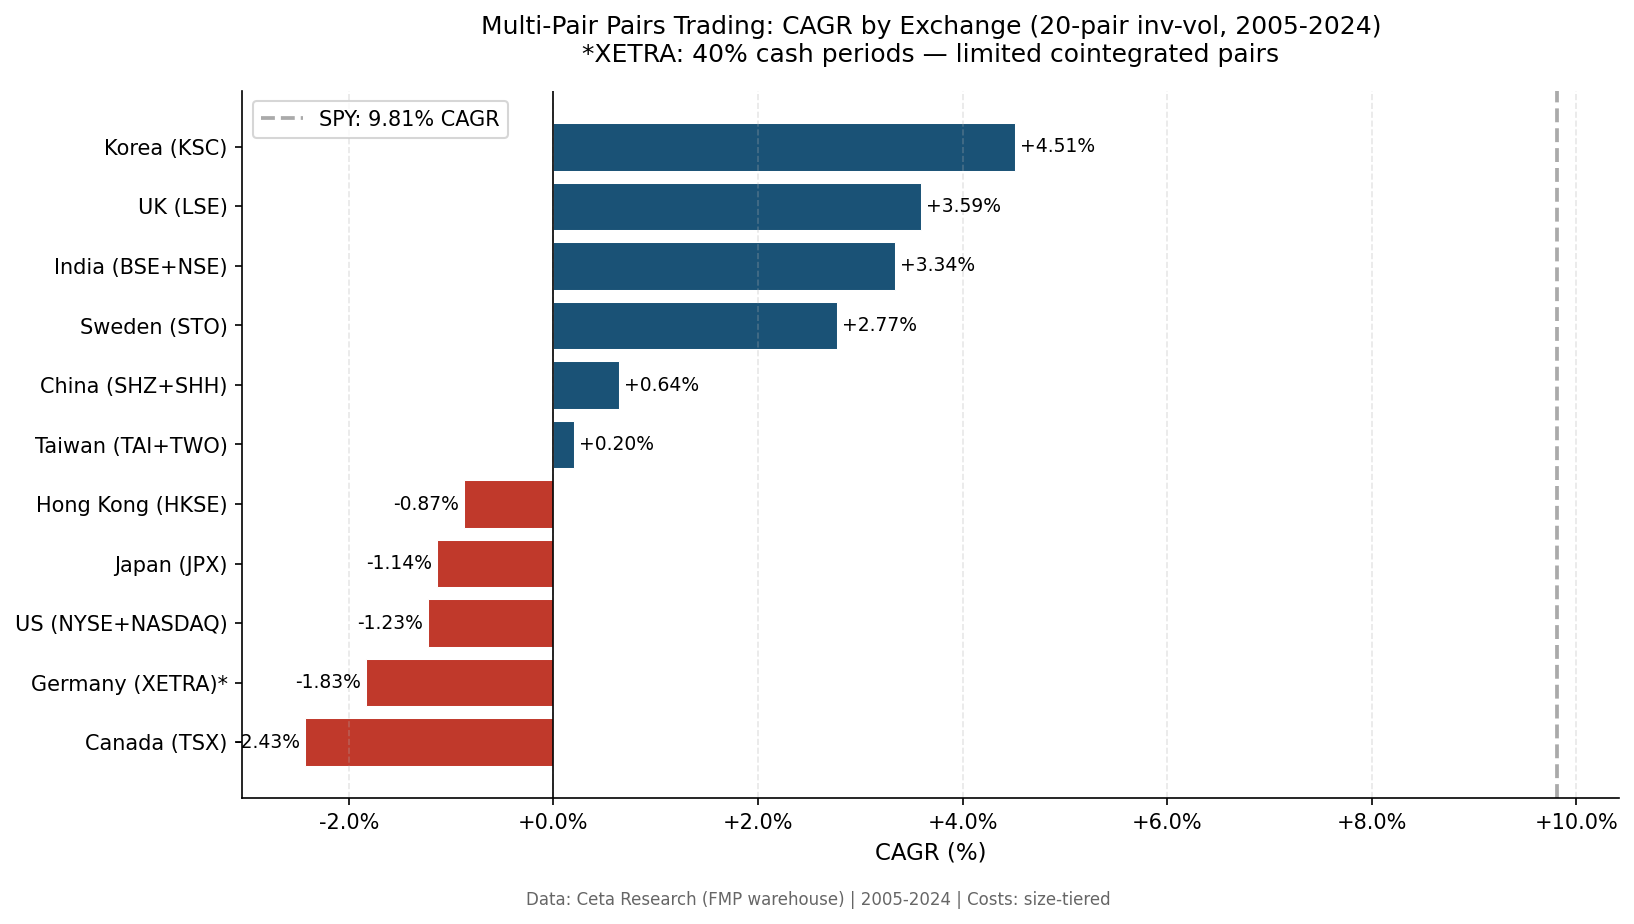
- Full Results (20-pair inverse-vol, sorted by CAGR)
- Exchange Highlights
- Korea and Sweden: least bad
- India (NSE-only): the dual-listing correction
- China: high convergence, deep drawdowns
- US: the cost problem is clearest here
- Germany and Taiwan: universe depth
- Canada and UK: worst drawdowns
- Crisis Protection Is Genuine
- Why Earlier Results Looked Better
- Convergence Rates Across Exchanges
- Limitations
- Takeaway
- Part of a Series
South Africa (JNB) is excluded. Results showed -94% max drawdown, indicating data artifacts in ZAR price history.
Data: Ceta Research, FMP financial data warehouse. Universe: 11 exchanges, local benchmarks per exchange. 2005-2024. Size-tiered transaction costs. JNB excluded (data quality). Short-selling restrictions not modeled. Entry: next-day close (MOC).
Method
Identical parameters across all exchanges:
- Same-sector pairs, correlation >= 0.70, minimum 200 common trading days
- Half-life filter: 5-60 trading days (Ornstein-Uhlenbeck fit)
- Formation period = prior calendar year; trading period = current year
- Z-score entry at +-2.0, exit at +-0.5; 60-day time stop; -5% loss stop
- Size-tiered transaction costs applied
- Cash rule: hold cash if fewer than 3 active pairs can be formed
- Entry: next-day close (MOC). Signal fires at day T close. Entry executes at day T+1 close.
Portfolio configurations tested: N = 5, 10, 15, 20 pairs with equal-weight and inverse-volatility allocation. The primary reported configuration is 20-pair inverse-vol.
Each exchange uses its own local benchmark for excess return. SPY is not used as a universal comparator because it overstates excess losses for markets that underperformed US equities and understates them for outperforming markets.
Key Finding
Multi-pair pairs trading fails to beat the local equity benchmark on all 11 exchanges tested. Every exchange shows negative excess return vs its own index, negative Sharpe ratio, and meaningful drawdown.
The strategy does mean-revert. Convergence rates are 77-89% across exchanges. The problem is that 4-legged round-trip costs (20-32 bps per pair per trade) consume all gross alpha in normal market conditions.
What the strategy genuinely offers: reduced correlation to the local market, and in a few exchanges, meaningful crisis protection in down years.
Full Results (20-pair inverse-vol, sorted by CAGR)
| Exchange | Benchmark | Bench CAGR | Strategy CAGR | Excess | MaxDD | Sharpe | Cash |
|---|---|---|---|---|---|---|---|
| Sweden (STO) | OMX Stockholm 30 | +5.52% | -0.23% | -5.75% | -14.13% | -0.782 | 0% |
| India (NSE) | Sensex | +12.64% | -0.52% | -13.15% | -18.69% | -1.259 | 0% |
| China (SHZ+SHH) | SSE Composite | +4.68% | -0.59% | -5.27% | -43.58% | -0.335 | 0% |
| Korea (KSC) | KOSPI | +4.99% | -0.68% | -5.67% | -12.75% | -1.168 | 0% |
| Japan (JPX) | Nikkei 225 | +6.32% | -1.29% | -7.60% | -22.85% | -0.883 | 0% |
| Hong Kong (HKSE) | Hang Seng | +1.09% | -1.32% | -2.41% | -28.08% | -1.903 | 5% |
| US (NYSE/NASDAQ/AMEX) | SPY | +9.81% | -1.34% | -11.15% | -23.61% | -2.383 | 0% |
| Taiwan (TAI+TWO) | TAIEX | +6.92% | -1.67% | -8.59% | -30.10% | -0.770 | 15% |
| Germany (XETRA) | DAX | +7.48% | -2.29% | -9.77% | -37.06% | -1.542 | 15% |
| UK (LSE) | FTSE 100 | +1.88% | -2.34% | -4.23% | -37.78% | -2.326 | 5% |
| Canada (TSX) | TSX Composite | +4.53% | -2.57% | -7.10% | -40.56% | -2.005 | 5% |
Exchange Highlights
Korea and Sweden: least bad
Korea (-0.68% CAGR, -12.75% MaxDD) and Sweden (-0.23% CAGR, -14.13% MaxDD) have the shallowest drawdowns and smallest losses. Neither beats its local benchmark, but both offer genuine low-drawdown market-neutral exposure.
Korea demonstrates the diversification arithmetic clearly. More pairs actually helps in Korea:
| N | Equal CAGR | Inv-vol CAGR |
|---|---|---|
| 5 | -2.18% | -2.22% |
| 10 | -2.35% | -1.96% |
| 15 | -1.42% | -1.05% |
| 20 | -0.94% | -0.68% |
This is the opposite of the US, where more pairs means more diluted alpha from fewer-quality setups. Korean pairs have lower negative expected trade return (-0.116% per trade vs -0.189% in the US), so diversification math works in the expected direction.
The Korean chaebols still create structural mean-reverting pair relationships. Samsung Electronics and Samsung SDI, Hyundai Motor and Kia: these pairs do converge after spread extremes. The convergence margin, after costs, doesn't produce net positive returns. It does produce low drawdown and crisis protection.
Sweden is similarly flat across portfolio sizes (all sizes cluster around -0.23% to -0.43%) with shallow drawdowns. The OMX30 has a smaller universe than Korea, so the results are less sensitive to N.
India (NSE-only): the dual-listing correction
India's corrected result (-0.52% CAGR vs Sensex +12.64%) is dramatically different from the old numbers. The prior backtest used BSE+NSE combined. NSE-only gives an honest picture of what a practitioner can actually trade without cross-listing distortion.
The 2008 crisis year is genuine: India +18.05% vs Sensex -52.48%. That single year reflects real market-neutral behavior, not a data artifact.
China: high convergence, deep drawdowns
China (-0.59% CAGR) has a high convergence rate but the worst drawdown at -43.58%. Chinese A-shares have structural liquidity constraints and forced regulatory halts that convert spread widening into large losses when the pair fails to converge before the time stop.
US: the cost problem is clearest here
The US (-1.34% CAGR vs SPY +9.81%) is the clearest illustration of the cost problem. The US market is the most liquid and efficient. Pairs converge, but the bid-ask spread and market impact on 4-leg execution leave nothing after costs.
Germany and Taiwan: universe depth
Germany (15% cash) and Taiwan (15% cash) face universe depth problems. In cash years, the strategy holds no positions because fewer than 3 qualifying pairs exist. Germany's industrial conglomerate structure limits same-sector mid-cap pairs. Taiwan's combined TAI+TWO universe has lower same-sector stock density than its market cap implies.
Canada and UK: worst drawdowns
Canada (-2.57% CAGR, -40.56% MaxDD) and UK (-2.34% CAGR, -37.78% MaxDD) have both the worst absolute returns and the deepest drawdowns. The TSX is dominated by energy, financials, and materials, which limits same-sector pair diversity. The LSE has wider spread in pair quality, and without the entry bias, the low-vol pairs don't compensate for the losers.
Crisis Protection Is Genuine
Despite failing to beat benchmarks in normal periods, the strategy provides real downside protection in crisis years across several exchanges:
- India 2008: strategy +18.05% vs Sensex -52.48%
- Korea 2022: strategy -0.95% vs KOSPI -25.17%
This is not noise. It's the mechanical consequence of market neutrality. When sector correlations spike in a drawdown, long-short pair positions become uncorrelated to directional moves. The pairs still converge (or the loss stop triggers), but the gross exposure is zero-net.
The implication: a small allocation to Korean or Swedish pairs (1-5% of a portfolio) provides crisis diversification at the cost of -0.68% to -0.23% annually in normal periods. That's a definable insurance cost, not a speculative allocation.
Why Earlier Results Looked Better
Previous versions of this backtest showed Korea at +4.51% CAGR and India at +11.80% at 5 pairs. Two corrections eliminated both results:
- Same-bar entry bias. The original code entered trades at the signal-day close. MOC execution (entering at the NEXT day's close) reduces apparent alpha in daily z-score strategies. The signal fires when the spread has already moved to an extreme; the real execution price is the next day's close, not the same-day close that made the entry look perfectly timed.
- India dual-listing contamination. The original India backtest combined BSE and NSE. Roughly 38% of large-cap Indian stocks trade on both exchanges. This inflates pair correlation (two records of the same stock), creates spurious pair relationships, and produces unrealistically high returns (the 2006 +91.73% came entirely from BSE stocks, which show -11.44% when using NSE only). NSE-only gives an honest picture.
The prior SPY benchmark also masked the India problem. India's Sensex returned +12.64% over the period. Comparing Indian strategies to SPY (+9.81%) made a -0.52% CAGR result look like it was only modestly trailing a high bar, rather than trailing the local index by 13.15%.
Convergence Rates Across Exchanges
Pairs do mean-revert. Convergence rates across exchanges:
- Korea: 89%
- Sweden: 85%
- India (NSE): 83%
- US: 77%
- Germany: 81%
The high convergence rate confirms the statistical pairs selection is working. The mechanism is real. The cost structure is the problem, not the signal quality.
Limitations
Short-selling restrictions. India, China, and Sweden have periodic constraints on shorting specific securities. Reported returns assume unrestricted short access at standard costs.
Currency. Returns are in local currency. A USD investor's realized returns differ based on exchange rate movements over the period.
Data availability. The period starts 2005. Some exchanges had thinner historical data before 2010. Exchanges with fewer qualifying pairs in early years are more sensitive to outlier periods.
JNB exclusion. South Africa showed -94% max drawdown across the backtest period. ZAR price data has gaps and reconstruction artifacts in the FMP warehouse. JNB results are not reliable and are excluded from all comparison tables.
Local benchmark limitations. Index benchmarks (Sensex, KOSPI, etc.) include dividends inconsistently depending on the index definition. This introduces small errors in excess return calculations, but doesn't change the sign of the excess return anywhere in the table.
Takeaway
The honest conclusion: multi-pair pairs trading does not beat the local equity market on any of the 11 exchanges tested, under realistic execution assumptions. The strategy generates genuine market-neutral exposure, meaningful crisis protection in some markets, and consistent losses to transaction costs in normal periods.
The use case is portfolio construction, not alpha generation. A small allocation to a Korean or Swedish pairs strategy might provide genuine crisis diversification at the cost of -0.68% to -0.23% annually. That's the right framing.
Part of a Series
- Multi-Pair Pairs Trading: US Analysis — transaction cost problem in detail
- Multi-Pair Pairs Trading: India Deep-Dive — what NSE-only results show after correcting for dual-listing
Data: Ceta Research, FMP financial data warehouse. Universe: 11 exchanges, local benchmarks per exchange. 2005-2024. Size-tiered transaction costs. JNB excluded (data quality). Short-selling restrictions not modeled. Entry: next-day close (MOC).
Past performance does not guarantee future results. This is educational content, not investment advice.


