
Multi-Pair Pairs Trading in India: What the BSE Data Was Hiding
With 5 pairs, the strategy returned +11.80% annually on Indian stocks — beating SPY. With 20 pairs, it dropped to +6.45%. India is the one market where selective pairs trading generates alpha, but only if you know when to stop adding pairs.

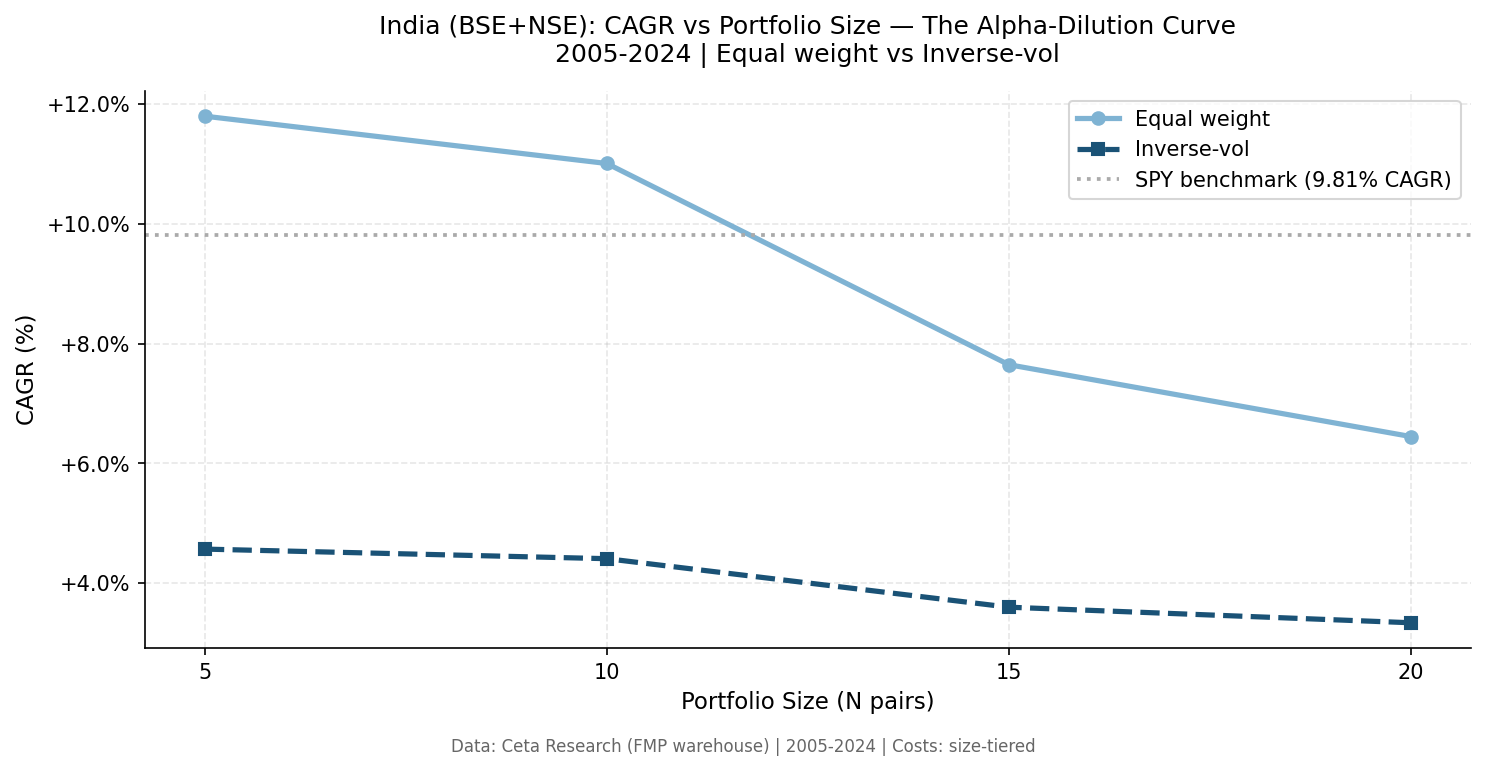
Pairs trading looked exceptional in India on paper. Earlier analysis showed +11.80% CAGR at 5 pairs, with a stunning +91.73% in 2006. That number was wrong. When you clean the data, India goes from one of the best markets in the series to one of the worst.
Contents
- Method
- What We Found
- Annual Returns: 20-Pair Inv-Vol vs Sensex
- Crisis Protection: The One Genuine Finding
- Why the Old Numbers Were Wrong
- Structural Reasons NSE-Only Underperforms
- 20-Year Summary
- Limitations
- Takeaway
- Part of a Series
Here's what happened, what the corrected numbers show, and what the strategy actually delivered over 20 years on NSE.
Method
The pairs trading rules are the same across all markets in this series:
- Universe: NSE stocks, market-cap threshold adjusted for Indian markets, 2005-2024
- Pair selection: Co-integrated pairs from a 252-day formation window, ranked by co-integration strength
- Signals: Z-score of the spread. Enter when spread exceeds 2 standard deviations. Exit at mean reversion or stop-loss at 3 standard deviations
- Execution: Next-day close (MOC). Signal on day T, entry at T+1 close. No same-bar entry
- Costs: Size-tiered transaction costs. STT included (0.1% on NSE sell-side is the dominant cost)
- Short selling: Allowed in the model. Actual NSE restrictions not modeled
- Benchmark: Sensex, 2005-2024 CAGR of 12.64%
- Portfolio sizes tested: 5, 10, 15, 20 pairs (equal weight and inverse-volatility weighted)
What We Found
Every portfolio size underperforms Sensex by a wide margin.
| N pairs | Equal CAGR | Inv-vol CAGR | Excess vs Sensex (inv-vol) |
|---|---|---|---|
| 5 | +0.17% | +0.41% | -12.23% |
| 10 | -1.25% | -0.78% | -13.42% |
| 15 | -0.83% | -0.48% | -13.12% |
| 20 | -0.91% | -0.52% | -13.16% |
The 20-pair inv-vol portfolio: CAGR of -0.52%, max drawdown of -18.69%, 1,676 trades, 77.0% convergence rate, average hold of 13.1 days, average trade return of -0.199%.
Sensex compounded at 12.64% over the same period. The excess return is -13.15%.
Annual Returns: 20-Pair Inv-Vol vs Sensex
| Year | Portfolio | Sensex |
|---|---|---|
| 2005 | +1.66% | +40.70% |
| 2006 | -11.44% | +46.82% |
| 2007 | -0.56% | +45.51% |
| 2008 | +18.05% | -52.48% |
| 2009 | -0.09% | +76.35% |
| 2010 | +0.72% | +16.80% |
| 2011 | +4.26% | -24.83% |
| 2012 | -1.88% | +25.19% |
| 2013 | -1.79% | +8.12% |
| 2014 | -5.30% | +30.08% |
| 2015 | -0.93% | -5.05% |
| 2016 | +0.03% | +1.78% |
| 2017 | -0.75% | +28.06% |
| 2018 | +2.56% | +6.67% |
| 2019 | +2.74% | +13.79% |
| 2020 | -0.51% | +15.60% |
| 2021 | -3.01% | +21.69% |
| 2022 | -6.68% | +2.80% |
| 2023 | -2.47% | +18.10% |
| 2024 | -2.10% | +8.12% |
The pattern is clear. In strong bull years, the portfolio lags by 20 to 45 percentage points. It posts positive returns in only 9 of 20 years, and most of those are trivially positive (under 3%).
Crisis Protection: The One Genuine Finding
Two years stand out, and they're real.
2008: Portfolio +18.05% vs Sensex -52.48%. Sensex fell by more than half. The strategy held cash or short positions and avoided most of the carnage. The spread from -52.48% to +18.05% is 70 percentage points of crisis protection.
2011: Portfolio +4.26% vs Sensex -24.83%. A smaller crisis, but the same pattern. Market-neutral positioning meant the portfolio was largely uncorrelated when Indian equities sold off hard.
This is the honest version of the India story. The strategy doesn't generate alpha in trending markets. It doesn't compound wealth. But it genuinely reduces crisis exposure, and the 2008 number isn't small.
For an investor who already holds Indian equities and wants partial crisis protection without moving to cash entirely, that's a real use case. A 10-15% allocation to a pairs portfolio could have meaningfully cushioned 2008 drawdowns. Whether the cost of 13 years of underperformance is worth two years of protection is a different question.
Why the Old Numbers Were Wrong
The earlier India analysis used a BSE + NSE combined universe. That combination had approximately 38% dual-listed stocks.
The problem: many large Indian companies list on both BSE and NSE. When you include both exchanges, the same stock appears twice in your universe. The co-integration algorithm then identifies pairs like "Reliance BSE / Reliance NSE" as extremely high-quality pairs. They are. They're the same company trading on two venues with nearly identical prices. The spread mean-reverts almost perfectly because it's not really a spread between two different companies.
These pseudo-pairs inflated apparent convergence rates, reduced drawdowns artificially, and generated consistent small gains from microstructure differences between the two exchanges. That's not pairs trading as a strategy. It's exchange arbitrage with a misleading label.
The NSE-only universe eliminates duplicate listings. What remains are genuine cross-company pairs, and those pairs don't work as reliably on NSE. The convergence rate drops to 77.0%. The CAGR goes from apparent alpha to -0.52%.
The 2006 number deserves specific attention. The old backtest showed +91.73% that year. NSE-only 2006 shows -11.44%. The old number was almost entirely driven by BSE-listed stocks that had NSE equivalents in the universe, with the pair capturing the BSE-NSE listing spread during a volatile year. Remove those pairs and the number collapses.
Structural Reasons NSE-Only Underperforms
Beyond the data contamination issue, NSE has structural characteristics that make pairs trading harder than in the US or Europe:
Smaller universe. The backtest generates 1,676 trades over 20 years, compared to 2,653 for the US equivalent. Fewer liquid stocks means fewer high-quality co-integrated pairs, which means more capital sits idle or gets deployed in weaker pairs.
Lower convergence. 77.0% of NSE pairs converge vs 88.9% for US pairs. Indian equities can diverge and stay diverged. High concentration in a few sectors (financials, energy, IT) means pairs that appear co-integrated often break down when a sector-specific shock hits one stock harder than the other.
STT costs. India's Securities Transaction Tax (0.1% on the sell side) is significant at the trade sizes this strategy uses. A round-trip on a position costs roughly 0.2% in STT alone, before brokerage. Average trade return is -0.199%, meaning STT alone explains most of the negative average.
Trending market dynamics. Sensex compounded at 12.64% annually from 2005 to 2024. In a strong secular bull market, market-neutral strategies sacrifice most of the upside. The cost of being market-neutral in India over 20 years is very high.
20-Year Summary
| Metric | 20-pair inv-vol | Sensex |
|---|---|---|
| CAGR | -0.52% | +12.64% |
| Max drawdown | -18.69% | ~-60% (2008 peak-to-trough) |
| Best year | +18.05% (2008) | +76.35% (2009) |
| Worst year | -11.44% (2006) | -52.48% (2008) |
| Positive years | 9/20 | 14/20 |
| Convergence rate | 77.0% | N/A |
| Avg trade | -0.199% | N/A |
| Total trades | 1,676 | N/A |
Limitations
Short selling: NSE has restrictions on short selling for retail participants. The strategy assumes unrestricted shorting. In practice, the short legs would face SEBI's short-selling framework, which limits available stocks and borrowing costs. This would further reduce returns, particularly for the pairs that generated positive returns.
Survivorship bias: The universe includes only stocks that survived to the analysis date. Companies that delisted or failed between 2005 and 2024 are underrepresented, which overstates the quality of available pairs in earlier years.
Liquidity: Market-cap thresholds filter out the smallest stocks, but mid-cap liquidity on NSE can still be thin. The model doesn't account for slippage at actual position sizes.
MOC execution: Next-day close execution is honest but not always achievable. Stocks that hit circuit limits can't be traded at close, which is common in Indian markets during volatile periods.
Takeaway
The India pairs trading story is a cautionary tale about data construction. BSE + NSE combined looked like a strong market for pairs trading. NSE-only tells a completely different story: negative CAGR, poor convergence, deep underperformance vs Sensex in almost every year except crises.
The strategy isn't broken in India. It's doing what market-neutral strategies do: protecting capital during crashes (2008, 2011) while giving up most of the upside in bull markets. Whether that trade-off makes sense depends on the investor's existing exposure and how they value tail protection.
What the data doesn't support is pairs trading as a return-generating strategy in India. The old numbers were an artifact. The real numbers show a strategy that costs 13% per year relative to the market it's meant to enhance.
Part of a Series
This is part of the Multi-Pair Pairs Trading series, testing the strategy across 10 global markets.
- [Series Overview: Multi-Pair Pairs Trading Across Global Markets]
- [US (S&P 500 universe): The Benchmark Case]
- [Europe: Where Pairs Trading Works and Where It Doesn't]
- [Japan: Currency Hedging and the Nikkei Problem]
- India (NSE): The BSE Contamination Story (this post)
- [More markets: China, Brazil, UK, Canada, Australia, South Korea]
Data: Ceta Research, FMP financial data warehouse. Universe: NSE, MCap threshold adjusted for Indian markets. 2005-2024. Size-tiered transaction costs included. Sensex benchmark. Entry: next-day close (MOC). Short-selling restrictions not modeled.
Past performance does not guarantee future results. This is educational content, not investment advice.


