
Earnings Surprise Drift in the UK: Misses Collapse, Beats Barely Move

UK earnings beats produce just +0.22% cumulative abnormal return at T+63. Misses produce -2.14%. The Q5-Q1 spread of +3.99% exists, but it's almost entirely driven by what happens to companies that miss estimates. The UK PEAD signal is structurally a miss-avoidance signal. If you're thinking about implementing PEAD on LSE stocks, the actionable edge is on the short side, not the long side.
Contents
- Method
- The Strategy
- What We Found
- Positive vs Negative Surprise Drift
- Quintile Analysis at T+63
- UK in Global Context
- When It Works and When It Struggles
- Run It Yourself
- Limitations
- Part of a Series
- References
Method
| Parameter | Details |
|---|---|
| Data source | FMP earnings_surprises + stock_eod (Ceta Research warehouse) |
| Universe | LSE — market cap threshold applied per exchange |
| Period | 2000–2025 (26 years) |
| Events | 12,648 total (deduplicated per symbol/date) |
| Benchmark | Equal-weighted LSE market return |
| Surprise metric | (epsActual − epsEstimated) / ABS(epsEstimated) |
| Windows | T+1, T+5, T+21, T+63 trading days |
The Strategy
Post-Earnings Announcement Drift (PEAD) is one of the most replicated anomalies in financial markets. Ball and Brown (1968) first documented that stocks continue drifting in the direction of their earnings surprise for weeks after announcement. Bernard and Thomas (1989) confirmed the drift persists for up to 60 trading days. Foster, Olsen, and Shevlin (1984) extended the analysis across different earnings windows.
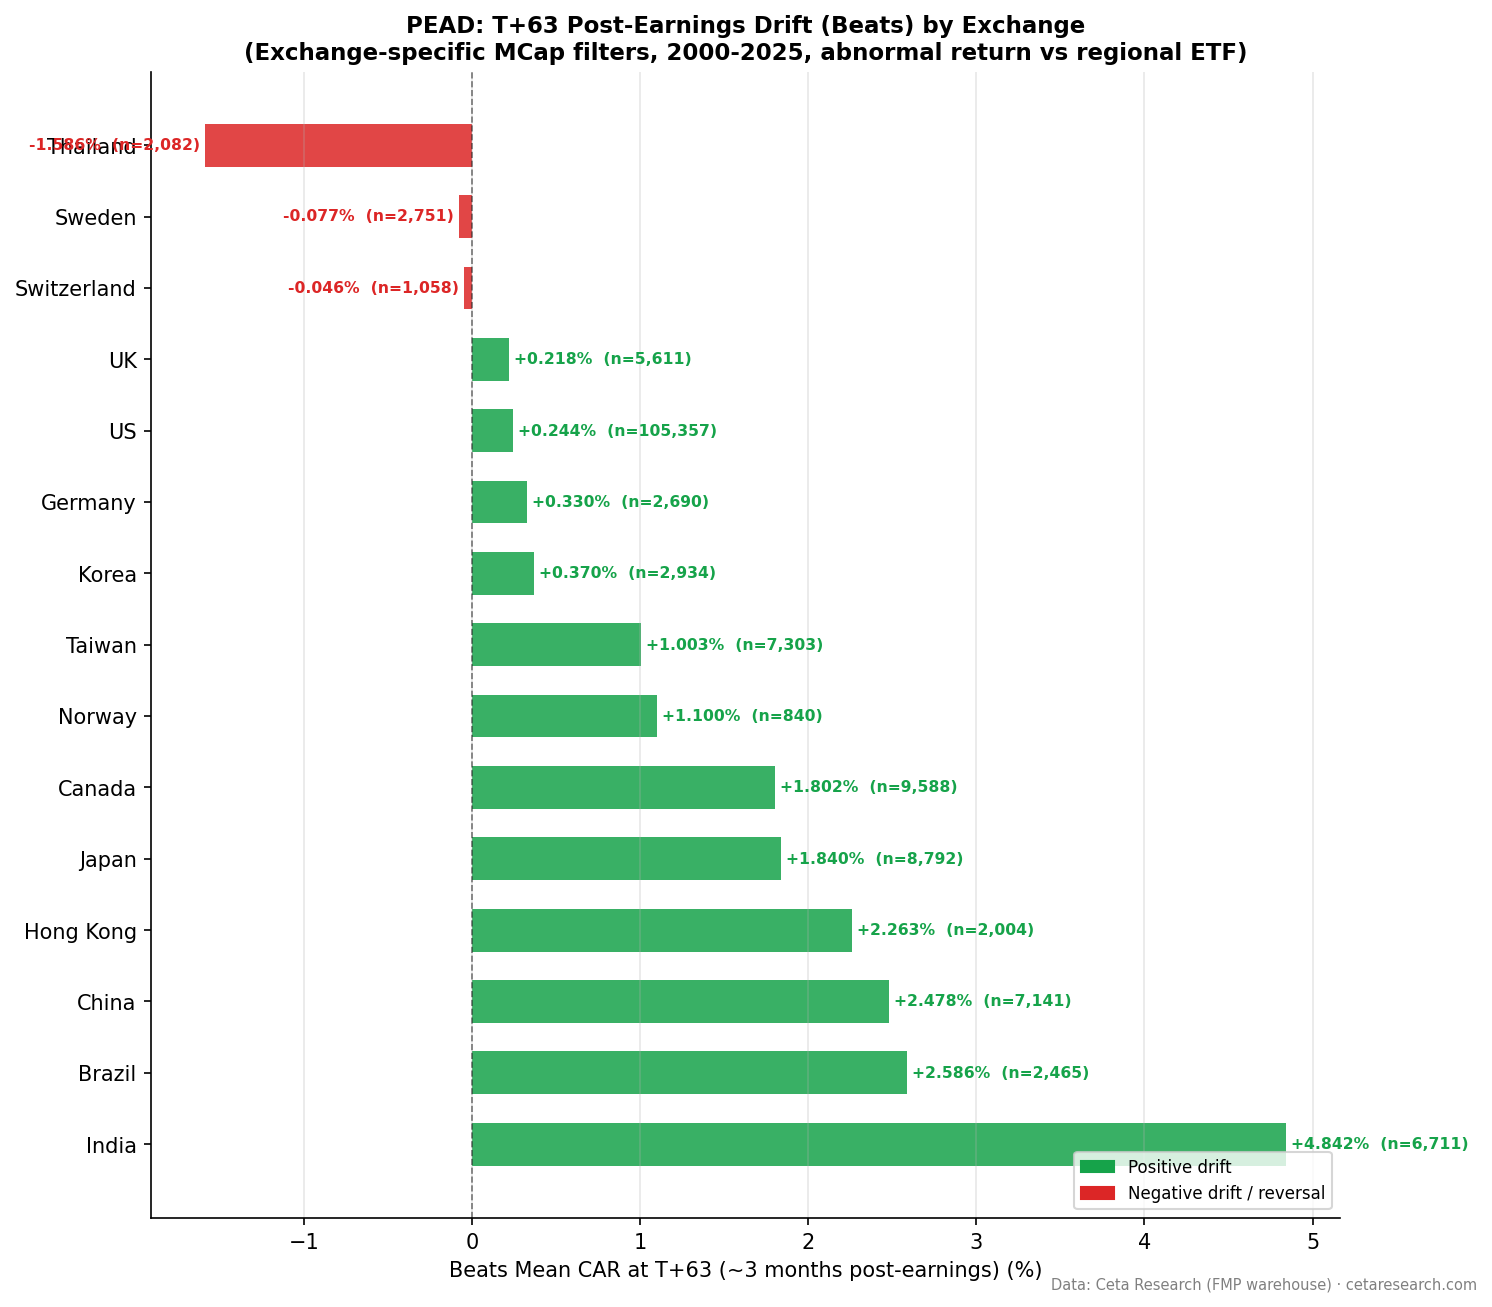
In the US, both sides of the drift are meaningful but asymmetric: misses drift further (-2.00% at T+63) than beats (+0.24%). The UK presents a more extreme version of this asymmetry. Beat drift nearly disappears. Miss drift is strong.
What We Found
Positive vs Negative Surprise Drift
| Direction | Events | Beat% | T+1 | T+5 | T+21 | T+63 |
|---|---|---|---|---|---|---|
| Positive surprises | 5,611 | 44.4% | +0.38% | +0.58% | +0.58% | +0.22% |
| Negative surprises | 7,037 | 55.6% | -0.32% | -0.37% | -0.76% | -2.14% |
The UK beat rate is 44.4%. More companies miss than beat. The positive surprise drift is minimal: +0.38% at T+1, which peaks at +0.58% by T+5 and T+21, then gives back most of that gain by T+63 (+0.22%). The drift doesn't build. It largely fades.
The negative surprise pattern is different. The drift is slow at first (-0.32% at T+1, -0.37% at T+5) and then accelerates dramatically. By T+21 it's -0.76%, and by T+63 it reaches -2.14%. This late-accelerating negative drift is the dominant feature of UK PEAD.
Quintile Analysis at T+63
| Quintile | Description | Events | CAR T+63 | t-stat | Hit Rate |
|---|---|---|---|---|---|
| Q5 | Biggest beats | 2,360 | +1.21% | +3.1 | 50.6% |
| Q4 | Moderate beats | — | -0.10% | — | — |
| Q3 | Near-consensus | — | -1.28% | — | — |
| Q2 | Moderate misses | — | -2.34% | — | — |
| Q1 | Worst misses | 2,373 | -2.78% | -6.6 | 41.5% |
The Q5-Q1 spread is +3.99% at T+63. Q1 misses (t=-6.6) drive the spread. Q5 is statistically significant (t=3.1) but modest at +1.21%, and the hit rate is just 50.6%, meaning a coin flip on individual Q5 events.
The quintile distribution tells a stark story. Q4 (moderate beats) produces -0.10% at T+63. Even modest beats in the UK don't sustain positive drift. Q3 (near-consensus) produces -1.28%. Q2 (moderate misses) produces -2.34%. The entire distribution is shifted negative relative to the benchmark. Only Q5 breaks into positive territory, and just barely.
This structure implies that UK earnings beats are systematically followed by mean reversion after an initial positive reaction, while misses compound. The market prices in positive earnings news quickly and then moves on. Negative news takes much longer to fully digest.
UK in Global Context
| Metric | UK | US | Germany |
|---|---|---|---|
| Beat rate | 44.4% | 61.9% | — |
| Q5 CAR T+63 | +1.21% | +1.05% | — |
| Q1 CAR T+63 | -2.78% | -2.67% | — |
| Positive surprise T+63 | +0.22% | +0.24% | — |
| Negative surprise T+63 | -2.14% | -2.00% | — |
The UK and US show similar Q5 and Q1 figures despite the very different beat rate (44.4% vs 61.9%). The miss-side magnitudes are nearly identical. The main difference is that the UK has a lower beat rate and essentially zero long-run positive surprise drift.
When It Works and When It Struggles
The late-accelerating negative drift is the defining feature. The sharpest negative move happens between T+21 and T+63. If you're implementing a short-side PEAD strategy in the UK, the full 63-day holding period captures far more edge than a shorter window.
The beat side is nearly flat over the long run (+0.22%). This doesn't mean there's zero reaction to positive surprises. There's a T+1 reaction (+0.38%) and a brief continuation to T+5 (+0.58%). But by T+63 most of the gain has eroded. UK-listed companies that beat estimates in one quarter often see analysts raise expectations, which reduces the comparative beat in subsequent quarters. The "beat and raise" dynamic compresses the sustained positive drift.
UK companies tend to report results less frequently than US companies, with many on semi-annual or irregular reporting schedules. Lower reporting frequency can affect the T+63 window, which may overlap with subsequent reporting for some stocks.
Run It Yourself
python3 earnings-surprise/screen.py --preset uk
-- Recent earnings surprises on LSE
WITH deduped AS (
 SELECT
 es.symbol,
 es.date,
 es.epsActual,
 es.epsEstimated,
 (es.epsActual - es.epsEstimated) / NULLIF(ABS(es.epsEstimated), 0) AS std_surprise,
 ROW_NUMBER() OVER (PARTITION BY es.symbol, es.date ORDER BY es.lastUpdated DESC) AS rn
 FROM earnings_surprises es
 JOIN profile p ON es.symbol = p.symbol
 WHERE p.exchange = 'LSE'
 AND p.isActivelyTrading = true
 AND es.date >= CURRENT_DATE - INTERVAL '90 days'
 AND ABS(es.epsEstimated) > 0.01
)
SELECT
 symbol,
 date,
 epsActual,
 epsEstimated,
 ROUND(std_surprise * 100, 1) AS surprise_pct
FROM deduped
WHERE rn = 1
 AND ABS(std_surprise) > 0.10
ORDER BY date DESC, std_surprise ASC
LIMIT 50
Run this query on Ceta Research →
Limitations
12,648 events is the smallest sample among the larger developed markets in this study. Q5 and Q1 each have roughly 2,360–2,373 events, which is adequate for statistical analysis but smaller than equivalent quintiles for the US or Japan.
UK reporting calendars are less standardized than US quarterly reporting. A portion of UK companies report on a six-month cycle, which means the T+63 window can overlap with subsequent earnings for some companies. This could either amplify or dampen the measured drift depending on whether subsequent results reinforce the initial surprise.
Short-side PEAD strategies in the UK require access to stock borrow and face borrowing costs. The measured -2.78% Q1 drift at T+63 is gross of borrowing costs, which can run 1–3% annually for smaller LSE names.
Part of a Series
- PEAD Across 14 Global Exchanges: The Drift Is Universal
- Earnings Surprise Drift on US Stocks: 170,000 Events, 26 Years
References
- Ball, R. & Brown, P. (1968). An empirical evaluation of accounting income numbers. Journal of Accounting Research.
- Bernard, V. & Thomas, J. (1989). Post-earnings-announcement drift: Delayed price response or risk premium? Journal of Accounting Research.
- Foster, G., Olsen, C. & Shevlin, T. (1984). Earnings releases, anomalies, and the behavior of security returns. The Accounting Review.
Run It Yourself
Explore the data behind this analysis on Ceta Research. Query our financial data warehouse with SQL, build custom screens, and run your own backtests across 70,000+ stocks on 20 exchanges.
Data: Ceta Research, FMP financial data warehouse


