
Earnings Surprise Drift in Thailand: Only the Misses Signal

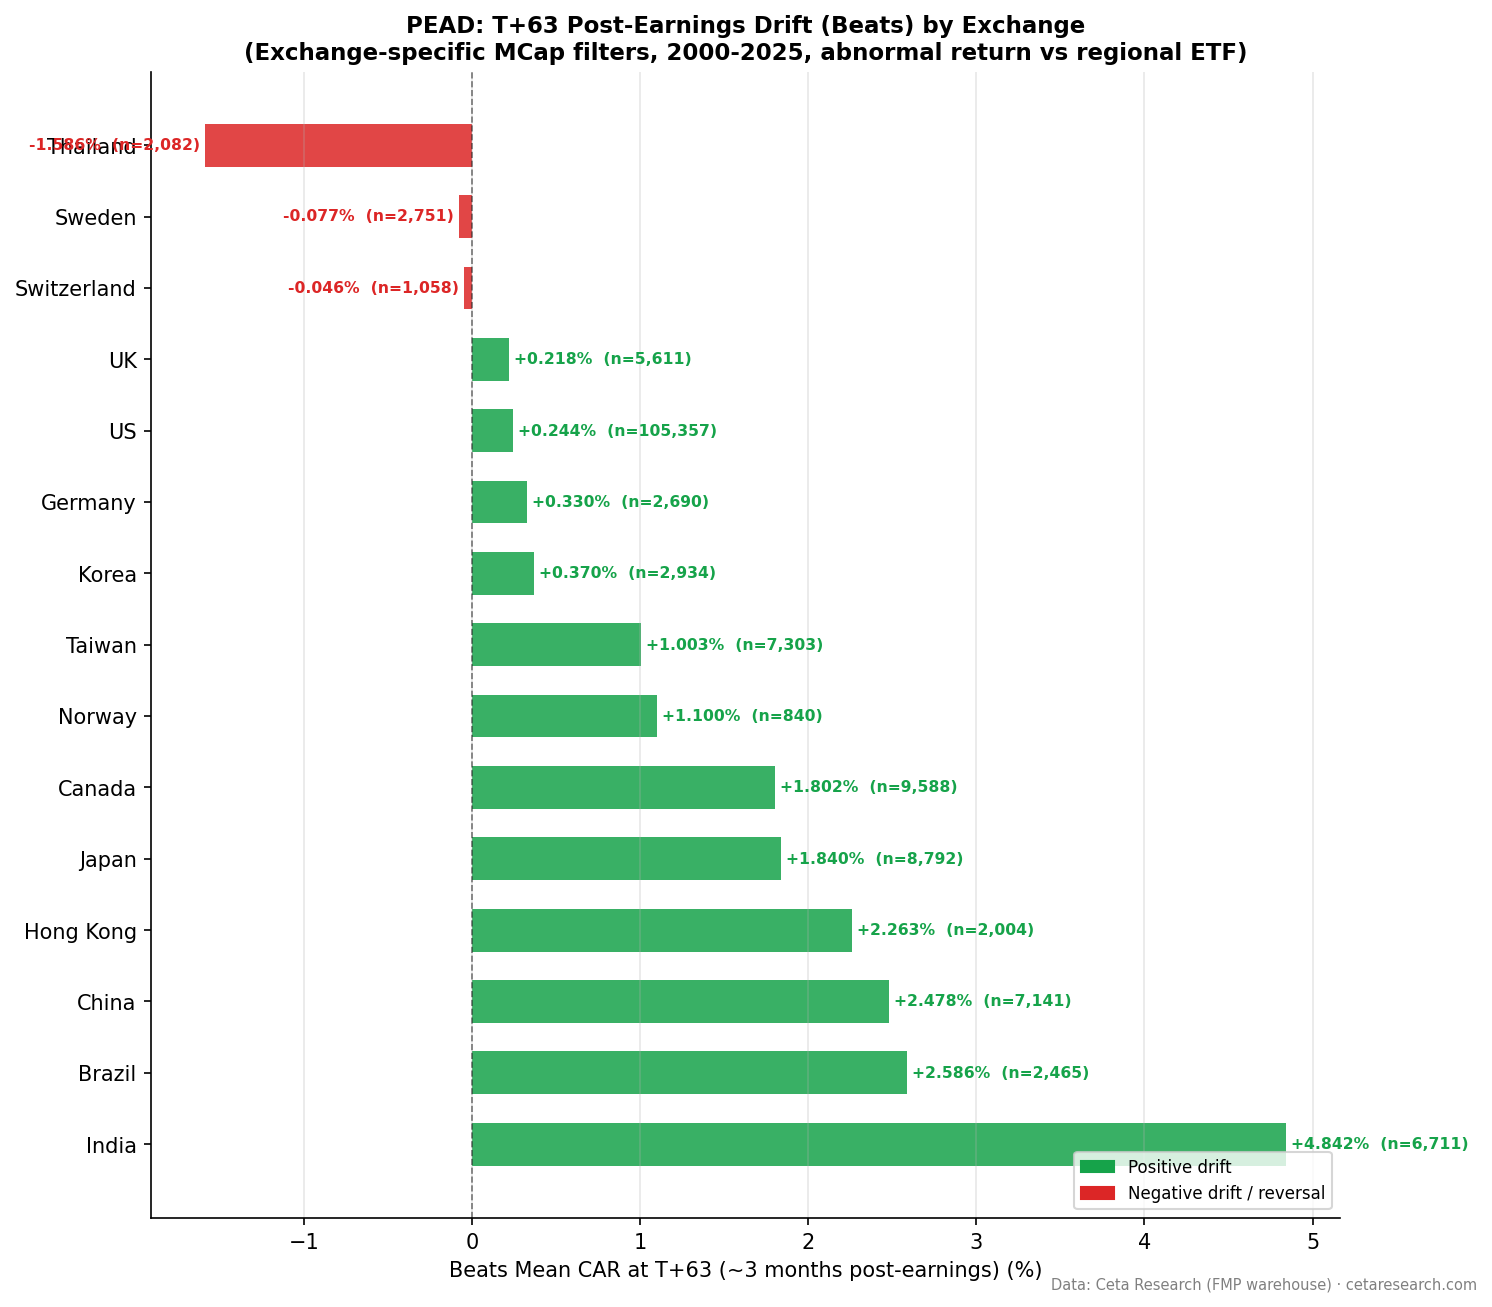
Don't buy the beat in Thailand. The earnings surprise signal here works in only one direction: misses produce strongly negative drift, and beats produce essentially nothing. The Q5-Q1 spread of +5.43% is the third-largest globally, but it's entirely driven by the collapse in Q1 (worst misses: -5.97% at T+63, t=-10.7). Q5 (biggest beats) produces -0.54% at T+63. That figure isn't statistically significant (t=-1.0). Thailand's PEAD is a miss-avoidance signal, not a classic drift anomaly.
Contents
- Method
- The Strategy
- What We Found
- Positive vs Negative Surprise Drift
- Quintile Analysis at T+63
- All Quintiles Are Negative
- What This Means in Practice
- Run It Yourself
- Limitations
- Part of a Series
- References
Method
| Parameter | Details |
|---|---|
| Data source | FMP earnings_surprises + stock_eod (Ceta Research warehouse) |
| Universe | SET (Thailand) — market cap threshold applied per exchange |
| Period | 2000–2025 (26 years) |
| Events | 4,540 total (deduplicated per symbol/date) |
| Benchmark | Equal-weighted SET market return |
| Surprise metric | (epsActual − epsEstimated) / ABS(epsEstimated) |
| Windows | T+1, T+5, T+21, T+63 trading days |
The Strategy
Post-Earnings Announcement Drift (PEAD) posits that stocks continue drifting in the direction of their earnings surprise for weeks after announcement. Ball and Brown (1968) first documented this. Bernard and Thomas (1989) confirmed the drift persists for up to 60 trading days. Foster, Olsen, and Shevlin (1984) extended the analysis.
The classic PEAD setup assumes both sides contribute to the spread: beats drift up, misses drift down. Thailand violates this assumption on the beat side. The 4,540 events across the SET give us sufficient power to identify the pattern clearly.
What We Found
Positive vs Negative Surprise Drift
| Direction | Events | Beat% | T+1 | T+5 | T+21 | T+63 |
|---|---|---|---|---|---|---|
| Positive surprises | 2,082 | 45.9% | +0.45% | +0.29% | -0.07% | -1.59% |
| Negative surprises | 2,458 | 54.1% | -0.57% | -1.10% | -1.70% | -5.11% |
These numbers require careful reading. Positive surprises produce +0.45% at T+1, which looks like the start of a normal PEAD pattern. But it fades to +0.29% by T+5, crosses into negative territory at T+21 (-0.07%), and reaches -1.59% by T+63. Earnings beats in Thailand underperform the benchmark over a three-month horizon.
Negative surprises drift strongly negative the entire way: -0.57% at T+1, -1.10% at T+5, -1.70% at T+21, and -5.11% at T+63. The miss-side drift is severe and sustained.
Both directions underperform the benchmark at T+63. This reflects the equal-weighted benchmark construction. The index has performed well during portions of this sample period, pulling up the benchmark return above both positive and negative surprise groups. The relative signal between Q5 and Q1 still holds, but the absolute CAR figures tell a specific story: in Thailand, earnings announcements are generally followed by underperformance relative to the market average, with misses producing far worse outcomes.
Quintile Analysis at T+63
| Quintile | Description | Events | CAR T+63 | t-stat | Significant? | Hit Rate |
|---|---|---|---|---|---|---|
| Q5 | Biggest beats | 824 | -0.54% | -1.0 | No | — |
| Q4 | Moderate beats | — | -2.19% | — | — | — |
| Q3 | Near-consensus | — | -3.91% | — | — | — |
| Q2 | Moderate misses | — | -4.90% | — | — | — |
| Q1 | Worst misses | 815 | -5.97% | -10.7 | Yes | 34.4% |
The Q5 t-stat of -1.0 means we can't reject the null hypothesis that Q5 CAR equals zero. The -0.54% is noise, not signal. Any strategy built on buying Q5 beats in Thailand has no statistically reliable basis from this 26-year study.
Q1 tells a different story entirely. The t-stat of -10.7 is very high. The Q1 hit rate of 34.4% means only one in three worst-miss events avoids negative drift at T+63. This is a robust, well-identified finding: stocks in the bottom quintile of earnings surprises on the SET systematically underperform the market by -5.97% over the following 63 trading days.
The Q5-Q1 spread of +5.43% is the third-largest in our global study. But framing this as "strong PEAD" would be misleading. The spread exists because Q1 falls dramatically, not because Q5 rises. A long-short PEAD strategy in Thailand (long Q5, short Q1) would have a non-contributing long leg. The spread is structurally a short-only metric in this market.
All Quintiles Are Negative
Every quintile produces negative CAR at T+63 in Thailand. Q5 is -0.54% (not significant), Q4 is -2.19%, Q3 is -3.91%, Q2 is -4.90%, Q1 is -5.97%. This monotonic decline from Q5 to Q1 is consistent with a market where earnings disappointments are severely punished, but even good news doesn't generate sustained outperformance above the equal-weighted benchmark.
This pattern differs from every other exchange in our global study, where at least some quintiles produce positive absolute drift. Thailand is unique in its uniformly negative CAR structure.
What This Means in Practice
The signal in Thailand is one-sided: avoid (or short) stocks in the bottom quintile of earnings surprises. The -5.97% Q1 drift at T+63 is large, statistically strong, and consistent over the 26-year sample.
Buying the beat doesn't work. The -0.54% Q5 result isn't just small, it's directionally wrong. Thailand beat rates (45.9%) mean more companies miss than beat, and even when they beat, the market doesn't reward them with sustained outperformance.
A practical implementation in Thailand would focus exclusively on earnings miss screening. Running the screen.py tool with a downside filter (lowest surprise quintile) identifies stocks to avoid or underweight. The long-only version of PEAD (buying big beats) has no evidence base here.
Run It Yourself
python3 earnings-surprise/screen.py --preset thailand
-- Recent large negative earnings surprises on SET (miss-side signal)
WITH deduped AS (
 SELECT
 es.symbol,
 es.date,
 es.epsActual,
 es.epsEstimated,
 (es.epsActual - es.epsEstimated) / NULLIF(ABS(es.epsEstimated), 0) AS std_surprise,
 ROW_NUMBER() OVER (PARTITION BY es.symbol, es.date ORDER BY es.lastUpdated DESC) AS rn
 FROM earnings_surprises es
 JOIN profile p ON es.symbol = p.symbol
 WHERE p.exchange = 'SET'
 AND p.isActivelyTrading = true
 AND es.date >= CURRENT_DATE - INTERVAL '90 days'
 AND ABS(es.epsEstimated) > 0.01
)
SELECT
 symbol,
 date,
 epsActual,
 epsEstimated,
 ROUND(std_surprise * 100, 1) AS surprise_pct
FROM deduped
WHERE rn = 1
 AND std_surprise < -0.10
ORDER BY date DESC, std_surprise ASC
LIMIT 50
Run this query on Ceta Research →
Limitations
4,540 events is the smallest sample in our global study. Quintile sizes of approximately 800–850 events each are sufficient for the Q1 finding (t=-10.7), but the Q5 non-result (-1.0) would benefit from a larger sample to confirm or refute. The Thailand sample has grown over time as SET coverage has expanded; results may differ across sub-periods.
The uniformly negative absolute CAR across all quintiles likely reflects benchmark construction choices. The equal-weighted SET benchmark includes a diverse mix of sectors. If the benchmark is weighted toward stronger-performing stocks during the sample period, all event-study groups would underperform on average. The relative signal (Q5 vs Q1) is robust regardless of this level effect.
The miss-side signal (-5.97% at T+63 for Q1) is large enough that short-selling implementation would face practical barriers on the SET: stock borrow availability and cost for smaller Thai stocks can be limiting. The signal is most useful for portfolio managers who already hold Thai equities and want to reduce or avoid exposure to high-miss-risk names before earnings.
Part of a Series
- PEAD Across 14 Global Exchanges: The Drift Is Universal
- Earnings Surprise Drift on US Stocks: 170,000 Events, 26 Years
References
- Ball, R. & Brown, P. (1968). An empirical evaluation of accounting income numbers. Journal of Accounting Research.
- Bernard, V. & Thomas, J. (1989). Post-earnings-announcement drift: Delayed price response or risk premium? Journal of Accounting Research.
- Foster, G., Olsen, C. & Shevlin, T. (1984). Earnings releases, anomalies, and the behavior of security returns. The Accounting Review.
Run It Yourself
Explore the data behind this analysis on Ceta Research. Query our financial data warehouse with SQL, build custom screens, and run your own backtests across 70,000+ stocks on 20 exchanges.
Data: Ceta Research, FMP financial data warehouse


