
Earnings Surprise Drift in India: The Strongest PEAD in Our Global

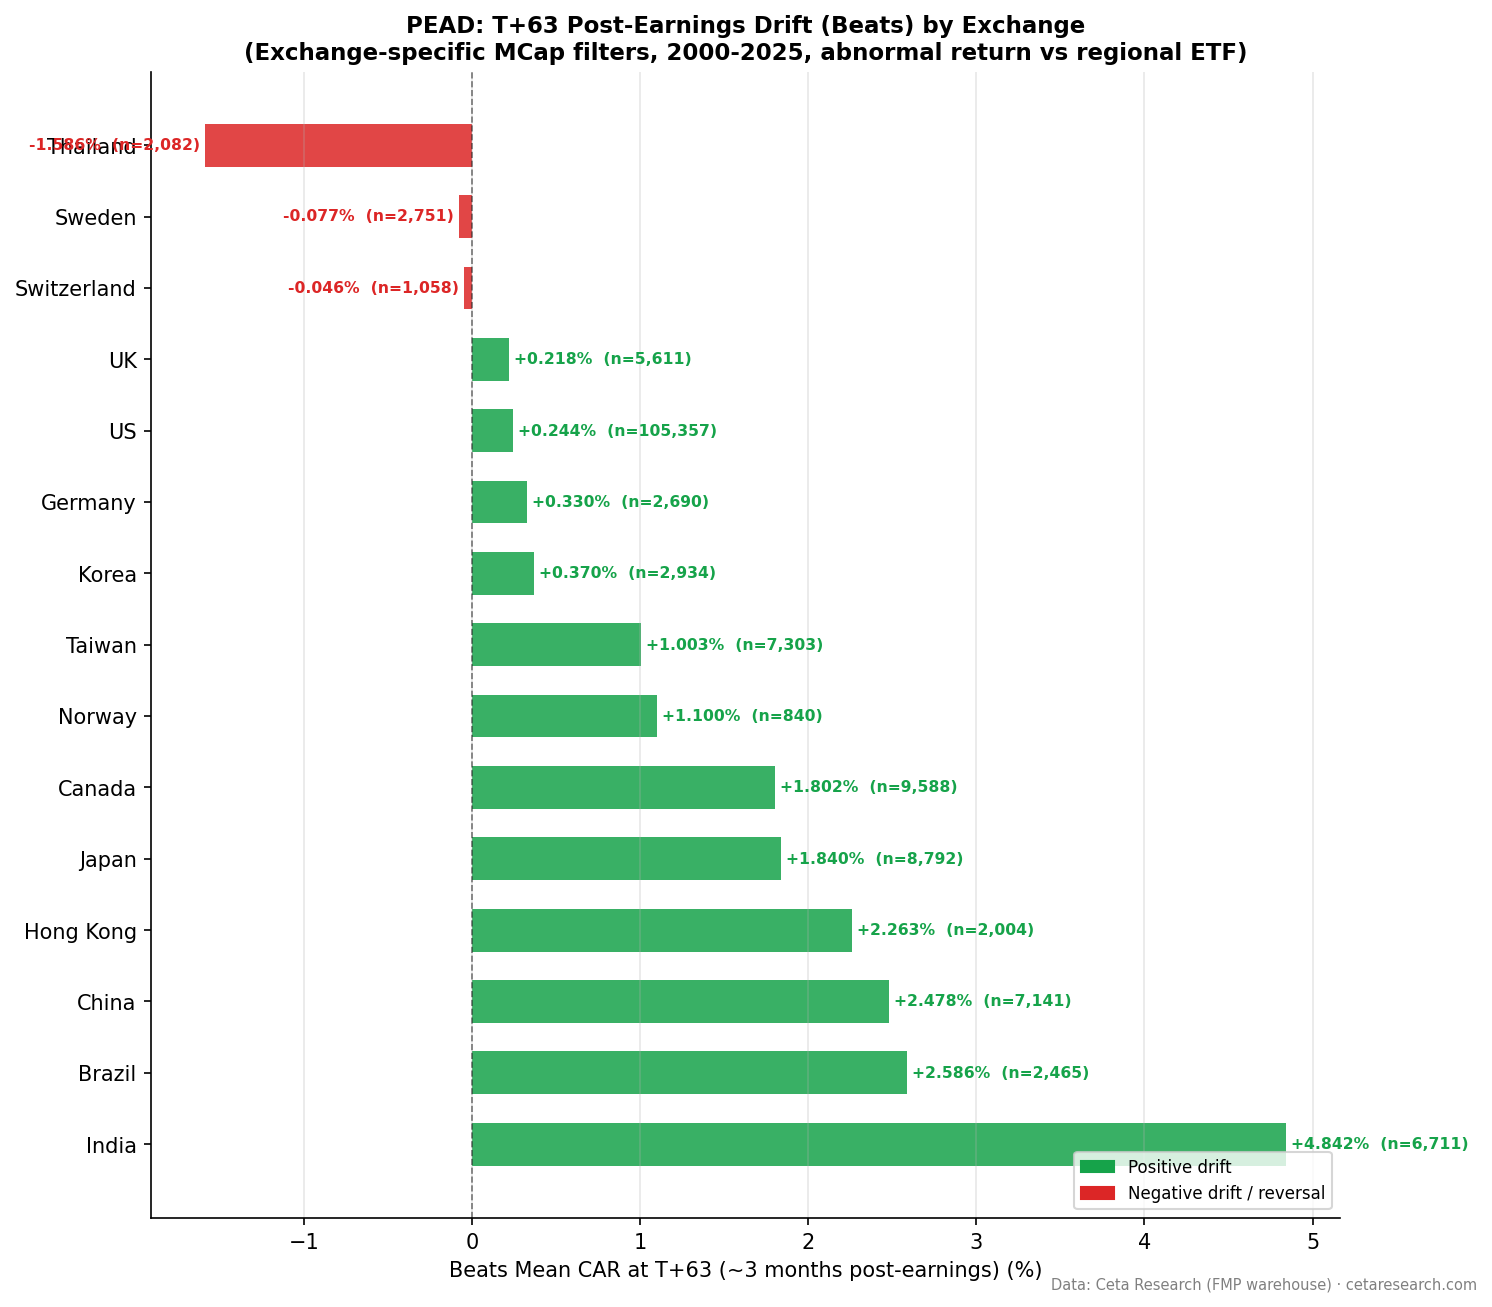
India has the largest earnings surprise drift of any exchange we tested. Beat the estimate on BSE or NSE and your stock produces +4.84% cumulative abnormal return over the following 63 trading days. That's 20x the equivalent figure for US stocks (+0.24%). The Q5-Q1 quintile spread of +7.59% is the widest across all 14 exchanges in our study. What makes India distinctive is that the drift is almost entirely a positive-side phenomenon. Misses don't punish.
Contents
- Method
- The Strategy
- What We Found
- Positive vs Negative Surprise Drift
- Quintile Analysis at T+63
- India's Beat Rate Is Below 50%
- How India Compares Globally
- When It Works and When It Struggles
- Run It Yourself
- Limitations
- Part of a Series
- References
Method
| Parameter | Details |
|---|---|
| Data source | FMP earnings_surprises + stock_eod (Ceta Research warehouse) |
| Universe | BSE + NSE — market cap threshold applied per exchange |
| Period | 2000–2025 (26 years) |
| Events | 14,360 total (deduplicated per symbol/date) |
| Benchmark | Equal-weighted BSE+NSE market return |
| Surprise metric | (epsActual − epsEstimated) / ABS(epsEstimated) |
| Windows | T+1, T+5, T+21, T+63 trading days |
The Strategy
Post-Earnings Announcement Drift (PEAD) is a documented market anomaly dating to Ball and Brown (1968). The mechanism: markets underreact to earnings news on announcement day, then gradually incorporate the signal over weeks. Bernard and Thomas (1989) showed the drift persists for up to 60 trading days in US markets.
We extended this analysis globally. Each exchange gets its own event study using local benchmark returns. India's results stand out from every other market in the dataset.
What We Found
Positive vs Negative Surprise Drift
| Direction | Events | Beat% | T+1 | T+5 | T+21 | T+63 |
|---|---|---|---|---|---|---|
| Positive surprises | 6,711 | 46.7% | +0.68% | +1.21% | +2.18% | +4.84% |
| Negative surprises | 7,649 | 53.3% | -0.55% | -0.52% | -0.45% | +0.08% |
Two things stand out. First, India's positive drift keeps building the entire way to T+63. This isn't a T+1 pop that fades. It's a genuine drift that compounds over three months.
Second, the negative surprise drift is essentially zero at T+63 (+0.08%). Stocks that miss estimates in India don't drift down. They absorb the miss and recover. This is the opposite of the US pattern, where misses produce -2.00% at T+63.
Quintile Analysis at T+63
| Quintile | Description | Events | CAR at T+63 |
|---|---|---|---|
| Q5 | Biggest beats | 2,779 | +6.67% |
| Q4 | Moderate beats | — | +4.28% |
| Q3 | Near-consensus | — | +1.55% |
| Q2 | Moderate misses | — | -0.04% |
| Q1 | Worst misses | — | -0.92% |
The Q5-Q1 spread is +7.59%, the largest in our global study. Q5 beats produce +6.67% over 63 trading days. Q1 misses produce only -0.92%. Even the worst quintile barely drifts negative. The entire distribution skews upward.
The Q5 hit rate is 61.7% (t-stat = 19.6), which means this is a statistically robust finding, not a noise artifact in a thin sample.
India's Beat Rate Is Below 50%
One counterintuitive finding: India's beat rate is 46.7%. More companies miss estimates than beat them. This is the inverse of the US pattern (61.9% beats). The low beat rate suggests analyst estimates in India are less systematically conservative. Companies aren't managing guidance to guarantee beats.
This matters for interpretation. In the US, beating estimates is the norm, so the signal is diluted. In India, a genuine beat is rarer and the market reacts more strongly. The T+1 gap (+0.68%) is comparable to the US, but India's drift compounds all the way to T+63 rather than fading.
How India Compares Globally

India ranks first in Q5-Q1 spread across all 14 exchanges tested. The next closest are Taiwan (+5.47%) and Thailand (+5.43%). US ranks 10th at +3.72%. Sweden ranks last at +0.91%.
India also has the strongest positive-side drift globally. No other exchange produces +4.84% positive surprise drift at T+63. The combination of strong positive drift and flat negative drift makes India uniquely suited to a long-only PEAD strategy.
When It Works and When It Struggles
India's PEAD is a positive-side story. Running a long-only strategy on Q4+Q5 beats is the natural implementation. Shorting Q1 misses in India isn't particularly useful given the flat -0.92% at T+63.
The drift builds gradually. T+1 is +0.68%, T+5 is +1.21%, T+21 is +2.18%, T+63 is +4.84%. This suggests the Indian market is slower to price in positive news than Western markets. The window for capture is wider.
One practical note: Indian markets have lower liquidity for smaller-cap stocks. Implementing a PEAD strategy that requires quick execution at T+1 close faces more slippage on BSE+NSE than on NYSE or NASDAQ.
Run It Yourself
-- Recent large positive earnings surprises on BSE+NSE
WITH deduped AS (
  SELECT
    es.symbol,
    es.date,
    es.epsActual,
    es.epsEstimated,
    (es.epsActual - es.epsEstimated) / NULLIF(ABS(es.epsEstimated), 0) AS std_surprise,
    ROW_NUMBER() OVER (PARTITION BY es.symbol, es.date ORDER BY es.lastUpdated DESC) AS rn
  FROM earnings_surprises es
  JOIN profile p ON es.symbol = p.symbol
  WHERE p.exchange IN ('BSE', 'NSE')
    AND p.marketCap >= 100000000
    AND p.isActivelyTrading = true
    AND es.date >= CURRENT_DATE - INTERVAL '90 days'
    AND ABS(es.epsEstimated) > 0.01
)
SELECT
  symbol,
  date,
  epsActual,
  epsEstimated,
  ROUND(std_surprise * 100, 1) AS surprise_pct
FROM deduped
WHERE rn = 1
  AND std_surprise > 0.10
ORDER BY date DESC, std_surprise DESC
LIMIT 50
Run this query on Ceta Research →
Limitations
14,360 events across 26 years is a smaller sample than the US study (170,115 events). Early years have sparse coverage, so results from 2000–2005 carry wider confidence intervals. The statistical significance of Q5 (t-stat 19.6) is strong, but individual-year results will vary.
Analyst coverage in India is thinner than in the US. Consensus estimates for small and mid-cap Indian stocks come from fewer analysts, which makes the standardized surprise noisier. Our market cap filter helps here but doesn't eliminate the issue.
Execution in India requires attention to settlement cycles and trading hours. The T+1 CAR in this study uses closing prices. Real-world slippage on announcement-day trades will reduce the captured edge.
Part of a Series
- PEAD Across 14 Global Exchanges: The Drift Is Universal
- Earnings Surprise Drift on US Stocks: 170,000 Events, 26 Years
References
- Ball, R. & Brown, P. (1968). An empirical evaluation of accounting income numbers. Journal of Accounting Research.
- Bernard, V. & Thomas, J. (1989). Post-earnings-announcement drift: Delayed price response or risk premium? Journal of Accounting Research.
- Foster, G., Olsen, C. & Shevlin, T. (1984). Earnings releases, anomalies, and the behavior of security returns. The Accounting Review.
Run It Yourself
Explore the data behind this analysis on Ceta Research. Query our financial data warehouse with SQL, build custom screens, and run your own backtests across 70,000+ stocks on 20 exchanges.
Data: Ceta Research, FMP financial data warehouse


