Post-Earnings Drift Across 13 Global Exchanges: The Drift Shrinks Everywhere
We tested Post-Earnings Announcement Drift on 13 global exchanges with 280,000+ events, 2000-2025, entering at the next day's close. The tradeable drift is far smaller than same-day studies show. Taiwan leads (+4.52% spread), India leads the beat side.

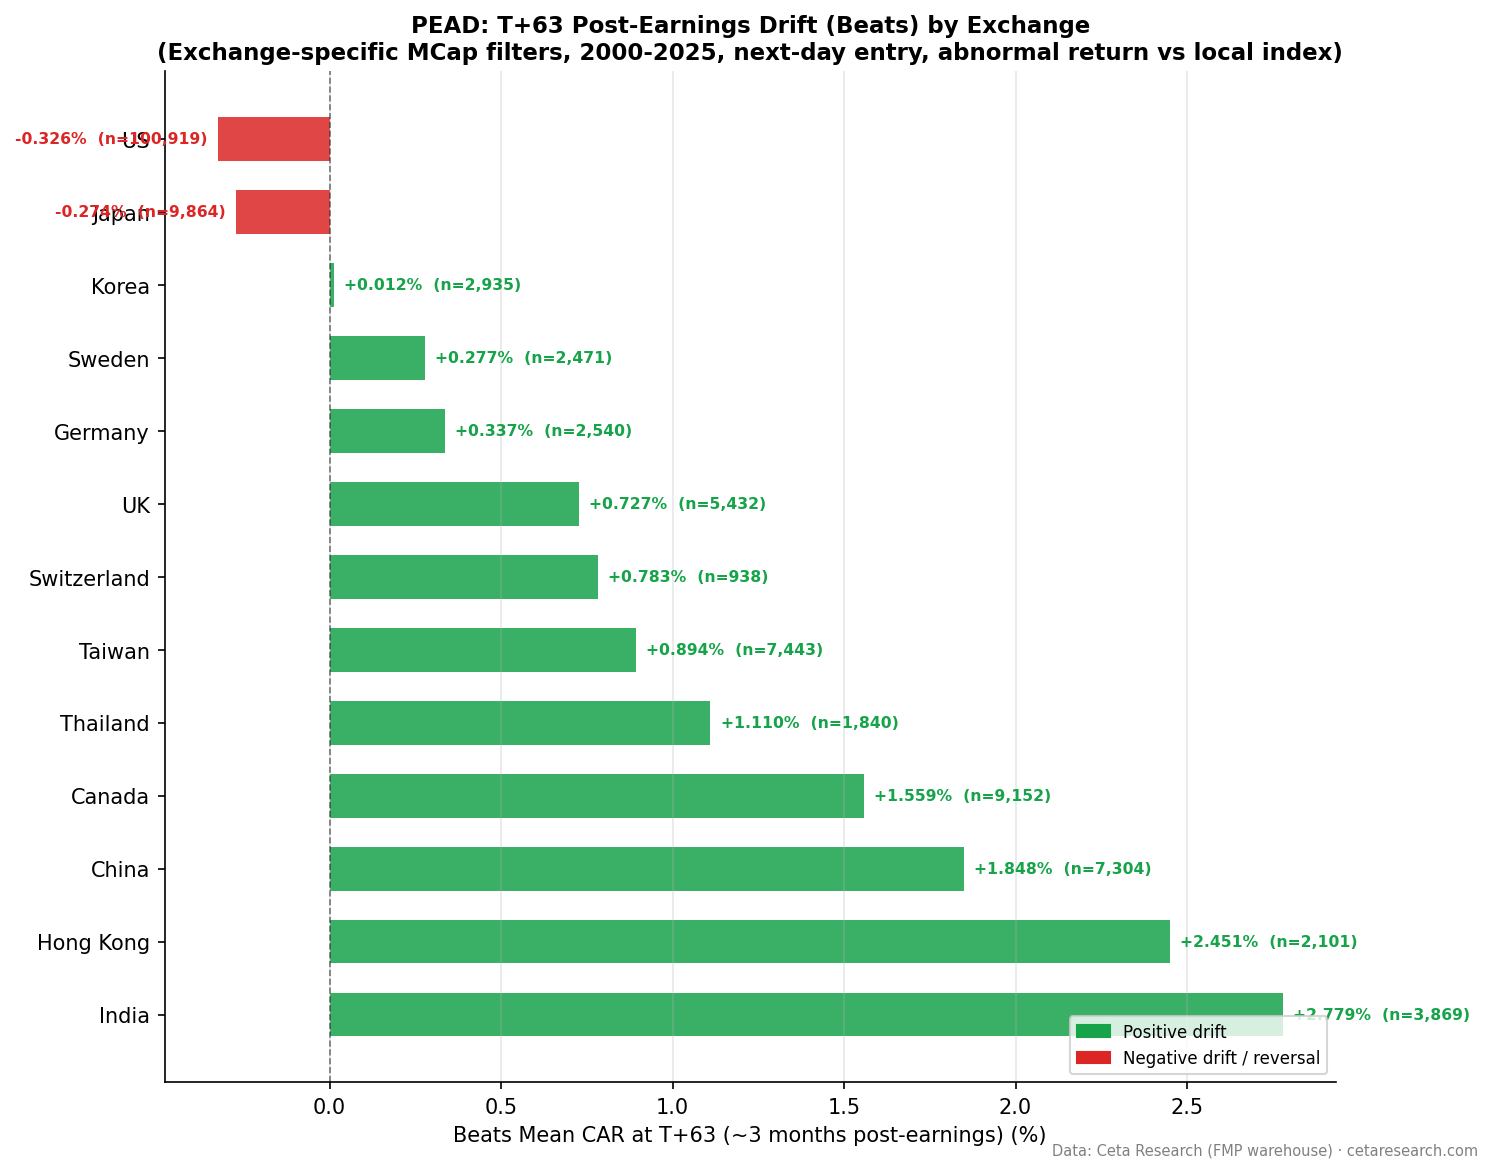
We tested Post-Earnings Announcement Drift on 13 global exchanges using more than 280,000 earnings events from 2000 to 2025, and we entered every position at the next day's close, skipping the announcement day. That one rule changes the story. The drift you can trade is far smaller than same-day event studies report, because a large part of the apparent drift is the announcement-day jump you can't actually buy. After the correction, PEAD still shows a positive Q5-Q1 quintile spread in all 13 exchanges, but the spreads are roughly 40 to 85% smaller than the same-day numbers. Taiwan now has the widest spread at +4.52%. India has the strongest beat side. And in the most efficient markets, the beat side is essentially gone.
Contents
- Method
- The Correction That Matters
- What We Found
- Full Exchange Comparison (sorted by Q5-Q1 spread at T+63)
- Beat-Side and Miss-Side Markets Are Different Places
- The Beat Side Collapses in Efficient Markets
- Beat Rate Varies Widely
- When It Works and When It Struggles
- Run It Yourself
- Limitations
- Part of a Series
- References
Data: FMP financial data warehouse, 2000–2025. Updated July 2026.
Method
| Parameter | Details |
|---|---|
| Data source | FMP earnings_surprises + stock_eod (Ceta Research warehouse) |
| Universe | 13 exchanges, market cap threshold applied per exchange |
| Period | 2000–2025 (up to 26 years, varies by exchange) |
| Total events | 280,000+ across all exchanges |
| Benchmark | Local currency index per exchange (Sensex for India, Nikkei for Japan, TAIEX for Taiwan, etc.) |
| Execution | Enter at the next day's close (T+1), skipping the announcement day |
| Data quality | Oscillation rows removed, entry price > $1, single-window return capped at 200% |
| Surprise metric | (epsActual − epsEstimated) / ABS(epsEstimated) |
| Windows | T+1, T+5, T+21, T+63 trading days, measured from entry |
Two exchanges are excluded. Brazil (SAO) has fatal adjClose data-quality issues in the source data and can't be measured reliably. Norway (OSL) produces a negative Q5-Q1 spread on a small sample, so it's held out of the comparison.
The Correction That Matters
Most published PEAD studies enter at the close of the announcement day. That's a problem, because most companies report after the market closes. The stock gaps the next morning and does the bulk of its repricing on the first post-announcement day. If your event study buys at the announcement-day close, it books that overnight gap as tradeable drift. It isn't. You didn't know the result when that close printed.
So we skip a day. Every position enters at the next day's close, and every window is measured from there. The announcement-day jump drops out, leaving the drift you could actually have captured. Comparing the two is instructive: the US Q5-Q1 spread falls from +3.72% (same-day) to +1.42% (next-day). Japan falls from +4.93% to +0.82%. The gap between those numbers is the part of "PEAD" that was never tradeable.
What We Found
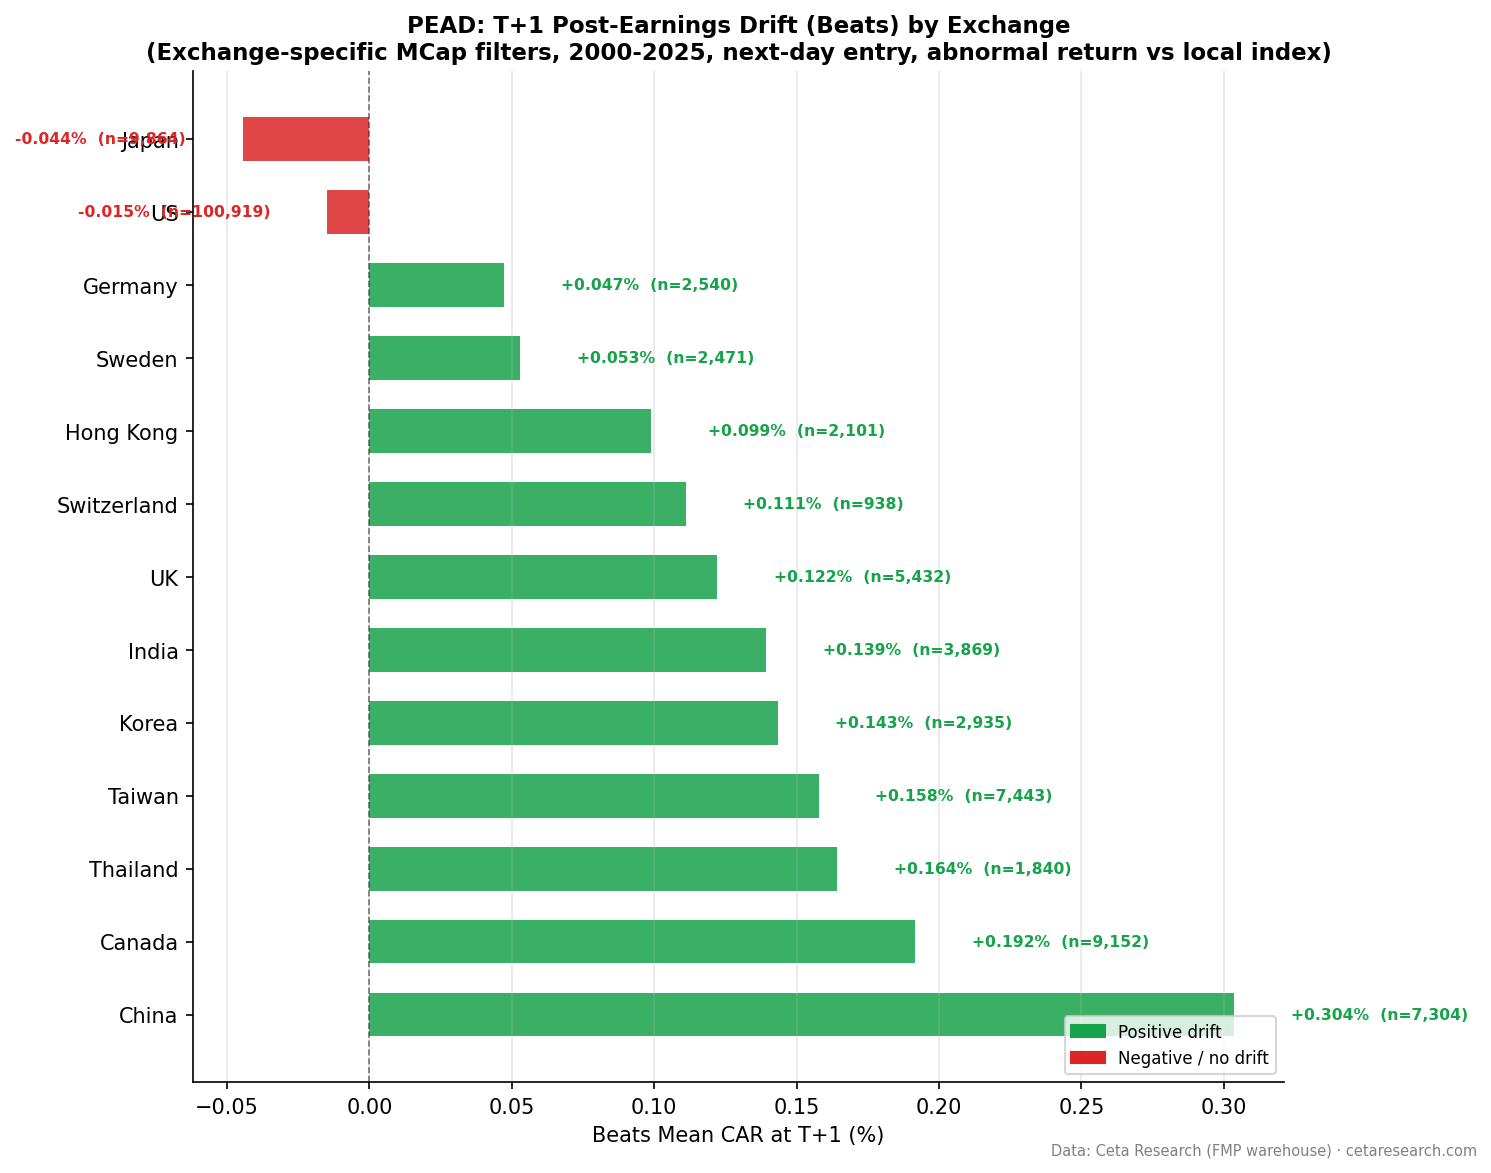
One more honesty adjustment. Raw CAR carries a universe-versus-index baseline: the event universe is equal-weighted while each benchmark is cap-weighted, so the near-consensus quintile (Q3) is not zero. The earnings-attributable drift is the level relative to Q3. We report the beat side as Q5 minus Q3 and the miss side as Q1 minus Q3. Those two numbers decompose the spread exactly (spread = beat side minus miss side) and tell you which tail each market's edge comes from.
Full Exchange Comparison (sorted by Q5-Q1 spread at T+63)
| Exchange | Events | Beat% | Beat side (Q5−Q3) | Miss side (Q1−Q3) | Q5−Q1 spread | Benchmark |
|---|---|---|---|---|---|---|
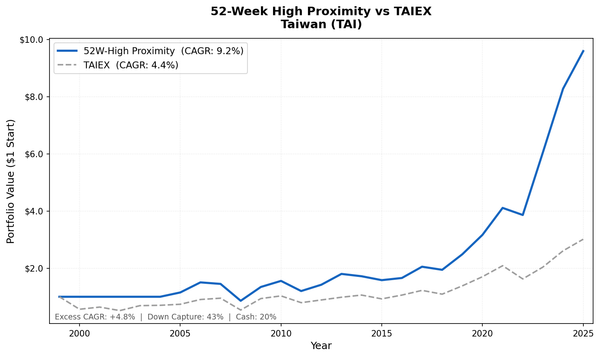
| Taiwan (TAI+TWO) | 16,958 | 43.9% | +1.84% | -2.69% | +4.52% | TAIEX |
| India (NSE) | 8,128 | 47.6% | +3.76% | -0.32% | +4.08% | Sensex |
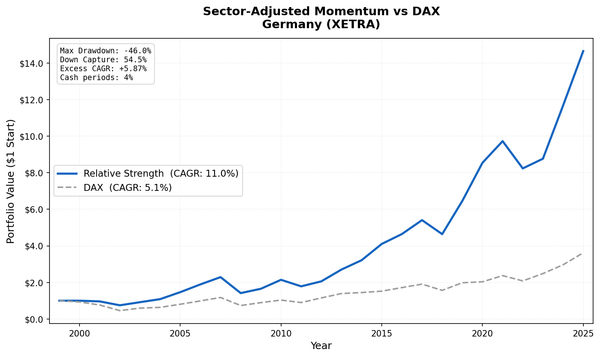
| Germany (XETRA)* | 5,556 | 45.7% | +2.63% | -0.72% | +3.35% | DAX |
| Hong Kong (HKSE) | 4,635 | 45.3% | +2.35% | -0.87% | +3.22% | Hang Seng |
| China (SHZ+SHH) | 21,010 | 34.8% | +1.46% | -0.87% | +2.33% | SSE Composite |
| Thailand (SET) | 4,012 | 45.9% | +1.50% | -0.73% | +2.22% | SET Index |
| Canada (TSX) | 18,076 | 50.6% | +0.10% | -1.79% | +1.89% | TSX Composite |
| Korea (KSC) | 6,810 | 43.1% | +2.17% | +0.36% | +1.81% | KOSPI |
| Switzerland (SIX) | 1,862 | 50.4% | -0.38% | -2.05% | +1.67% | SMI |
| UK (LSE) | 12,246 | 44.4% | +1.38% | -0.21% | +1.59% | FTSE 100 |
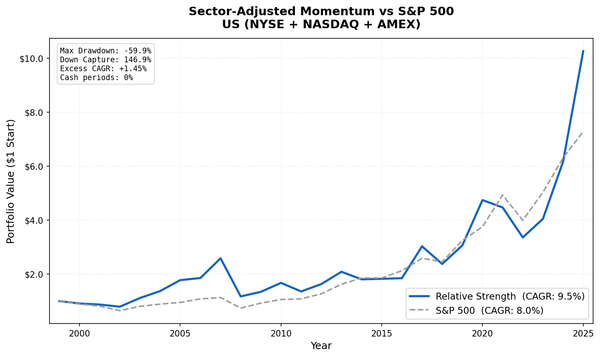
| US (NYSE+NASDAQ+AMEX) | 161,243 | 62.6% | +0.45% | -0.97% | +1.42% | S&P 500 |
| Japan (JPX) | 17,219 | 57.3% | +1.16% | +0.33% | +0.82% | Nikkei 225 |
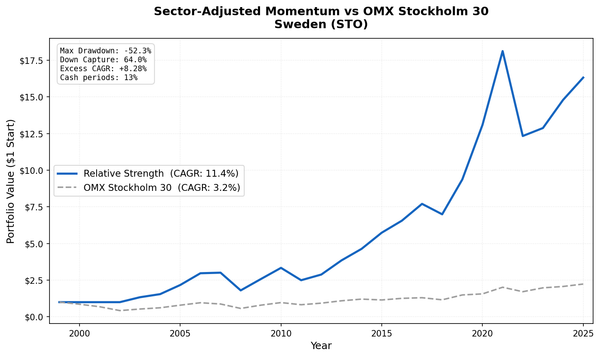
| Sweden (STO) | 5,018 | 49.2% | -1.06% | -1.71% | +0.65% | OMX Stockholm 30 |
*XETRA coverage is 98% post-2020 in this warehouse. Treat Germany as a 2021–2025 study.
Beat-Side and Miss-Side Markets Are Different Places
The decomposition splits the exchanges cleanly. The beat side (positive Q5 minus Q3) is largest in India (+3.76%), Germany (+2.63%), Hong Kong (+2.35%), and Korea (+2.17%). The miss side (negative Q1 minus Q3) is largest in Taiwan (-2.69%), Switzerland (-2.05%), Canada (-1.79%), and Sweden (-1.71%).
Only Taiwan and China show both sides clearly. Everywhere else, one tail carries the spread. This is easy to miss if you read raw levels instead of the baselined figures. Canada is the clearest example: its biggest beats produce +1.61% raw, which looks like a beat-side market, but its near-consensus quintile already runs +1.51%, so the beat "drift" is a universe tilt, not an earnings signal. Canada's real edge is the miss side.
The Beat Side Collapses in Efficient Markets
In the US and Japan, the beat side is close to nothing. US positive surprises drift -0.33% at T+63, and even the biggest beats land at -0.04%. Japan's Q5 is +0.14%, not significant. These were the markets where same-day studies showed the largest "T+1 beat drift", and that drift was the announcement pop. Skip a day and it's gone.
The beat side survives where the market is slower and beats are rarer. India (47.6% beat rate), Hong Kong, and China (34.8%, the lowest) all keep genuine beat-side drift because a beat there is a real surprise, not a routine clearing of a lowered bar.
Beat Rate Varies Widely
| Beat rate | Exchanges |
|---|---|
| >57% | US (62.6%), Japan (57.3%) |
| ~50% | Canada (50.6%), Switzerland (50.4%), Sweden (49.2%) |
| 43–48% | India, Taiwan, Thailand, Hong Kong, UK, Germany, Korea |
| <35% | China (34.8%) |
China's 34.8% beat rate stands out. Nearly two thirds of Chinese earnings miss estimates, which is structurally different from the US, where guidance conservatism has pushed beat rates above 62%. A low beat rate means each beat is more genuine, which is consistent with China keeping real beat-side drift.
When It Works and When It Struggles
The tradeable edge is smaller than the raw anomaly. The spreads here are gross of costs, and they represent the drift that survives a realistic next-day entry, not a same-day fill. In markets with a real beat side (India, Hong Kong, China), a long-only implementation on the top quintile is the natural trade. In miss-side markets (Taiwan, Canada, Switzerland), the edge is in avoiding or shorting the worst misses.
During market-wide stress, single-stock earnings signals get swamped by macro factors, and the drift gets noisier everywhere.
Run It Yourself
-- Global earnings surprise screen with exchange filter
WITH deduped AS (
  SELECT
    es.symbol,
    es.date,
    p.exchange,
    es.epsActual,
    es.epsEstimated,
    (es.epsActual - es.epsEstimated) / NULLIF(ABS(es.epsEstimated), 0) AS std_surprise,
    ROW_NUMBER() OVER (PARTITION BY es.symbol, es.date ORDER BY es.lastUpdated DESC) AS rn
  FROM earnings_surprises es
  JOIN profile p ON es.symbol = p.symbol
  WHERE p.isActivelyTrading = true
    AND CAST(es.date AS DATE) >= CURRENT_DATE - INTERVAL '30 days'
    AND ABS(es.epsEstimated) > 0.01
)
SELECT
  symbol,
  exchange,
  date,
  ROUND(std_surprise * 100, 1) AS surprise_pct,
  epsActual,
  epsEstimated
FROM deduped
WHERE rn = 1
  AND std_surprise > 0.15
ORDER BY date DESC, std_surprise DESC
LIMIT 100
Run this query on Ceta Research →
Limitations
Entering at the next day's close is the honest convention here, since earnings timing is not uniform and the announcement-day move is not reliably tradeable. It is conservative: a name that reported before the open could be entered earlier. The numbers are a floor.
Raw CAR includes a universe-versus-index baseline, which is why we report the Q5 minus Q3 and Q1 minus Q3 decomposition rather than raw levels. The Q5-Q1 spread is invariant to the baseline and is the cleanest single number.
Exchange coverage varies by data depth. XETRA has meaningful data only from 2020 onward, so Germany is effectively a five-year study. Thin-sample exchanges (Switzerland, Thailand, Hong Kong) carry wider confidence intervals than the larger ones. The spreads are the gross anomaly, not a live strategy after costs.
Part of a Series
- Earnings Surprise Drift on US Stocks: Most of It Vanishes If You Wait One Day
- India Earnings Surprise Drift: The Strongest Beat-Side Drift We Found
References
- Ball, R. & Brown, P. (1968). An empirical evaluation of accounting income numbers. Journal of Accounting Research.
- Bernard, V. & Thomas, J. (1989). Post-earnings-announcement drift: Delayed price response or risk premium? Journal of Accounting Research.
- Foster, G., Olsen, C. & Shevlin, T. (1984). Earnings releases, anomalies, and the behavior of security returns. The Accounting Review.
Data: Ceta Research, FMP financial data warehouse. Not investment advice.