
Sector-Adjusted Momentum on Swedish Stocks: 11.45% CAGR, +8.28% vs OMX Stockholm 30
Sector-adjusted momentum on STO (Stockholm) returned 11.45% annually from 2000 to 2025 vs the OMX Stockholm 30's 3.17%, with +8.28% excess CAGR, the largest in a 14-market study, and a 0.457 Sharpe ratio.

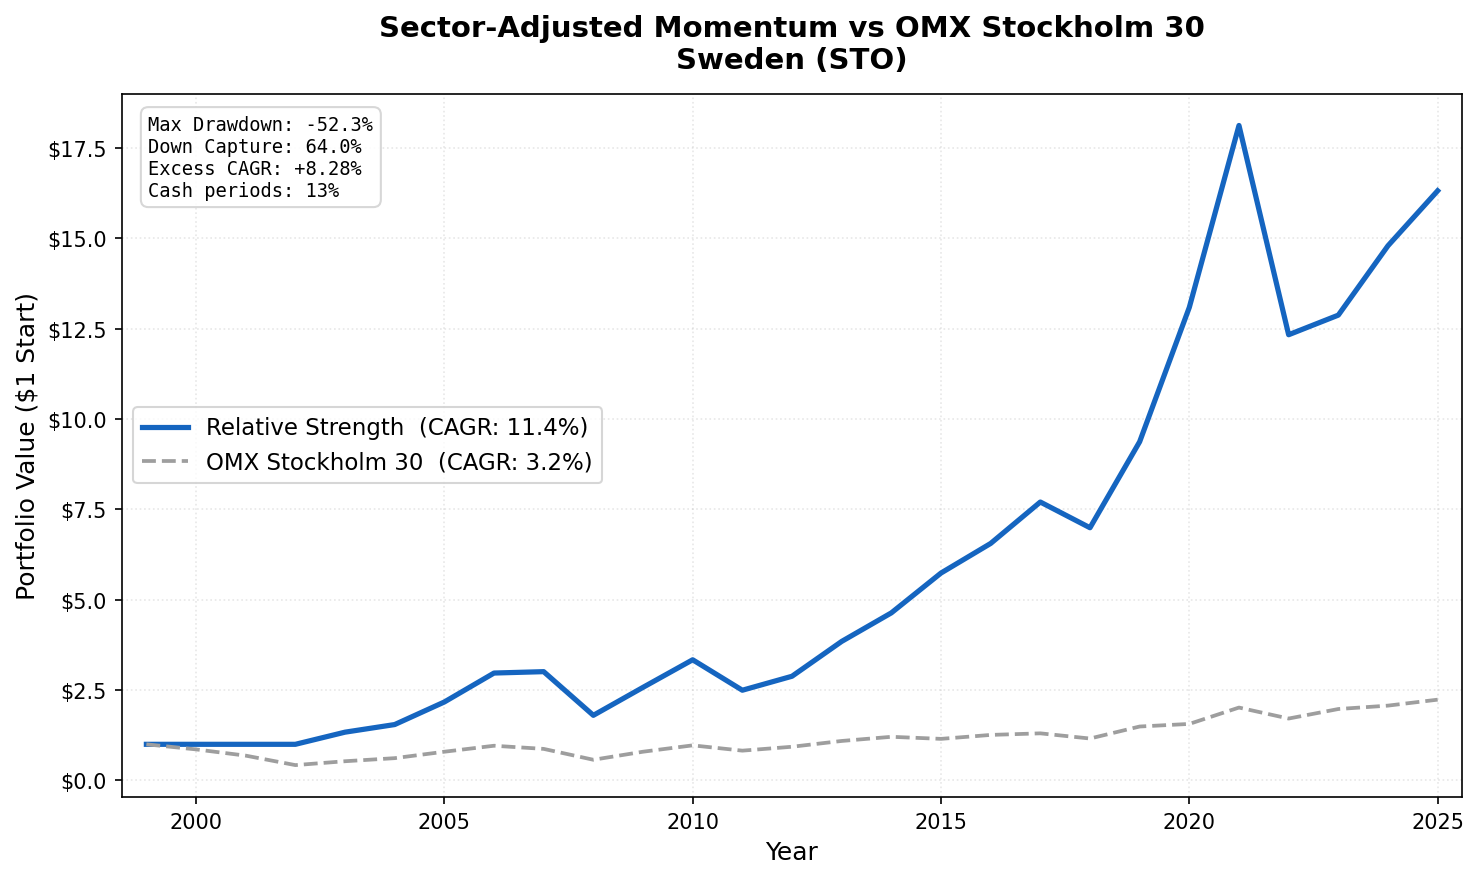
We backtested the Sector-Adjusted Momentum strategy on STO (Swedish stocks) from 2000 to 2025. The strategy buys stocks outperforming their own sector peers on a 12-month return basis, stripping out sector trends to isolate stock-level momentum. The result: 11.45% annual return versus the OMX Stockholm 30's 3.17%, with +8.28% annual alpha.
Contents
- Method
- Performance
- Why Sweden Works
- The Swedish Market Context
- The Current Screen
- Limitations
- By the Numbers
- Academic Basis
That excess is the largest of any market in a 14-exchange study. Sweden wins on a combination most markets don't offer: a deep universe of under-covered mid-caps and a local benchmark that barely moved over 25 years.
Data: FMP financial data warehouse, 2000-2025. Updated June 2026.
Method
Data source: Ceta Research (FMP financial data warehouse) Universe: STO (Stockholm) stocks, market cap > SEK 5B (about $460M USD) Period: 2000-2025 (25 years, 103 quarterly periods) Rebalancing: Quarterly (January, April, July, October), equal weight Benchmark: OMX Stockholm 30 (^OMXS30), 3.17% CAGR over this period Transaction costs: Size-tiered (about 0.2% one-way for Swedish mid-caps) Cash rule: Hold cash if fewer than 10 stocks qualify at a rebalance date
Signal construction: 1. Compute each stock's 12-month return, skipping the most recent month (12M-1M per Jegadeesh & Titman 1993) 2. Compute the equal-weighted sector average across qualifying STO stocks 3. Relative strength = stock return minus sector average return 4. Buy top 30 by relative strength, equal weight
Data quality guards: Minimum price SEK 1.0, maximum raw signal 500% (filters split-adjustment artifacts), maximum single-period return 200%, and a price-oscillation filter that removes phantom holiday rows and broken split adjustments.
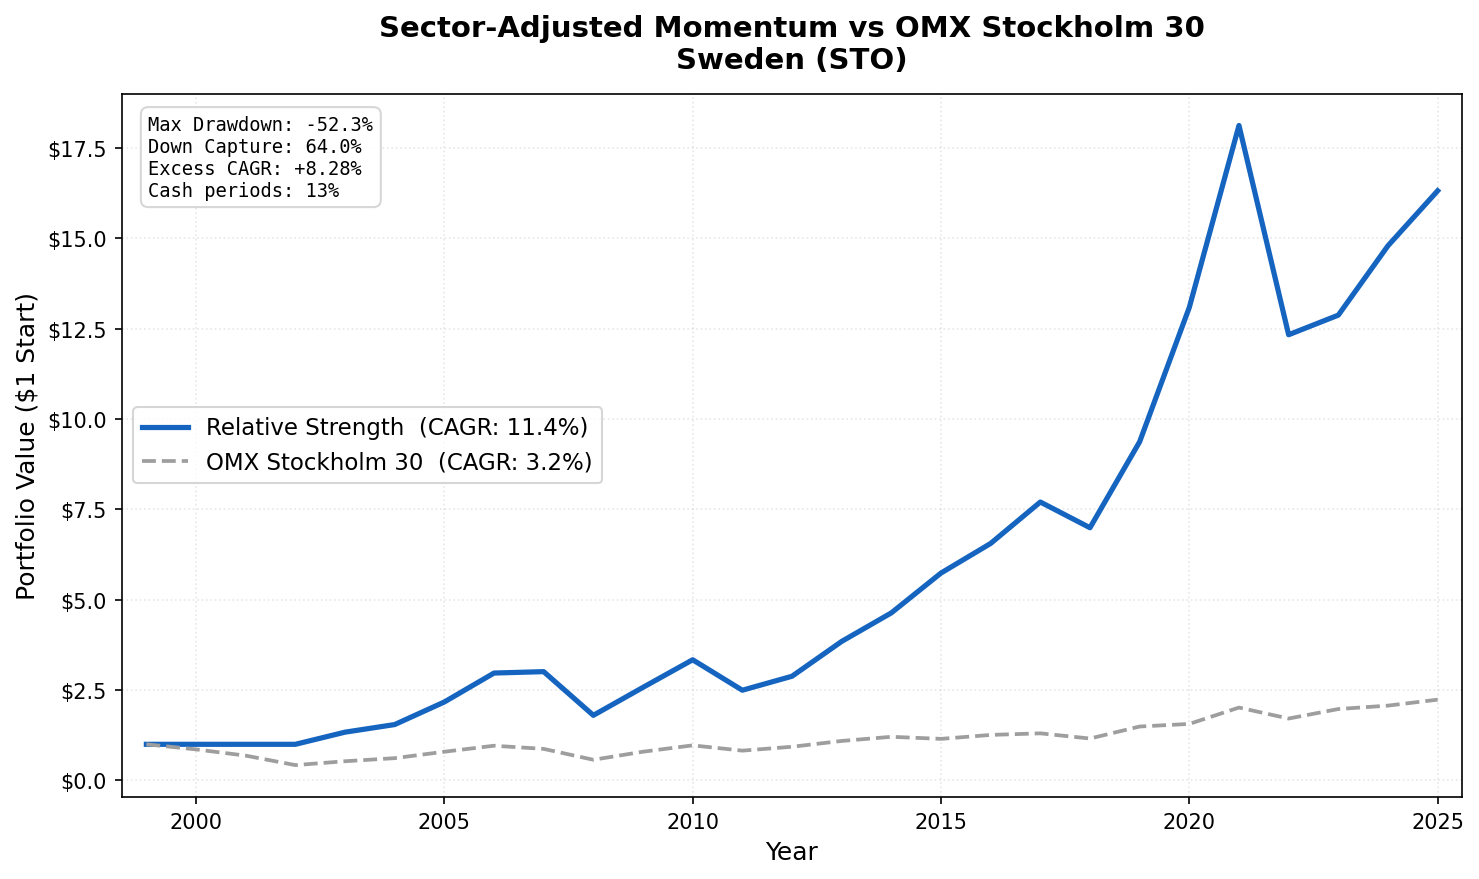
13 of 103 quarters were cash periods, almost all between 2000 and 2002 when fewer Swedish companies cleared the market cap threshold.
Performance
| Metric | Strategy | OMX Stockholm 30 |
|---|---|---|
| CAGR (2000-2025) | 11.45% | 3.17% |
| Excess CAGR | +8.28% | N/A |
| Sharpe Ratio | 0.457 | 0.06 |
| Max Drawdown | -52.32% | -66.13% |
| Annualized Volatility | 20.69% | N/A |
| Down Capture | 63.97% | 100% |
| Cash Periods | 13/103 (13%) | N/A |
| Avg Stocks Held | 29.7 | N/A |
| Avg Active Sectors | 6.4 | N/A |
A krona invested in the strategy in January 2000 grew to roughly 16.3x by the end of 2025. The same krona in the OMX Stockholm 30 grew to about 2.2x. The strategy's Sharpe ratio of 0.457 is among the highest in the entire 14-market study, and its 63.97% down capture means it fell about 64 cents for every krona the index lost in bear quarters. Higher return and lower drawdown at the same time is rare.
Why Sweden Works
Two forces drive the result, and they're different from the usual sector-diversity story.
A weak local benchmark. The OMX Stockholm 30 compounded at just 3.17% a year over this period. That's a low hurdle. The Swedish large-cap index spent much of the 2000s recovering from the dot-com collapse and again from 2008, and it concentrates in a handful of industrials and financials. A strategy that ranges across the broader mid-cap universe has a lot of room to beat it.
A deep, under-covered mid-cap universe. Sweden has an unusually large number of listed industrial, engineering, and specialty companies for the size of its economy. Many trade with thin analyst coverage. That's exactly the environment where momentum signals persist: information diffuses slowly, and prices adjust over months rather than days. When you strip out the sector effect, the stock-specific momentum that remains is real and durable.
Notably, Sweden does this with only 6.4 average active sectors, fewer than India (9.5) or Germany (9.0). That cuts against the simple "more sectors is better" intuition. Sector breadth helps the signal, but for Sweden the weak benchmark and the deep mid-cap pool matter more.
The Swedish Market Context
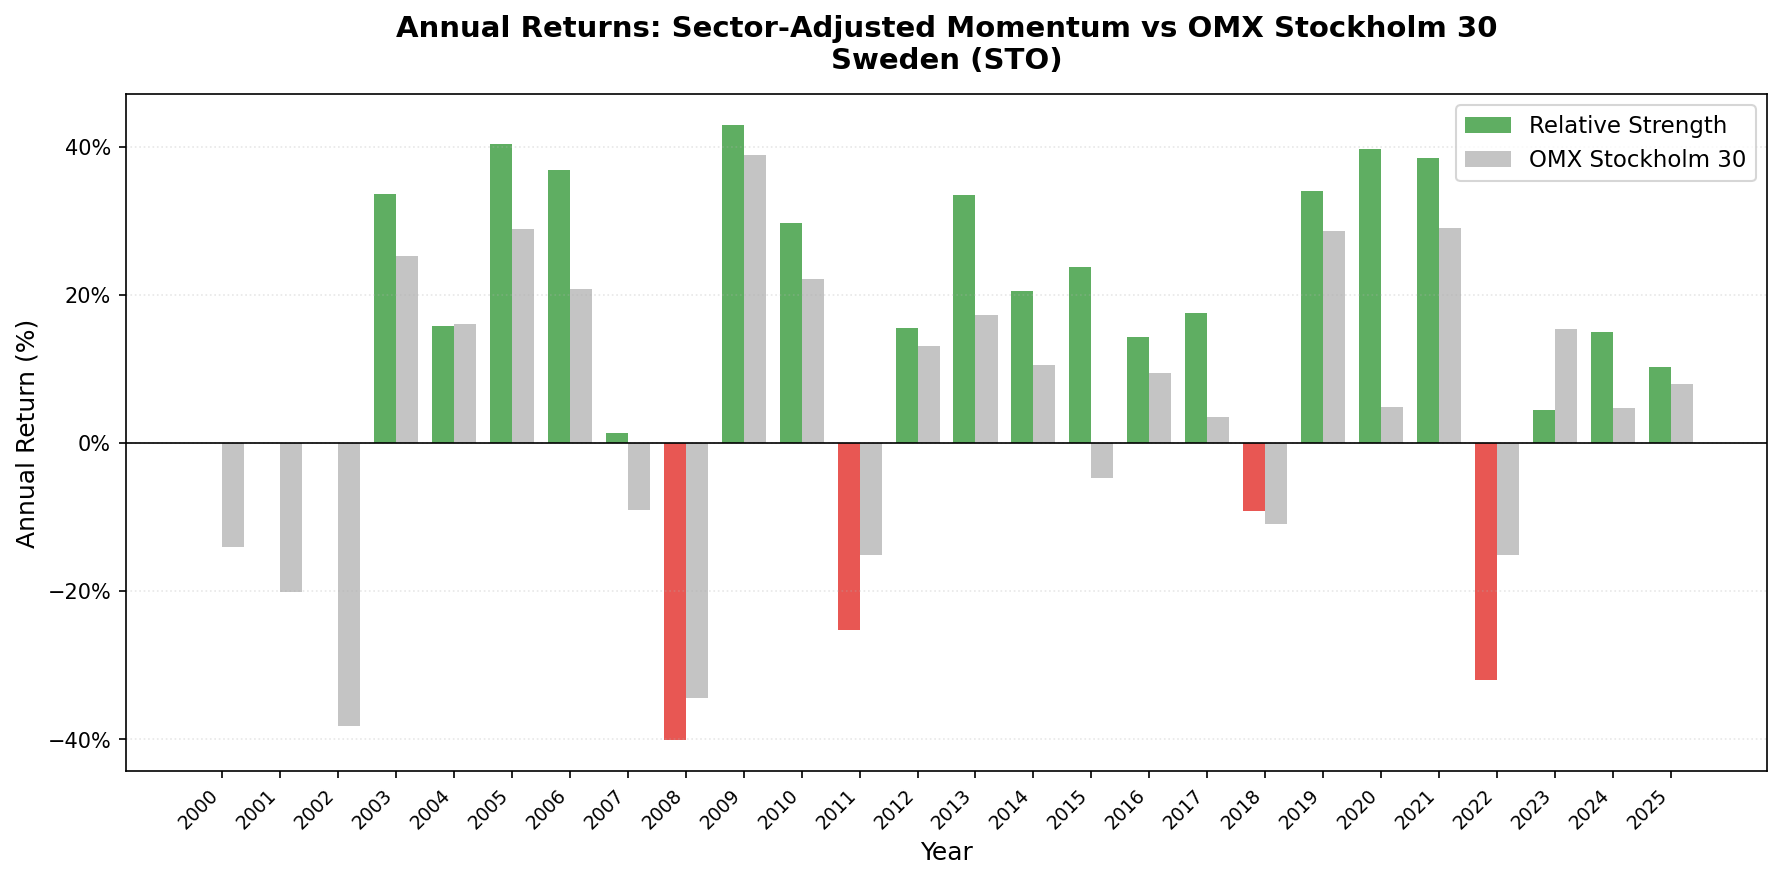
The portfolio pulls from industrials, technology, healthcare, and consumer names rather than concentrating in the index heavyweights. Over 25 years it beat the OMX Stockholm 30 in 18 of the 22 invested years, including a +34.87 point excess in 2020 and +28.51 in 2015. The weak years, 2011, 2022, and 2023, came when Swedish large-caps led and the mid-cap momentum names lagged.
The 13 cash periods (2000-2002 mainly) reflect the early-2000s market, when fewer Swedish companies cleared the SEK 5B threshold. From 2003 on, the strategy was invested almost every quarter.
The Current Screen
This SQL runs on live STO data and replicates the backtest signal.
WITH universe AS (
    SELECT p.symbol, p.companyName, p.exchange, p.sector,
           k.marketCap / 1e9 AS market_cap_billions
    FROM profile p
    JOIN key_metrics_ttm k ON p.symbol = k.symbol
    WHERE k.marketCap > 5000000000        -- SEK 5B (about $460M USD)
      AND p.isActivelyTrading = true
      AND p.sector IS NOT NULL AND p.sector != ''
      AND p.exchange = 'STO'
),
price_1m_ago AS (
    SELECT symbol, adjClose AS price_1m,
           ROW_NUMBER() OVER (PARTITION BY symbol
               ORDER BY ABS(CAST(dateEpoch AS BIGINT) -
                   CAST(EXTRACT(EPOCH FROM (CURRENT_DATE - INTERVAL '30' DAY))::BIGINT AS BIGINT))
           ) AS rn
    FROM stock_eod
    WHERE CAST(date AS DATE) BETWEEN CURRENT_DATE - INTERVAL '45' DAY AND CURRENT_DATE - INTERVAL '15' DAY
      AND adjClose > 1.0
),
price_12m_ago AS (
    SELECT symbol, adjClose AS price_12m,
           ROW_NUMBER() OVER (PARTITION BY symbol
               ORDER BY ABS(CAST(dateEpoch AS BIGINT) -
                   CAST(EXTRACT(EPOCH FROM (CURRENT_DATE - INTERVAL '365' DAY))::BIGINT AS BIGINT))
           ) AS rn
    FROM stock_eod
    WHERE CAST(date AS DATE) BETWEEN CURRENT_DATE - INTERVAL '395' DAY AND CURRENT_DATE - INTERVAL '335' DAY
      AND adjClose > 1.0
),
raw_momentum AS (
    SELECT u.symbol, u.companyName, u.exchange, u.sector, u.market_cap_billions,
           ROUND((p1m.price_1m - p12.price_12m) / p12.price_12m * 100, 1) AS raw_mom_pct
    FROM universe u
    JOIN price_12m_ago p12 ON u.symbol = p12.symbol AND p12.rn = 1
    JOIN price_1m_ago p1m  ON u.symbol = p1m.symbol  AND p1m.rn = 1
    WHERE p12.price_12m > 1.0 AND p1m.price_1m > 1.0
      AND (p1m.price_1m - p12.price_12m) / p12.price_12m <= 5.0
),
sector_avg AS (
    SELECT sector, COUNT(*) AS sector_count, AVG(raw_mom_pct) AS sector_avg_mom
    FROM raw_momentum
    GROUP BY sector
    HAVING COUNT(*) >= 5
)
SELECT m.symbol, m.companyName, m.exchange, m.sector,
       ROUND(m.market_cap_billions, 2) AS market_cap_billions,
       m.raw_mom_pct,
       ROUND(s.sector_avg_mom, 1) AS sector_avg_pct,
       ROUND(m.raw_mom_pct - s.sector_avg_mom, 1) AS relative_strength_pct,
       s.sector_count
FROM raw_momentum m
JOIN sector_avg s ON m.sector = s.sector
ORDER BY relative_strength_pct DESC
LIMIT 30
Run it on the Ceta Research Data Explorer.
Limitations
One caveat sharpens the headline. The OMX Stockholm 30 (^OMXS30) is a price index: it excludes dividends. The strategy is measured on total-return prices (adjClose), which include dividends. Swedish large-caps yield roughly 3 to 4% a year, so a dividend-inclusive benchmark would compound several points higher than 3.17%, and the true like-for-like excess would be smaller than +8.28%. The strategy still wins comfortably on a fair comparison, but the raw gap overstates it. This is a benchmark-construction issue, not a flaw in the signal, and it applies to several price-only indices in the broader study.
By the Numbers
Period: 2000-2025 (25 years, 103 quarterly periods) Strategy CAGR: 11.45% OMX Stockholm 30 benchmark CAGR: 3.17% (price index, excludes dividends) Excess CAGR: +8.28% (largest in the 14-market study) Sharpe ratio: 0.457 Max drawdown: -52.32% (vs OMX Stockholm 30 -66.13%) Down capture: 63.97% Cash periods: 13 of 103 (13%), mostly 2000-2002 Average stocks held: 29.7 of 30 target Average active sectors: 6.4
Academic Basis
Moskowitz, T. & Grinblatt, M. (1999). "Do Industries Explain Momentum?" Journal of Finance, 54(4), 1249-1290. Showed that roughly half of raw momentum profits come from industry-level trends. The RS signal isolates the stock-specific component.
Jegadeesh, N. & Titman, S. (1993). "Returns to Buying Winners and Selling Losers." Journal of Finance, 48(1), 65-91. The foundational momentum paper establishing the 12M skip-1M lookback.
Data: Ceta Research (FMP financial data warehouse). Backtest period 2000-2025 on STO (Stockholm). Past performance does not guarantee future results. This is educational content, not investment advice.

