
India Is the Exception: Deleveraging Earns +4.39% Annual Excess on

The same signal that produces a 3.78% CAGR in the US generates 12.40% in India. Down capture drops from 126% to 41%. This isn't noise, it's a structural difference in how these markets price balance sheet discipline.
Contents
- Method
- Results
- Why India Is Different
- The Highlights
- The Failures
- Recent Pattern
- Full Annual Returns
- The Screen
- Limitations
- Takeaway
One important caveat upfront: the strategy sat in cash for 22 of 103 quarters. The first invested year is 2005. From 2000 through 2004, there weren't enough Indian companies meeting both conditions to build a portfolio. So the 12.40% CAGR is built on roughly 20 of the 25 years. When it can find qualifying companies, the returns are strong. The question is whether those conditions hold going forward.
Part of the Deleveraging series. US flagship →
Method
We screen BSE and NSE stocks quarterly for two conditions:
- Debt-to-equity ratio declined by at least 10% year-over-year (annual filing data, 45-day lag)
- Return on equity above 8%
Top 30 stocks by magnitude of D/E reduction. Equal-weight, quarterly rebalance. When the qualifying universe is too thin, the portfolio moves to cash.
The ROE filter matters. Without it, the signal picks up distressed companies shedding debt because they have no choice. With it, the screen is looking for companies actively reducing leverage from a position of strength, cash flows good enough to retire borrowings while still generating real shareholder returns.
Methodology
| Parameter | Value |
|---|---|
| Universe | BSE + NSE (India) |
| Signal | D/E reduction ≥ 10% YoY + ROE > 8% |
| MCap filter | ≥ ₹20B (~$250M USD) |
| Selection | Top 30 by D/E reduction magnitude |
| Weighting | Equal weight |
| Rebalance | Quarterly |
| Filing lag | 45 days (annual data) |
| Period | Q1 2001 - Q4 2025 |
| Returns currency | INR |
Returns are in INR. The SPY benchmark is shown in USD as a global comparison reference.
Results
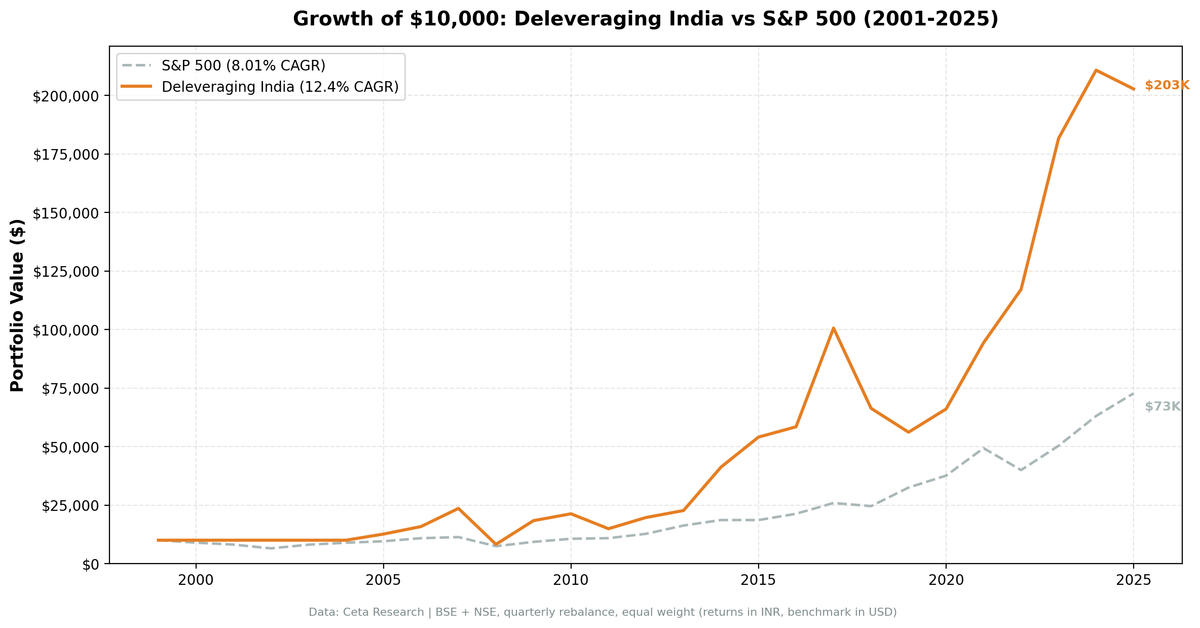
12.40% CAGR over 25 years against SPY's 8.01% USD return. +4.39% annual excess. $10,000 invested in 2001 grew to $203,000 in the portfolio versus $73,000 in SPY.
The number that tells the real story isn't the CAGR, it's down capture: 40.66%. When SPY falls 10%, this portfolio has historically fallen about 4%. That asymmetry is the mechanical engine of the outperformance. The strategy captures 106% of the upside but only 41% of the downside.
Key Performance Metrics
| Metric | Deleveraging (India) | SPY |
|---|---|---|
| CAGR | 12.40% | 8.01% |
| Excess vs SPY | +4.39% | — |
| Total Return | 1,927.27% | 627.45% |
| Max Drawdown | -67.53% | -45.53% |
| Sharpe Ratio | 0.192 | 0.089 |
| Volatility | 30.69% | — |
| Up Capture | 106.46% | 100% |
| Down Capture | 40.66% | 100% |
| Beta | 0.754 | 1.00 |
| Alpha | 4.76% | — |
| Avg Stocks (invested) | 23.1 | — |
| Cash Periods | 22 of 103 | — |
The max drawdown of -67.53% is worth pausing on. It's worse than SPY's -45.53% in absolute terms. Indian bear markets can be severe, and a 23-stock concentrated portfolio amplifies them. The combination of low down capture and 12.40% CAGR means the strategy has historically recovered quickly, but the path there is volatile.
Why India Is Different
In the US, the deleveraging signal fails because US markets are efficient. Everyone sees the same annual filings at the same time. The market reprices companies showing balance sheet improvement before a quarterly strategy can act on it.
India has different characteristics that make the signal work.
Analyst coverage on mid-cap BSE and NSE companies is thinner. Financial data reaches institutional investors more slowly and less uniformly. A mid-cap industrial in Pune paying down 15% of its debt while maintaining 12% ROE doesn't get immediately arbitraged. A quarterly rebalancing strategy running on annual filing data can still act on it before it's fully priced in.
The more important structural reason is scarcity. In India's high-growth environment, most growing companies are leveraging up to fund expansion. Debt is cheap relative to returns, and growth requires capital. Companies that manage to deleverage while maintaining ROE above 8% are doing something that requires genuine management quality. They're growing organically, either generating enough cash to fund operations internally, or disciplined enough to resist easy credit when peers are taking it.
That scarcity is what creates the alpha. In the US, many companies deleverage. In India, far fewer do while maintaining strong profitability. When you find them, the market hasn't already priced them as exceptional.
The Highlights
2007: +49.0% vs +4.4%. India's pre-crisis expansion. Companies using commodity and industrial profits to retire debt while the economy grew at 9%+. The strategy was invested in exactly the names that led the rally.
2009: +122.9% vs +24.7%. The 2008 crash was violent in both directions. After -65.1% in 2008, the recovery was explosive. Companies that survived the crisis with manageable debt loads were repriced dramatically. The +98.1% excess in 2009 nearly offset the entire prior year loss within a single year.
2014: +81.8% vs +14.5%. The BJP election year. Policy optimism drove Indian equities broadly, but the strategy's selection of capital-disciplined operators concentrated in industrials and infrastructure, the exact names that benefited from expectations of public spending and regulatory reform. A +67.4% excess in a single year.
2017: +72.2% vs +21.6%. Another year of strong Indian economic momentum, with the strategy's quality filter selecting companies that continued outperforming the broader index.
2022: +24.2% vs -19.0%. The US rate hike year. Indian companies actively reducing foreign-currency debt during a period of rupee weakness were compressing a real financial risk. While US equities fell on rising rates, Indian deleveraging companies benefited from exactly the macro backdrop the signal looks for.
2023: +55.1% vs +26.0%. Strong Indian market year. The strategy captured the bulk of the upside with the same quality filter that limits the downside.
The Failures
2008: -65.1% vs -34.3%. The worst year in the dataset. Global financial crisis hit Indian equities hard, and the portfolio's 23-stock construction amplified the damage. A -30.8% gap vs SPY. The ROE filter doesn't protect against sudden earnings collapse during a credit crisis, companies that looked profitable on trailing annual filings deteriorated faster than the data could reflect.
2011: -30.0% vs +2.5%. India's domestic inflation cycle, aggressive RBI rate hikes, and governance scandals hit mid-cap industrials exactly where the strategy's holdings clustered. A -32.4% excess in a single year.
2019: -15.4% vs +32.3%. The clearest single-year failure. US tech stocks drove SPY to strong returns while Indian markets struggled with NBFC sector stress and a slowing GDP growth trajectory. The deleveraging screen selected financial and industrial companies right at the start of a domestic credit crunch. A -47.7% gap vs SPY.
2019 is the honest stress test for this strategy. The signal can fire on companies that look like quality deleveragers on annual filings but are entering sector-specific deterioration in real time. When that coincides with a year the US market rips, the comparison looks terrible.
Recent Pattern
2022 and 2023 were the best back-to-back years in the dataset: +24.2% and +55.1%, producing +43.1% and +29.1% excess respectively. The India macro story, decoupling from US rate hike pressure, strong domestic demand, aligned perfectly with the strategy's quality filter.
2024 and 2025 reversed that. In 2024, the portfolio returned +16.04% while SPY gained +25.3%. In 2025, the portfolio fell -3.8% while SPY gained +15.3%. Two consecutive years of underperformance after two exceptional ones.
The pattern here is consistent with the strategy's long-run character: it delivers in years when the Indian market outperforms on quality fundamentals, and lags when global capital flows drive US tech to strong returns while Indian mid-caps stall. Recent performance doesn't invalidate the signal, but it demonstrates that 2022-2023 shouldn't be extrapolated.
Full Annual Returns
| Year | Portfolio | SPY | Excess |
|---|---|---|---|
| 2000 | 0.0% (cash) | -10.50% | — |
| 2001 | 0.0% (cash) | -9.17% | — |
| 2002 | 0.0% (cash) | -19.92% | — |
| 2003 | 0.0% (cash) | +24.12% | — |
| 2004 | 0.0% (cash) | +10.24% | — |
| 2005 | +26.10% | +7.17% | +18.93% |
| 2006 | +25.45% | +13.65% | +11.80% |
| 2007 | +49.02% | +4.40% | +44.62% |
| 2008 | -65.07% | -34.31% | -30.76% |
| 2009 | +122.86% | +24.73% | +98.13% |
| 2010 | +15.97% | +14.31% | +1.66% |
| 2011 | -29.96% | +2.46% | -32.42% |
| 2012 | +32.07% | +17.09% | +14.98% |
| 2013 | +15.15% | +27.77% | -12.62% |
| 2014 | +81.85% | +14.50% | +67.36% |
| 2015 | +31.11% | -0.12% | +31.23% |
| 2016 | +8.12% | +14.45% | -6.33% |
| 2017 | +72.15% | +21.64% | +50.51% |
| 2018 | -34.04% | -5.15% | -28.89% |
| 2019 | -15.41% | +32.31% | -47.73% |
| 2020 | +17.65% | +15.64% | +2.01% |
| 2021 | +42.87% | +31.26% | +11.61% |
| 2022 | +24.16% | -18.99% | +43.15% |
| 2023 | +55.07% | +26.00% | +29.07% |
| 2024 | +16.04% | +25.28% | -9.24% |
| 2025 | -3.80% | +15.34% | -19.14% |
The Screen
Run this on the Ceta Research data explorer to see current qualifying Indian stocks.
WITH current_fy AS (
 SELECT symbol, debtToEquityRatio AS de_current, date AS current_date
 FROM financial_ratios
 WHERE period = 'FY'
 AND debtToEquityRatio IS NOT NULL
 AND date >= CURRENT_DATE - INTERVAL 18 MONTH
 QUALIFY ROW_NUMBER() OVER (PARTITION BY symbol ORDER BY date DESC) = 1
),
prior_fy AS (
 SELECT symbol, debtToEquityRatio AS de_prior
 FROM financial_ratios
 WHERE period = 'FY'
 AND debtToEquityRatio IS NOT NULL
 AND date >= CURRENT_DATE - INTERVAL 30 MONTH
 AND date < CURRENT_DATE - INTERVAL 12 MONTH
 QUALIFY ROW_NUMBER() OVER (PARTITION BY symbol ORDER BY date DESC) = 1
),
km AS (
 SELECT symbol, returnOnEquityTTM AS roe, marketCap
 FROM key_metrics_ttm
)
SELECT
 c.symbol, p.companyName, p.exchange, p.sector,
 ROUND(c.de_current, 2) AS de_current,
 ROUND(pr.de_prior, 2) AS de_prior,
 ROUND((c.de_current - pr.de_prior) / pr.de_prior * 100, 1) AS de_change_pct,
 ROUND(k.roe * 100, 1) AS roe_pct,
 ROUND(k.marketCap / 1e9, 2) AS market_cap_bn
FROM current_fy c
JOIN prior_fy pr ON c.symbol = pr.symbol
JOIN km k ON c.symbol = k.symbol
JOIN profile p ON c.symbol = p.symbol
WHERE pr.de_prior > 0.1
 AND c.de_current >= 0
 AND (c.de_current - pr.de_prior) / pr.de_prior < -0.10
 AND k.roe > 0.08
 AND k.marketCap > 20000000000
 AND p.exchange IN ('BSE', 'NSE')
ORDER BY (c.de_current - pr.de_prior) / pr.de_prior ASC
LIMIT 30
Limitations
Currency risk. Returns are in INR. An investor converting to USD faces rupee depreciation on top of market risk. The long-run rupee trend against the dollar is negative, which means USD-denominated returns from Indian equities are consistently lower than INR returns. The comparison to SPY in USD understates this drag.
21% cash periods. The strategy sat out 22 quarters, mostly 2000-2004 when the Indian corporate universe was too thin to generate a qualifying portfolio. If conditions shift and fewer Indian companies combine D/E reduction with ROE above 8%, cash periods return. This isn't a set-and-forget exposure to India.
Max drawdown -67.53%. Worse than SPY in absolute terms. Indian bear markets are more severe than US ones, and a 23-stock concentrated portfolio amplifies them. The 2008 drawdown of -65.07% in a single year shows what this looks like in practice.
Annual filing lag. The 45-day lag on annual data means the signal is backward-looking. In India's less efficient market this is less damaging than in the US, but companies can still deteriorate between filings, 2019 is the clearest example.
Small universe. 23.1 average stocks when invested. Idiosyncratic risk is high. Accounting irregularities, regulatory actions, or single-sector shocks move annual returns materially.
Data starts 2005 in practice. The 12.40% CAGR is built on approximately 20 effective years, not 25. Early 2000s India market movements aren't reflected.
Takeaway
The deleveraging signal works in India. 12.40% CAGR, 40.66% down capture, +4.39% annual excess over 25 years. The structural reasons are real: thinner analyst coverage, genuine scarcity of capital-disciplined operators, and a market that reprices balance sheet improvement more slowly than the US.
The volatility is also real. -65.07% in 2008. -29.96% in 2011. -47.73% vs SPY in 2019. This isn't a smooth ride. Years like 2019 test conviction hard, and 2024-2025 show the signal isn't working right now.
The honest framing: in markets where debt discipline is scarce and markets are slower to price it, the signal earns its keep. India is the clearest case in the dataset. Same screen, same logic, different market, the theory becomes returns instead of drag.
Part of a Series: Global | US | Canada
Data: Ceta Research (FMP financial data warehouse). Backtest period Q1 2001 - Q4 2025. Returns in INR. SPY benchmark in USD for reference. Not investment advice.


