
Deleveraging as a US Stock Signal: 7.79% CAGR, Roughly Matching the S&P 500
We backtested D/E reduction with ROE > 8% on US stocks from 2000-2025. 7.79% CAGR vs 8.02% for SPY, a -0.22% annual gap. Clean data gets the signal to parity, but the real edge is abroad: +3.85% in India, +3.30% in Canada vs local benchmarks.

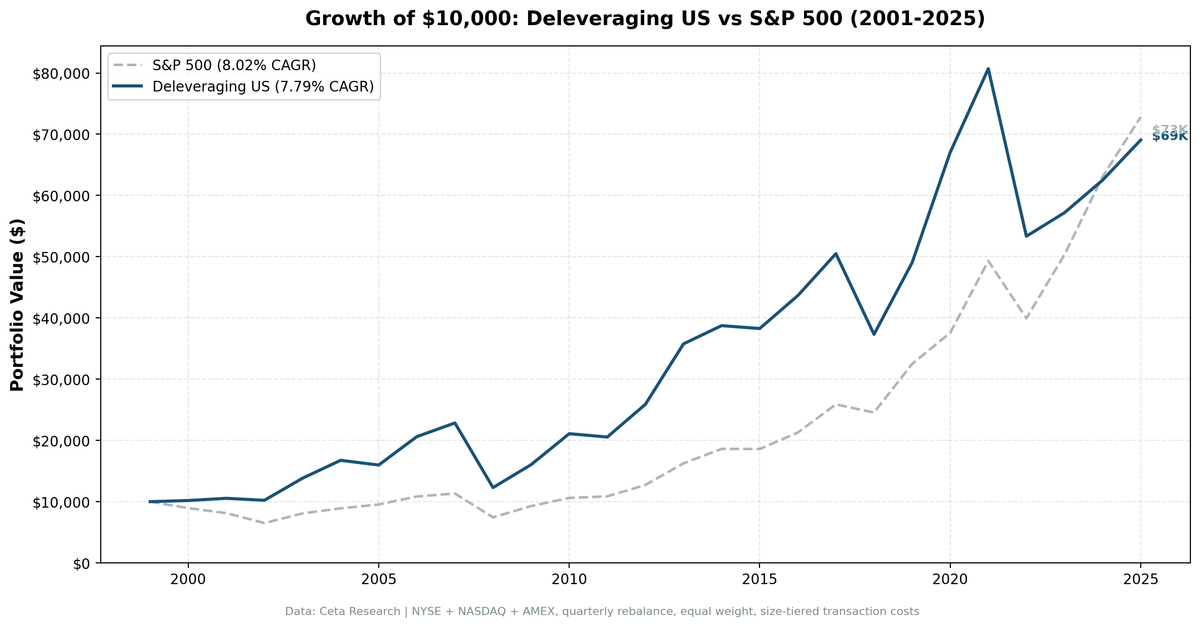
We backtested companies actively paying down debt on US stocks over 25 years. The signal produced 7.79% CAGR against SPY's 8.02%, a -0.22% annual gap. With clean data, the strategy tracks the market closely but doesn't beat it. The real edge shows up abroad, not in the US.
Contents
- Executive Summary
- Method
- The Signal: Why Deleveraging Should Work
- Results
- Data Quality Note: The FY2012 Filter
- Strong Years
- Weak Years
- Annual Returns
- The Screen
- Limitations
- Global Results
- Run It Yourself
- Takeaway
Data: FMP financial data warehouse, 2000-2025. Updated June 2026.
Executive Summary
A D/E reduction screen with a quality filter produces 7.79% CAGR against SPY's 8.02% over 2000-2025. That's a -0.22% annual gap: the strategy essentially matches the S&P 500 but lags it slightly, and does so with higher volatility (22.1% vs 16.7%) and a deeper drawdown (-53.7% vs -43.9%).
The signal is not broken. It just isn't a US outperformer. Companies reducing leverage while maintaining profitability earn their alpha in less-efficient markets measured against local benchmarks. In the US, where annual filings are priced within days, the edge is gone by the time a quarterly screen can act on it. India delivers +3.85% vs Sensex and Canada +3.30% vs the TSX Composite running the identical screen.
One thing the US result does require: filtering FMP's FY2012 data artifacts, where 29.62% of stocks reported erroneous zero D/E ratios. Without that filter the universe is contaminated and the result is worse. The filter is necessary just to reach parity with the market.
Method
We screen NYSE, NASDAQ, and AMEX stocks quarterly for companies that reduced their debt-to-equity ratio by at least 10% year-over-year compared to the prior annual filing, while maintaining a return on equity above 8% and a market cap above $1B. From the qualifying universe, we hold the top 30 stocks ranked by the magnitude of D/E reduction. Equal weight, quarterly rebalance in January, April, July, and October.
Entry and exit prices use next-day close (market-on-close execution) to avoid look-ahead bias. Financial data uses a 45-day lag on current annual filings and a 410-day lookback for the prior-year comparison, matching realistic signal availability at each rebalance date.
Methodology
| Parameter | Value |
|---|---|
| Universe | NYSE + NASDAQ + AMEX |
| Signal | D/E ratio down ≥10% YoY, prior D/E > 0.1, current D/E > 0.01 |
| Quality filter | ROE > 8%, market cap > $1B |
| Selection | Top 30 by D/E reduction magnitude |
| Weighting | Equal weight |
| Rebalance | Quarterly (Jan / Apr / Jul / Oct) |
| Execution | Next-day close (MOC) |
| Filing lag | 45 days (current FY), 410-day lookback (prior FY) |
| Benchmark | SPY (S&P 500 ETF) |
| Period | Q2 2000 - Q4 2025 (25.8 years, 103 quarters) |
The Signal: Why Deleveraging Should Work
The theory isn't subtle. Companies reducing debt are doing several things at once: improving interest coverage, reducing default risk, freeing future cash flows from debt service, and signaling that management prioritizes financial conservatism over leverage-driven growth. The ROE filter adds a quality requirement, excluding distressed firms shedding debt because creditors are forcing them to.
In classical corporate finance, reducing leverage lowers the weighted average cost of capital and raises the present value of future earnings. That should show up in stock returns.
In the US, it mostly doesn't. The signal arrives too late to trade.
Results
The full 25-year result is 7.79% CAGR. $10,000 invested grows to $69,069. SPY turns the same $10,000 into $72,829 over the same period. The strategy ends up roughly where the index does, slightly behind, after a quarter century of higher volatility.
Key Performance Metrics
| Metric | Deleveraging Strategy | SPY |
|---|---|---|
| CAGR | 7.79% | 8.02% |
| Excess vs SPY | -0.22% | - |
| Total Return | 590.69% | 628.29% |
| $10K grows to | $69,069 | $72,829 |
| Max Drawdown | -53.69% | -43.86% |
| Sharpe Ratio | 0.262 | 0.361 |
| Volatility | 22.10% | 16.68% |
| Beta | 1.14 | 1.00 |
| Alpha | -1.08% | - |
| Up Capture | 110.6% | 100% |
| Down Capture | 112.8% | 100% |
| Win Rate vs SPY | 55.34% | - |
| Avg Stocks Held | 23.7 | - |
| Cash Periods | 0 of 103 quarters | - |
The portfolio was always invested. No quarters where the screen produced fewer than 10 stocks. The up capture of 110.6% and down capture of 112.8% tell the real story: this is a higher-beta version of the market. It rises more than SPY in good quarters and falls more in bad ones, and the two roughly cancel. The Sharpe ratio of 0.262 sits below SPY's 0.361, which means the strategy delivers market-like returns with worse risk-adjusted efficiency.
Data Quality Note: The FY2012 Filter
The de_current > 0.01 filter is not optional. FMP's FY2012 financial data contains systematic errors where 29.62% of stocks reported zero D/E ratios despite having non-zero debt and equity. Without the filter, the screen treats these companies as extreme deleveragers, ranks them first, and builds a portfolio of data artifacts and distressed names with incomplete reporting.
The filter removes erroneous zero-leverage entries while preserving genuinely low-leverage companies (D/E between 0.01 and 0.10). It cleans up the universe and lifts the US result from clearly broken to roughly matching the market. It does not, on its own, turn the US into an outperformer. That's the honest read: clean data is necessary to get the signal to parity, but parity is where the US lands.
Strong Years
The strategy beat SPY in 57 of 103 quarters, a 55.3% win rate. Several years stand out:
2020: +36.8% vs +15.6%. COVID created a brief environment where balance sheet quality mattered acutely. Companies entering the crisis with declining debt loads had more financial flexibility and weren't scrambling for liquidity. A +21.1% spread.
2000-2002: Dotcom crash protection. The dotcom bust punished leveraged tech companies while older-economy businesses with declining debt looked genuinely different. 2000: +1.9% vs -10.5%. 2002: -3.0% vs -19.9%. The signal provided real downside protection during a sector-specific crash.
2010 and 2006: +17.2% and +15.4% excess. Recovery and mid-cycle years where balance-sheet-disciplined industrials and energy names led.
Weak Years
The strategy had extended underperformance, concentrated in the post-2014 tech-driven bull market:
- 2018: -26.1% vs -5.2% SPY (-20.9% excess)
- 2023: +7.2% vs +26.0% SPY (-18.8% excess)
- 2024: +9.3% vs +25.3% SPY (-16.0% excess)
- 2022: -33.9% vs -19.0% SPY (-14.9% excess)
These years reflect sector concentration in industrials and energy, which lagged tech-driven recoveries (2021, 2023, 2024) or sold off hard (2018, 2022). When debt is cheap and capital markets reward leverage, companies reducing D/E look conservative in the wrong way. The signal does better in selective or stressed markets than in broad tech-led bull runs.
Annual Returns
| Year | Strategy | SPY | Excess |
|---|---|---|---|
| 2000 | +1.88% | -10.50% | +12.38% |
| 2001 | +3.51% | -9.17% | +12.68% |
| 2002 | -3.04% | -19.92% | +16.88% |
| 2003 | +35.24% | +24.12% | +11.11% |
| 2004 | +21.13% | +10.24% | +10.90% |
| 2005 | -4.59% | +7.17% | -11.76% |
| 2006 | +29.01% | +13.65% | +15.36% |
| 2007 | +10.84% | +4.40% | +6.43% |
| 2008 | -46.20% | -34.31% | -11.89% |
| 2009 | +30.49% | +24.73% | +5.76% |
| 2010 | +31.50% | +14.31% | +17.19% |
| 2011 | -2.56% | +2.46% | -5.02% |
| 2012 | +26.00% | +17.09% | +8.91% |
| 2013 | +38.10% | +27.77% | +10.32% |
| 2014 | +8.32% | +14.50% | -6.17% |
| 2015 | -1.22% | -0.12% | -1.10% |
| 2016 | +14.04% | +14.45% | -0.42% |
| 2017 | +15.70% | +21.64% | -5.94% |
| 2018 | -26.09% | -5.15% | -20.94% |
| 2019 | +31.36% | +32.31% | -0.96% |
| 2020 | +36.75% | +15.64% | +21.11% |
| 2021 | +20.37% | +31.26% | -10.89% |
| 2022 | -33.90% | -18.99% | -14.91% |
| 2023 | +7.20% | +26.00% | -18.80% |
| 2024 | +9.31% | +25.28% | -15.98% |
| 2025 | +10.48% | +15.47% | -4.99% |
The pattern is clean: consistent outperformance from 2000 through 2013, then mostly lagging from 2014 onward as the US market rewarded growth and leverage. 2020 is the one big late-period win, driven by the COVID flight to balance-sheet quality.
The Screen
Simple version (D/E reduction only, no quality filter):
WITH current_fy AS (
    SELECT symbol, debtToEquityRatio AS de_current, date AS current_date
    FROM financial_ratios
    WHERE period = 'FY'
      AND debtToEquityRatio IS NOT NULL
      AND date >= CAST(CURRENT_DATE::DATE - INTERVAL '18 months' AS VARCHAR)
    QUALIFY ROW_NUMBER() OVER (PARTITION BY symbol ORDER BY date DESC) = 1
),
prior_fy AS (
    SELECT symbol, debtToEquityRatio AS de_prior
    FROM financial_ratios
    WHERE period = 'FY'
      AND debtToEquityRatio IS NOT NULL
      AND date >= CAST(CURRENT_DATE::DATE - INTERVAL '30 months' AS VARCHAR)
      AND date < CAST(CURRENT_DATE::DATE - INTERVAL '12 months' AS VARCHAR)
    QUALIFY ROW_NUMBER() OVER (PARTITION BY symbol ORDER BY date DESC) = 1
)
SELECT
    c.symbol,
    ROUND(c.de_current, 2) AS de_current,
    ROUND(p.de_prior, 2) AS de_prior,
    ROUND((c.de_current - p.de_prior) / p.de_prior * 100, 1) AS de_change_pct
FROM current_fy c
JOIN prior_fy p ON c.symbol = p.symbol
WHERE p.de_prior > 0.1
  AND c.de_current > 0.01
  AND (c.de_current - p.de_prior) / p.de_prior < -0.10
ORDER BY de_change_pct ASC
LIMIT 50
Advanced version (full backtest criteria with ROE, market cap, and exchange filters):
WITH current_fy AS (
    SELECT symbol, debtToEquityRatio AS de_current, date AS current_date
    FROM financial_ratios
    WHERE period = 'FY'
      AND debtToEquityRatio IS NOT NULL
      AND date >= CAST(CURRENT_DATE::DATE - INTERVAL '18 months' AS VARCHAR)
    QUALIFY ROW_NUMBER() OVER (PARTITION BY symbol ORDER BY date DESC) = 1
),
prior_fy AS (
    SELECT symbol, debtToEquityRatio AS de_prior
    FROM financial_ratios
    WHERE period = 'FY'
      AND debtToEquityRatio IS NOT NULL
      AND date >= CAST(CURRENT_DATE::DATE - INTERVAL '30 months' AS VARCHAR)
      AND date < CAST(CURRENT_DATE::DATE - INTERVAL '12 months' AS VARCHAR)
    QUALIFY ROW_NUMBER() OVER (PARTITION BY symbol ORDER BY date DESC) = 1
),
km AS (
    SELECT symbol, returnOnEquityTTM AS roe, marketCap
    FROM key_metrics_ttm
)
SELECT
    c.symbol,
    p.companyName,
    p.exchange,
    p.sector,
    ROUND(c.de_current, 2) AS de_current,
    ROUND(pr.de_prior, 2) AS de_prior,
    ROUND((c.de_current - pr.de_prior) / pr.de_prior * 100, 1) AS de_change_pct,
    ROUND(k.roe * 100, 1) AS roe_pct,
    ROUND(k.marketCap / 1e9, 2) AS market_cap_bn
FROM current_fy c
JOIN prior_fy pr ON c.symbol = pr.symbol
JOIN km k ON c.symbol = k.symbol
JOIN profile p ON c.symbol = p.symbol
WHERE pr.de_prior > 0.1
  AND c.de_current > 0.01
  AND (c.de_current - pr.de_prior) / pr.de_prior < -0.10
  AND k.roe > 0.08
  AND k.marketCap > 1000000000
  AND p.exchange IN ('NYSE', 'NASDAQ', 'AMEX')
ORDER BY (c.de_current - pr.de_prior) / pr.de_prior ASC
LIMIT 30
Run the advanced screen live: cetaresearch.com/data-explorer?q=jc1D3eHgRx
Limitations
Annual data lag. The D/E signal comes from annual filings with a 45-day lag. Companies can deteriorate substantially between filings. In an efficient market with dense analyst coverage, that lag means buying into a signal the market has already priced. This is the core reason the US result is flat.
ROE filter imprecision. ROE above 8% passes many companies where equity has been written down, temporarily inflating the metric. It's a rough quality filter, not a precise one.
Sector concentration. Companies actively reducing debt cluster in industrials, energy, and materials. The portfolio carries implicit sector bets that explain outperformance in crashes (2000-2002, 2020) and underperformance in tech rallies (2021, 2023, 2024).
Small universe. 23.7 average stocks is a concentrated portfolio. Individual position blowups move annual returns materially.
Data quality dependency. The result depends on the de_current > 0.01 filter. Without it, FY2012 errors contaminate the universe. This filter is not optional.
Global Results
The same strategy produces better outcomes outside the US. India (NSE) generates 14.97% CAGR with +3.85% excess vs Sensex. Canada adds 8.38% CAGR with +3.30% excess vs the TSX Composite. Both markets are slower to price annual balance sheet data than the US, which means the 45-day lag is less of a handicap and the signal still has room to work.
The pattern is consistent: the deleveraging signal earns its keep where information moves slowly. In the US, it doesn't. Full multi-exchange results are in the comparison blog.
Run It Yourself
The full backtest code is on GitHub: github.com/ceta-research/backtests under deleveraging/.
git clone https://github.com/ceta-research/backtests.git
cd backtests/deleveraging
pip install -r requirements.txt
python backtest.py --preset us
Takeaway
The deleveraging signal roughly matches the S&P 500 in the US. 7.79% CAGR vs SPY's 8.02%, a -0.22% annual gap, with higher volatility and a deeper drawdown. After clean data and honest execution, the US verdict is parity, not alpha.
The de_current > 0.01 filter is still essential. It lifts the result from broken to market-matching by removing FY2012 data artifacts. But clean data only gets the US to the starting line.
The edge is real, just not here. Companies that voluntarily reduce leverage while maintaining ROE above 8% outperform their local benchmarks in markets where that information takes longer to price: India, Canada, Sweden, Japan, the UK. The US is the wrong market for this signal, and the honest version of this backtest says so.
Data: Ceta Research data warehouse (FMP financial data). Backtest period 2000-2025, 103 quarters. Returns in USD. Transaction costs included (size-tiered). Not investment advice.

