
Deleveraging Tested on 13 Markets: 10 Beat Local Benchmarks, the US Only Matches It
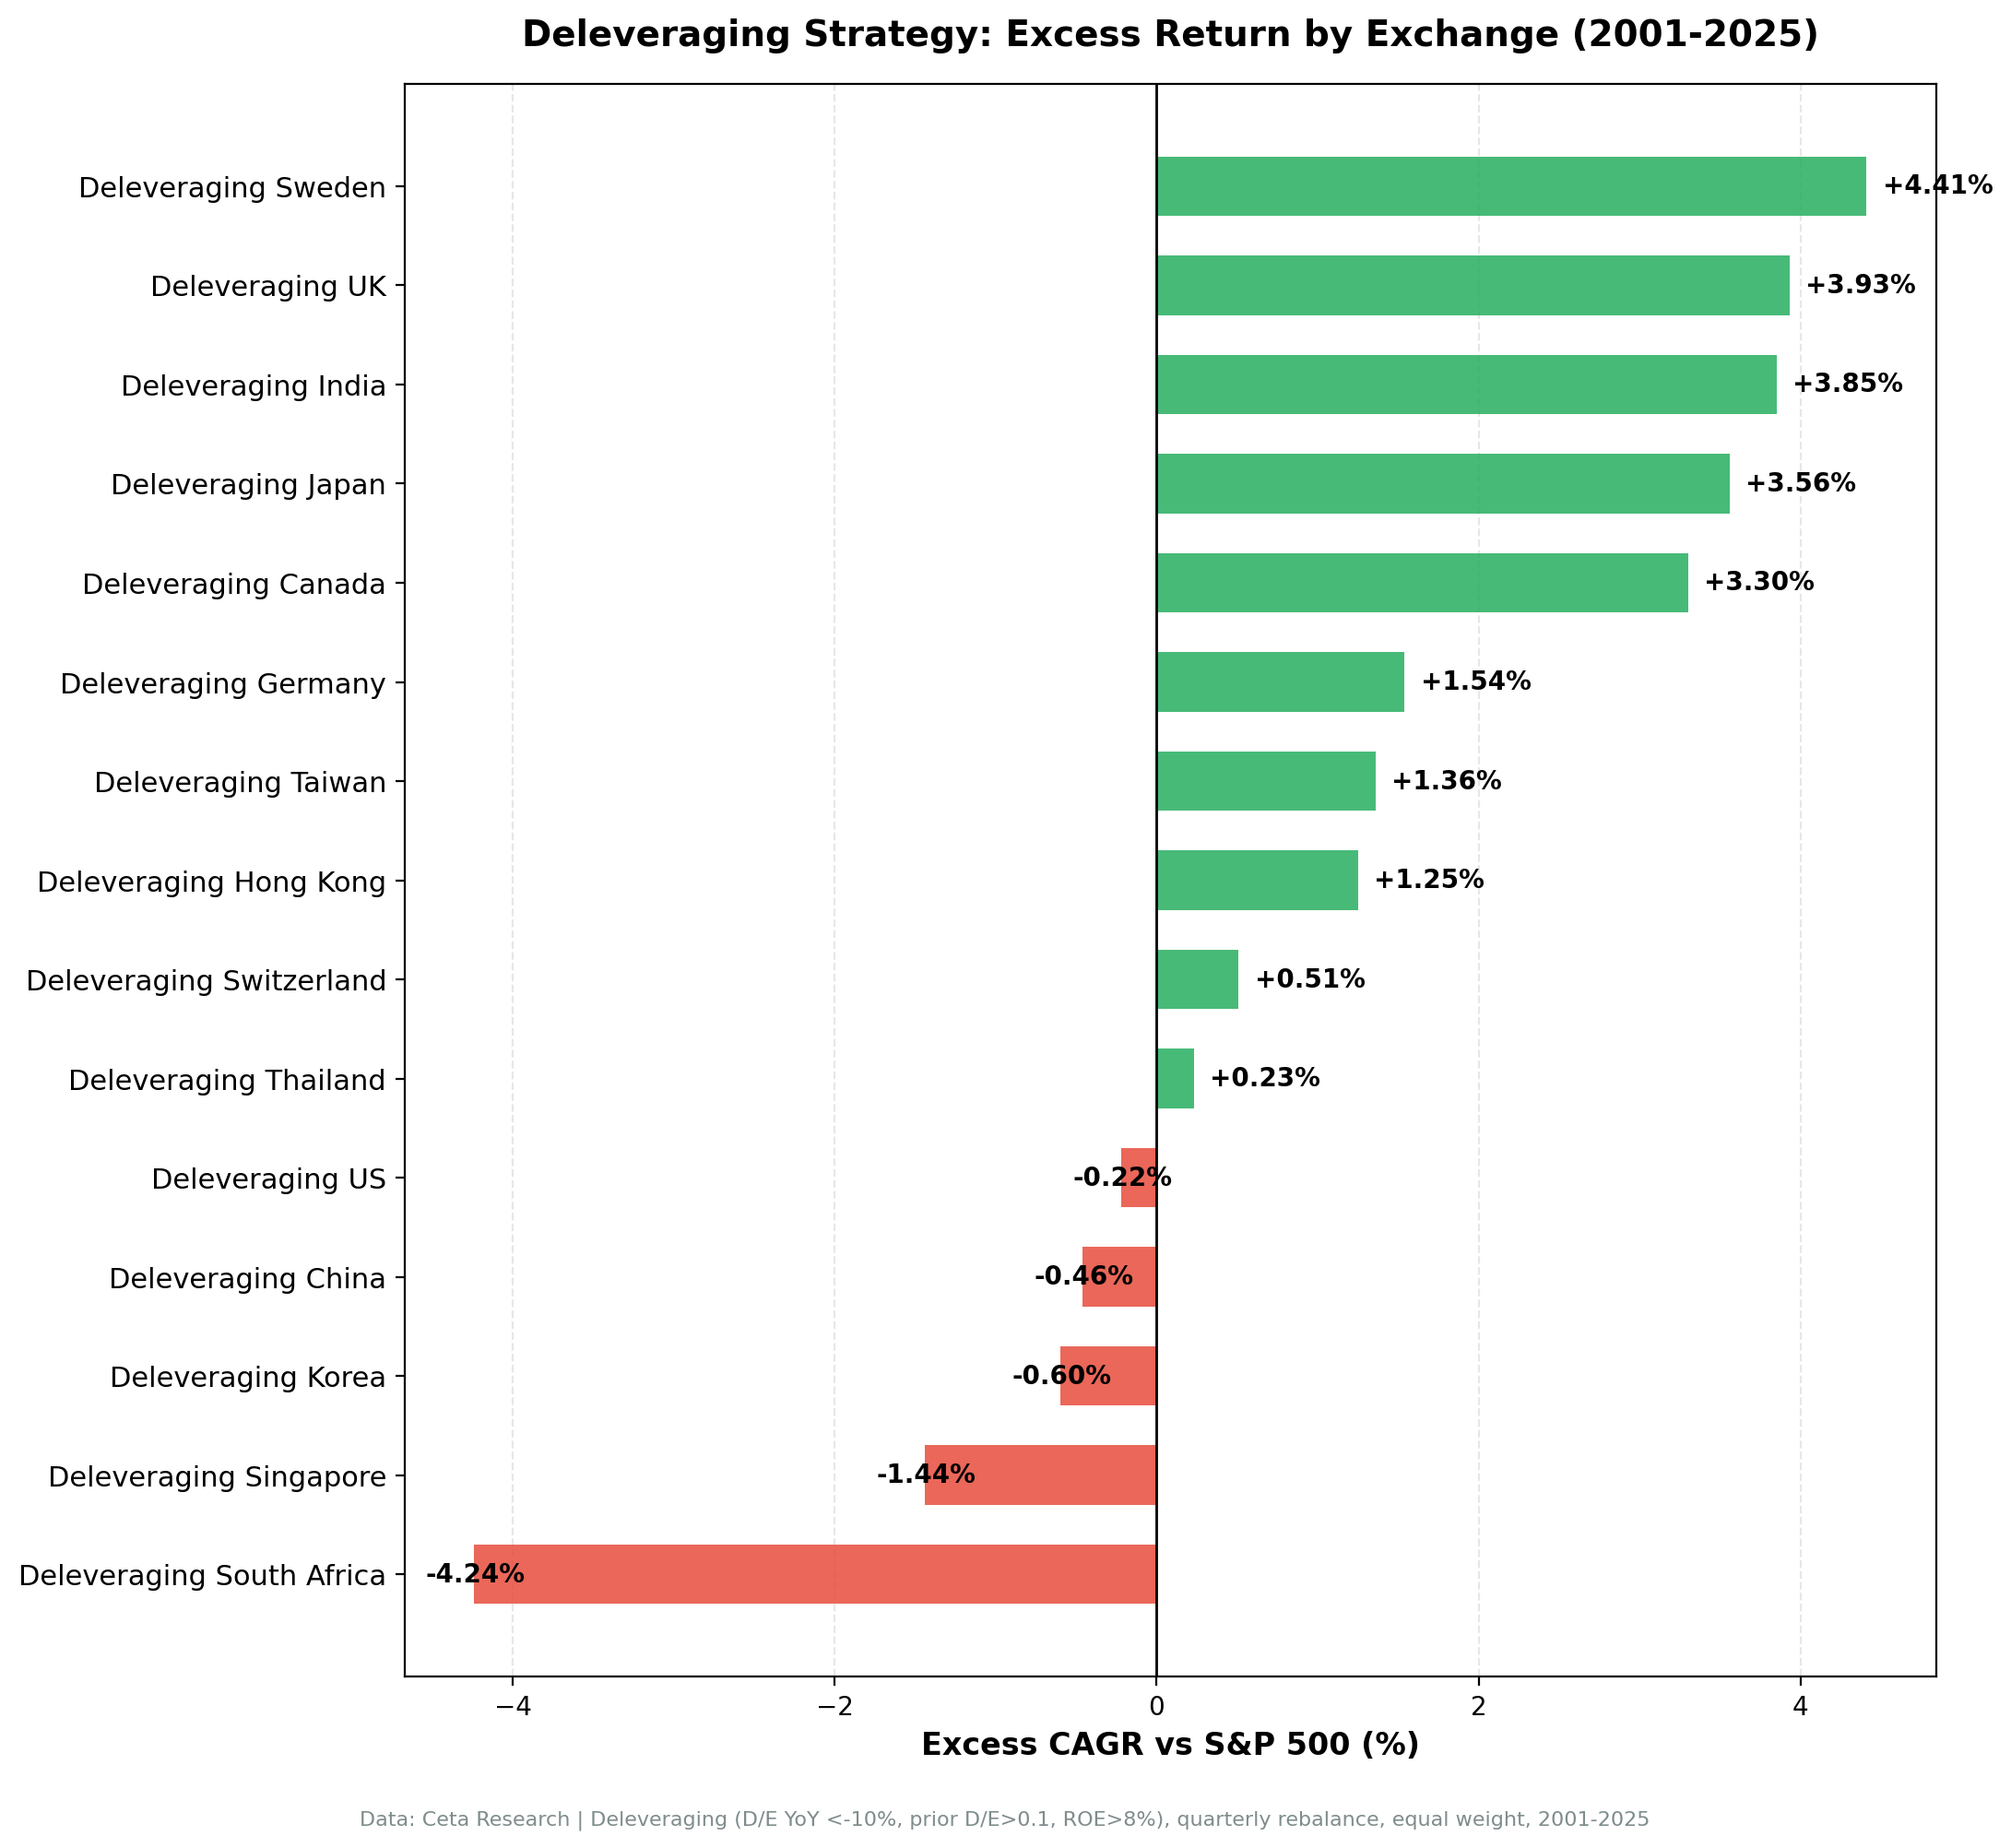
D/E reduction + ROE > 8% tested on 13 exchanges from 2000-2025. 10 of 13 beat local benchmarks: Sweden +4.41% vs OMX, UK +3.93% vs FTSE, India +3.85% vs Sensex. The US only matches SPY (-0.22%). The edge lives where information moves slowly.

Contents
- How the Strategy Works
- Full Results: 13 Exchanges (2000-2025)
- Data Quality Note: The FY2012 Filter
- The Top Performers: India and Canada
- India: 14.97% CAGR, +3.85% Excess
- Canada: 8.38% CAGR, +3.30% Excess
- US: Clean Data Reaches Parity, Not Alpha
- United States: 7.79% CAGR, -0.22% Excess
- The Middle Ground: Sweden, Japan, Germany
- UK and Hong Kong: Strong Local Edge, Thin Universes
- UK: 5.29% CAGR, +3.93% Excess vs FTSE
- Hong Kong: 3.02% CAGR, +1.25% Excess vs HSI
- Asia-Pacific: Taiwan, China, Korea, Thailand
- Check Today's Global Count
- Why the Signal Works Abroad but Not at Home
- Strategy Limitations
- What This Tells You
We ran the same deleveraging screen on 13 global stock exchanges. The signal, companies cutting their debt-to-equity ratio by 10%+ year-over-year while maintaining ROE above 8%, produced positive excess returns versus local benchmarks in 10 of the 13 markets. Only 6 of those 10 keep the edge once you allow for the dividends those price indices leave out. The three exceptions are the US, China, and Korea, where the strategy roughly matches its benchmark or lags it slightly.
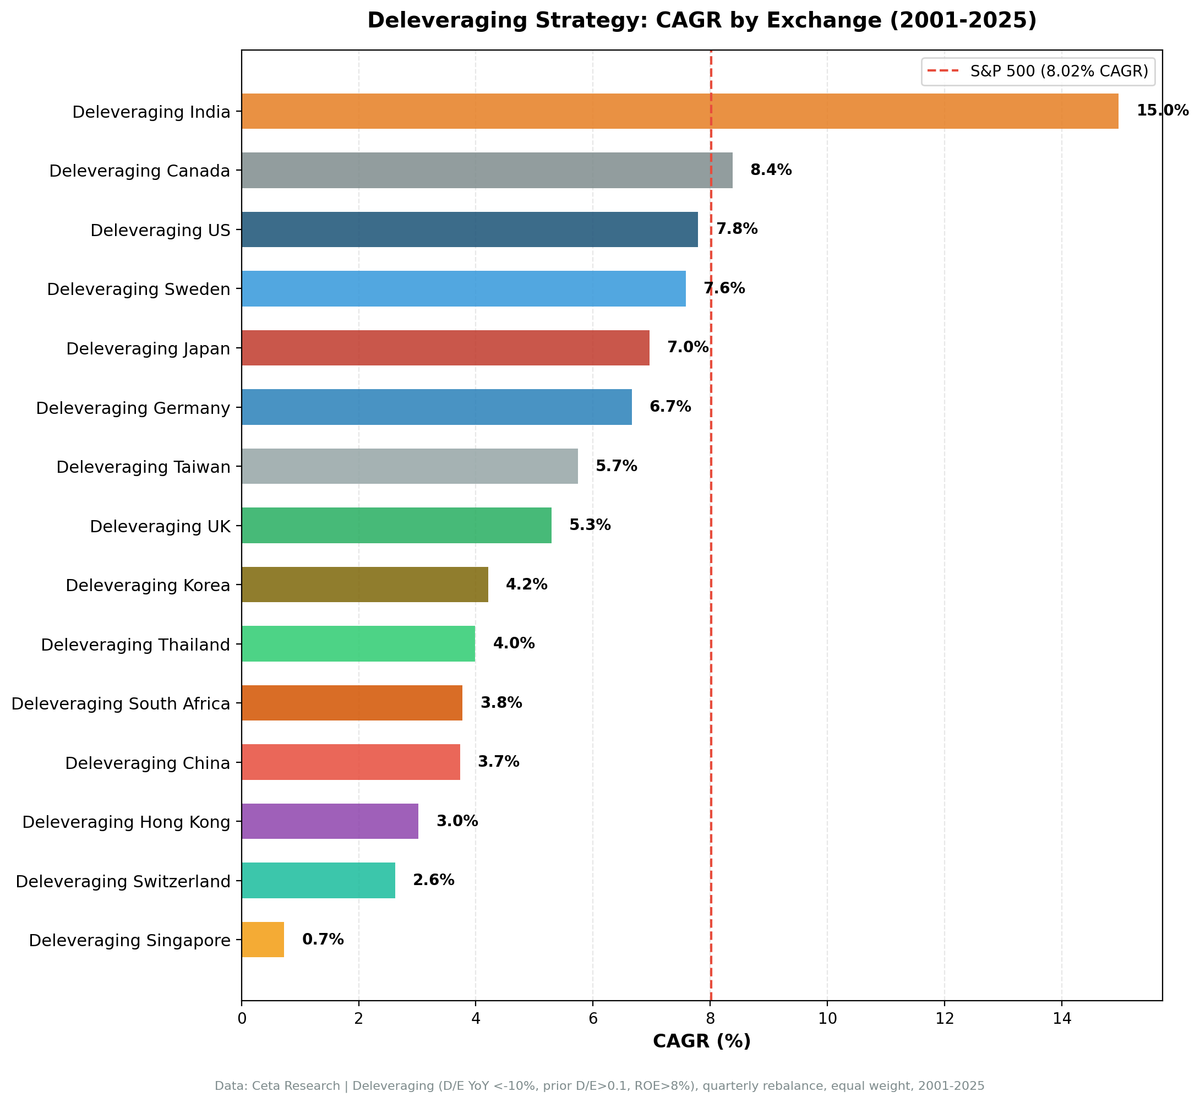
Sweden led on excess return at +4.41% vs OMX Stockholm. The UK added +3.93% vs the FTSE, India +3.85% vs the Sensex, Japan +3.56% vs the Nikkei, and Canada +3.30% vs the TSX Composite. The US posted 7.79% CAGR against SPY's 8.02%, a -0.22% gap. Same screen, same filters, different outcomes.
The pattern is not random. The signal earns alpha where information moves slowly and balance sheet discipline is scarce. It produces nothing extra in the hyper-efficient US market.
How the Strategy Works
The screen is straightforward. Each quarter, we identify companies where:
- D/E ratio declined 10%+ from the prior fiscal year
- Prior D/E > 0.1, current D/E > 0.01 (excludes erroneous zero-leverage data)
- ROE > 8% (profitability filter)
- Market cap above the exchange-appropriate threshold
We select the top 30 qualifying stocks by magnitude of D/E reduction, weight them equally, and rebalance quarterly (January, April, July, October). Entry and exit use next-day-close execution. Annual filing data with a 45-day lag prevents look-ahead bias. Transaction costs scale by market cap tier: 0.1% for large caps, 0.3% for mid, 0.5% for small.
All returns are in local currency, compared against the local benchmark. For reference, SPY returned 8.02% CAGR over the same period.
Full Results: 13 Exchanges (2000-2025)
| Exchange | CAGR | Benchmark | Excess | Sharpe | MaxDD | Cash% | Avg Stocks |
|---|---|---|---|---|---|---|---|
| India (NSE) | 14.97% | Sensex 11.12% | +3.85% | 0.282 | -67.8% | 21% | 21.6 |
| Canada (TSX) | 8.38% | TSX Comp 5.08% | +3.30% | 0.358 | -43.3% | 0% | 23.3 |
| US (NYSE+NASDAQ+AMEX) | 7.79% | SPY 8.02% | -0.22% | 0.262 | -53.7% | 0% | 23.7 |
| Sweden (STO) | 7.58% | OMX 3.17% | +4.41% | 0.276 | -59.9% | 13% | 19.6 |
| Japan (JPX) | 6.96% | Nikkei 3.40% | +3.56% | 0.318 | -59.1% | 7% | 25.4 |
| Germany (XETRA) | 6.66% | DAX 5.12% | +1.54% | 0.210 | -60.9% | 0% | 15.8 |
| Taiwan (TAI+TWO) | 5.74% | TAIEX 4.38% | +1.36% | 0.253 | -57.0% | 24% | 25.3 |
| UK (LSE) | 5.29% | FTSE 1.36% | +3.93% | 0.088 | -47.7% | 0% | 13.2 |
| Korea (KSC) | 4.21% | KOSPI 4.81% | -0.60% | 0.066 | -48.2% | 28% | 24.8 |
| Thailand (SET) | 3.99% | SET 3.76% | +0.23% | 0.067 | -52.3% | 17% | 20.7 |
| China (SHZ+SHH) | 3.73% | SSE 4.19% | -0.46% | 0.038 | -66.8% | 0% | 22.0 |
| Hong Kong (HKSE) | 3.02% | HSI 1.77% | +1.25% | 0.001 | -67.7% | 0% | 16.9 |
| Switzerland (SIX) | 2.62% | SMI 2.10% | +0.51% | 0.101 | -75.2% | 0% | 13.6 |
Note: Excess measured vs local benchmark (not SPY). Local currency returns.
Data: Ceta Research (FMP financial data warehouse). Transaction costs applied. Local currency returns.
Data Quality Note: The FY2012 Filter
FMP's FY2012 financial data contains systematic errors where 29.62% of stocks reported zero D/E ratios despite having non-zero debt and equity. The filter de_current > 0.01 excludes these erroneous entries. Without it, the screen treats data artifacts as extreme deleveragers, ranks them first, and contaminates the portfolio.
This filter matters most in the US. It lifts the US result from clearly broken to roughly matching the market. It does not, on its own, turn the US into an outperformer. Clean data is necessary to measure the signal honestly. What the clean measurement shows is that the US edge is parity, and the real alpha lives abroad.
The Top Performers: India and Canada
India: 14.97% CAGR, +3.85% Excess
India's excess return comes with a down capture of 77.0% vs the Sensex. When the Sensex fell in a given quarter, the Indian portfolio fell about 77 cents on the dollar while up capture stayed above 100%. That asymmetry compounds into a +3.85% annual edge.
Why does the signal work here? Indian capital markets are less informationally efficient than the US or UK. When an Indian company publishes results showing 10%+ D/E reduction alongside maintained profitability, that information takes time to price fully. The stock continues re-rating for quarters after the filing. In New York or London, the same information is absorbed within days.
Indian companies also carry higher baseline leverage than Western peers, and debt access is more constrained. A company that cuts its D/E ratio while maintaining ROE above 8% is demonstrating real operational discipline, not just riding a rate cycle. Markets there reward that discipline with a slower, more durable re-rating.
The 21% cash rate (roughly 5 years in cash over the 25-year period) reflects periods where the qualifying universe was too thin. The long-run CAGR holds up despite those gaps. For a dedicated analysis, see our India Deleveraging backtest post.
Canada: 8.38% CAGR, +3.30% Excess
Canada has the best risk-adjusted metrics of any market. The TSX is heavily weighted toward resource companies and financials, sectors where balance sheet health gets close scrutiny from both equity and debt investors. A resource company that reduces its D/E ratio during a commodity downturn is signaling operational resilience that the market prices in over time.
Canada's 0% cash rate means the strategy stayed fully invested for the entire period. The Sharpe ratio of 0.358 is the best of any market in this analysis, more than double the TSX Composite's 0.166. The down capture of 65.7% and beta of 0.84 show capital protection working as intended: the portfolio absorbed about two-thirds of every benchmark drawdown. That's the whole premise of a deleveraging strategy, and Canada is where it delivers most consistently.
For a full breakdown, see our Canada Deleveraging backtest post.
US: Clean Data Reaches Parity, Not Alpha
United States: 7.79% CAGR, -0.22% Excess
The US is the cautionary tale. With the de_current > 0.01 filter applied, the strategy produces 7.79% CAGR against SPY's 8.02%, essentially matching the market and lagging by a fraction. Up capture is 110.6% and down capture is 112.8%, which means the portfolio is a higher-beta version of the index: more up and more down, netting to roughly SPY with a worse Sharpe ratio (0.262 vs 0.361).
The reason is efficiency. US annual filings are covered by hundreds of analysts and priced within days. By the time a quarterly screen acts on a deleveraging signal, the re-rating is complete. What's left is sector risk, concentrated in industrials and energy, which explains both the dotcom-era outperformance and the post-2014 underperformance.
The US signal does not beat SPY. The honest read is parity. For detailed US results, see our US Deleveraging backtest post.
The Middle Ground: Sweden, Japan, Germany
These markets show CAGRs between 6-8% with meaningful positive excess vs their local benchmarks.
Sweden (+4.41% vs OMX): 7.58% CAGR, Sharpe 0.276, 13% cash. The strongest excess return in the dataset. When a Swedish company genuinely reduces leverage, the market takes time to price it because analysts aren't watching as closely as in the US. That delay creates the alpha window.
Japan (+3.56% vs Nikkei): 6.96% CAGR, Sharpe 0.318, 7% cash. Corporate deleveraging has been a structural theme in Japan since the early 2000s, as companies cleaned up post-bubble balance sheets. The Nikkei's low long-run CAGR (3.40%) amplifies the relative edge.
Germany (+1.54% vs DAX): 6.66% CAGR, Sharpe 0.210, 0% cash. German industrial companies operate in a culture where conservative financing is standard, so the signal selects from an already-disciplined pool. The edge is smaller but persistent.
UK and Hong Kong: Strong Local Edge, Thin Universes
UK: 5.29% CAGR, +3.93% Excess vs FTSE
The UK shows strong excess vs its local FTSE benchmark, which has had a very low long-run CAGR (1.36%). The Sharpe ratio of 0.088 is barely positive, and 13.2 average stocks is thin for a large developed market, so idiosyncratic risk is high and the results are less statistically reliable. The UK is best treated as a solid positive signal in local terms with a small, noisy portfolio.
Hong Kong: 3.02% CAGR, +1.25% Excess vs HSI
Hong Kong shows positive excess vs the Hang Seng, but the Sharpe of 0.001 and down capture of 101.4% mean this is a volatile, drawdown-heavy strategy that barely clears its benchmark. The HKSE's concentration of state-linked Chinese enterprises and exposure to mainland policy make it a complex environment. The positive excess is real but thin.
Asia-Pacific: Taiwan, China, Korea, Thailand
Taiwan (+1.36% vs TAIEX): 5.74% CAGR, Sharpe 0.253, 24% cash. Positive excess with significant cash periods reflecting a thinner qualifying universe.
China (-0.46% vs SSE): 3.73% CAGR, Sharpe 0.038. China lags its local benchmark slightly. The SSE's volatility and policy-driven cycles overwhelm the signal, and the strategy ends up marginally behind.
Korea (-0.60% vs KOSPI): 4.21% CAGR, 28% cash. Korea's chaebols, the structurally leveraged conglomerates that dominate the KSC, consistently fail the D/E reduction filter. The strategy sits in cash 28% of the time and lands just behind the KOSPI when invested.
Thailand (+0.23% vs SET): 3.99% CAGR, essentially matching the SET. With 17% cash periods and 20.7 average stocks, the signal finds qualifying names but generates only a marginal edge.
Check Today's Global Count
How many stocks currently qualify across exchanges? Run the query:
WITH current_fy AS (
    SELECT symbol, debtToEquityRatio AS de_current
    FROM financial_ratios
    WHERE period = 'FY'
      AND debtToEquityRatio IS NOT NULL
      AND date >= CAST(CURRENT_DATE::DATE - INTERVAL '18 months' AS VARCHAR)
    QUALIFY ROW_NUMBER() OVER (PARTITION BY symbol ORDER BY date DESC) = 1
),
prior_fy AS (
    SELECT symbol, debtToEquityRatio AS de_prior
    FROM financial_ratios
    WHERE period = 'FY'
      AND debtToEquityRatio IS NOT NULL
      AND date >= CAST(CURRENT_DATE::DATE - INTERVAL '30 months' AS VARCHAR)
      AND date < CAST(CURRENT_DATE::DATE - INTERVAL '12 months' AS VARCHAR)
    QUALIFY ROW_NUMBER() OVER (PARTITION BY symbol ORDER BY date DESC) = 1
),
km AS (
    SELECT symbol, returnOnEquityTTM AS roe, marketCap
    FROM key_metrics_ttm
)
SELECT
    p.exchange,
    COUNT(*) AS qualifying_stocks
FROM current_fy c
JOIN prior_fy pr ON c.symbol = pr.symbol
JOIN km k ON c.symbol = k.symbol
JOIN profile p ON c.symbol = p.symbol
WHERE pr.de_prior > 0.1
  AND c.de_current > 0.01
  AND (c.de_current - pr.de_prior) / pr.de_prior < -0.10
  AND k.roe > 0.08
GROUP BY p.exchange
ORDER BY qualifying_stocks DESC
Run this query live: cetaresearch.com/data-explorer?q=9X6rtMVU-M
For the current US qualifying stock list: cetaresearch.com/data-explorer?q=jc1D3eHgRx
Why the Signal Works Abroad but Not at Home
The split between stronger and weaker performers follows a consistent pattern.
Works best where leverage discipline is scarce or slowly priced. India: debt is harder to access, and companies that earn the right to reduce it are demonstrating genuine progress. Canada: resource sector balance sheets are closely watched by credit markets. Sweden, Japan, the UK: thinner coverage means the re-rating takes quarters, not days.
Matches the market where information moves fast. The US is the clearest case. Annual filings are priced within days, so a quarterly screen captures no informational edge. The strategy ends up as a higher-beta proxy for the index.
Mixed in Asia-Pacific. Hong Kong, Taiwan, and Thailand clear their benchmarks by thin margins. China and Korea fall slightly short, dragged down by policy-driven volatility and conglomerate-dominated universes that rarely deleverage.
Quality filter is critical everywhere. The de_current > 0.01 filter removes data artifacts. The ROE > 8% filter separates voluntary deleveraging (operational strength) from forced deleveraging (distress). Both are essential for the signal to work.
Strategy Limitations
Currency differences. All returns are local currency, compared against local benchmarks. India's 14.97% in rupees includes historical rupee depreciation against the dollar. Cross-currency comparisons require adjusting for expected exchange rate trends.
Data availability varies by exchange. Earlier years (2000-2004) have thinner FMP coverage on several exchanges, particularly India. The effective backtest start with robust data is closer to 2005-2006 for some markets.
Annual filing frequency. The strategy uses annual fiscal year data with a 45-day lag. A company can deleverage in one year and re-lever the next before the screen captures the reversal.
Thin universes in small markets. Korea (28% cash), Taiwan (24%), and several others sit in cash for extended stretches. Switzerland, the UK, Germany, and Hong Kong run concentrated portfolios of 13-17 stocks, where idiosyncratic risk is high.
Three markets excluded. South Africa, Norway, and Singapore were also tested but excluded from this comparison: South Africa has no local index benchmark in the dataset, and Norway and Singapore sat in cash more than 30% of the time on universes too thin (under 12 average stocks) to draw reliable conclusions.
These benchmarks leave dividends out. Portfolio returns here use dividend-adjusted prices, so they include dividends. Most of the indices we measure against do not. The FTSE 100, Hang Seng, KOSPI, Nikkei 225, OMX Stockholm 30, Oslo All Share, SET Index, SMI, SSE Composite, STI, Sensex, TAIEX and TSX Composite are price indices, so excess return against them is overstated by roughly the local dividend yield, which has run between about 1.3% and 3.5% in these markets. Those comparisons are like for like: the S&P 500 figure runs through SPY, which is dividend-adjusted; the DAX is a performance index. Subtract the yield and only 6 of those 10 keep a positive edge. The ones that do not survive it are Taiwan, Hong Kong, Switzerland and Thailand. The UK survives by less than half a point, which is inside the noise.
What This Tells You
The deleveraging signal is a market-selection problem as much as a stock-selection one. It works where information moves slowly and debt discipline is scarce, and it adds nothing in the hyper-efficient US market.
If you're building a strategy for India, Canada, Sweden, Japan, or the UK, D/E reduction combined with an ROE filter is a real alpha source measured against local benchmarks. If you're focused on the US, the honest expectation is parity with the S&P 500, not outperformance. The data quality lesson stands: filtering erroneous zero-leverage entries is what lets you measure the signal correctly in the first place.
Data: Ceta Research (FMP financial data warehouse). Backtest period 2000-2025. Transaction costs applied. Local currency returns. Not investment advice.

