
Compounding Equity Screen: Tested, Only One Beats the Market

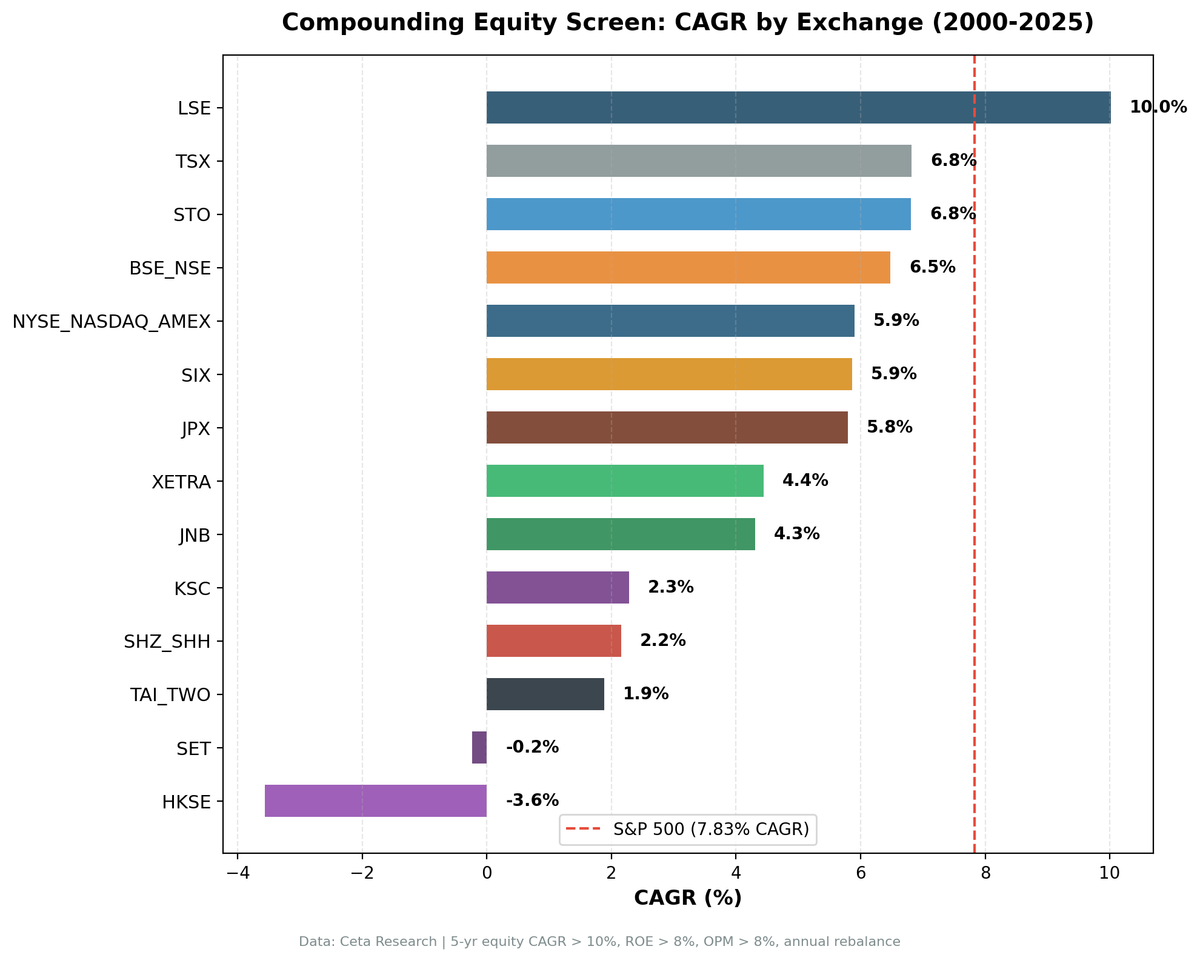
We ran the Compounding Equity Screen, 5-year shareholders' equity CAGR above 10%, Return on Equity above 8%, Operating Margin above 8%, on 14 global exchanges from 2000 to 2025. The S&P 500 returned 7.83% annually over the same period. Only one exchange outperformed it.
Contents
- Method
- Results by Exchange
- UK: The Clear Outlier
- North America: Canada Closest to Benchmark, US Underperforms
- Europe: Germany Consistent Underperformer
- Asia-Pacific: High Cash, High Variance
- The Pattern
- Run It Yourself
- Backtest
- Takeaway
- References
The UK (London Stock Exchange) delivered 10.02% CAGR with a down capture of 4.7%. The other 13 markets ranged from slightly below the benchmark to sharply negative. The spread between best and worst was 13.6 percentage points of annual return.
Method
- Data source: Ceta Research (FMP financial data warehouse)
- Universe: 14 exchanges (see table below), per-exchange market cap thresholds
- Period: 2000-2025 (25 annual rebalance periods)
- Rebalancing: Annual (July), equal weight top 30 by highest equity CAGR
- Benchmark: S&P 500 Total Return (SPY), returns in local currency
- Cash rule: Hold cash if fewer than 10 stocks qualify
- Transaction costs: Size-tiered model per exchange
- Data quality guards: Entry price > minimum per exchange, single-period return capped at 200%
Financial data uses a 45-day lag from the rebalance date for point-in-time correctness. CAGR capped at 100% to filter hyperinflation artifacts. Turkey (IST) excluded due to lira inflation distorting equity CAGR, average 64% CAGR in inspection data, rendering the signal meaningless.
Full methodology: backtests/METHODOLOGY.md
Results by Exchange
| Exchange | CAGR | vs SPY | Sharpe | Max DD | Down Capture | Cash% | Avg Stocks |
|---|---|---|---|---|---|---|---|
| LSE (UK) | 10.02% | +2.18% | 0.384 | -22.6% | 4.7% | 0% | 20.3 |
| TSX (Canada) | 6.82% | -1.01% | 0.206 | -39.9% | 44.6% | 0% | 24.1 |
| STO (Sweden) | 6.81% | -1.02% | 0.254 | -45.0% | 85.2% | 28% | 23.7 |
| BSE+NSE (India) | 6.48% | -1.35% | -0.001 | -33.6% | 6.7% | 24% | 22.9 |
| NYSE+NASDAQ+AMEX (US) | 5.90% | -1.93% | 0.190 | -38.2% | 104.9% | 0% | 26.8 |
| SIX (Switzerland) | 5.86% | -1.97% | 0.294 | -41.7% | 72.9% | 0% | 14.6 |
| JPX (Japan) | 5.80% | -2.03% | 0.277 | -50.6% | 93.3% | 20% | 25.7 |
| XETRA (Germany) | 4.44% | -3.39% | 0.140 | -48.8% | 53.3% | 0% | 19.0 |
| JNB (S. Africa) | 4.31% | -3.52% | -0.287 | -31.5% | -2.2% | 36% | 21.3 |
| KSC (Korea) | 2.28% | -5.55% | -0.057 | -31.9% | 31.2% | 44% | 27.4 |
| SHZ+SHH (China) | 2.16% | -5.67% | -0.010 | -57.8% | 44.0% | 0% | 24.6 |
| TAI+TWO (Taiwan) | 1.88% | -5.95% | 0.071 | -27.0% | 31.5% | 44% | 29.1 |
| SET (Thailand) | -0.24% | -8.07% | -0.159 | -60.3% | 60.9% | 28% | 27.2 |
| HKSE (Hong Kong) | -3.56% | -11.39% | -0.260 | -79.8% | 138.4% | 0% | 20.1 |
SPY benchmark: 7.83% CAGR, -36.3% max drawdown, 0.360 Sharpe.
Run the global qualifying stock count →
UK: The Clear Outlier
The UK result stands apart from all other exchanges on two metrics: CAGR and down capture.
10.02% CAGR. The only exchange above the S&P 500 benchmark. Thirteen of the fourteen markets tested are below it.
4.7% down capture. When the S&P 500 fell, UK equity compounders barely moved: - 2008 financial crisis: SPY -26.1%, UK equity compounders +4.4% - 2000 dot-com crash: SPY -14.8%, UK equity compounders +20.6% - 2001: SPY -20.8%, UK equity compounders +0.5%
A portfolio with 4.7% down capture and 91.5% up capture absorbs almost none of the market's losses while capturing most of the gains. Over 25 years, that compounds into a meaningful advantage.
Why does the UK work? LSE has historically been dominated by sectors where steady equity compounding is natural: consumer staples, industrials, diversified financial services, and real estate. These aren't high-multiple growth companies. They're businesses that generate consistent returns and reinvest them conservatively. The 10%+ equity CAGR signal selects the best of this group, and in UK market structure, the best of this group are genuinely defensive businesses.
See the full UK analysis: Compounding Equity Screen UK
North America: Canada Closest to Benchmark, US Underperforms
Canada (TSX) delivered 6.82% CAGR vs SPY's 7.83%, a -1.01% gap. Down capture of 44.6% suggests the strategy held mostly in bear markets, better than US (104.9%) and much better than Sweden (85.2%).
The early period was strong. Canada 2000-2007 outperformed : - 2000: +13.8% vs SPY -14.8% (+28.6% excess) - 2001: +8.9% vs SPY -20.8% (+29.7% excess) - 2004: +28.6% vs SPY +7.9% (+20.7% excess) - 2005: +33.1% vs SPY +8.9% (+24.2% excess)
The weak period was concentrated. 2008 was the worst year: -39.9% (full max drawdown hit in one year, coinciding with the commodity collapse). Post-2010, the strategy has mostly been flat-to-below benchmark.
US (NYSE+NASDAQ+AMEX) was the market most visibly damaged by the mega-cap concentration effect. In 2023, when the Magnificent Seven drove most of the S&P 500's +24.6% gain, the US equity compounder portfolio returned -5.1%, a -29.7% single-year excess deficit.
See the dedicated analyses: US | Canada
Europe: Germany Consistent Underperformer
Germany (XETRA) delivered 4.44% CAGR vs SPY's 7.83%, a -3.39% gap. The win rate of 32% means only 8 of 25 years beat the benchmark. Only one year showed significant outperformance: 2000, when the portfolio gained +39.5% while SPY fell -14.8%.
The core issue: German equity compounders in the FY data tend to be mid-cap industrial businesses in traditional manufacturing, chemicals, and engineering. When global growth slowed, these sectors fell further and recovered slower than the SPY. The portfolio held up in 2008 (down only -20.1% vs SPY -26.1%) but never built sustained alpha.
Sweden (STO) was competitive for most of the 2007-2020 period (several years with +8-20% excess) but had 7 cash periods in early years and a -45% max drawdown. The volatility is higher than comparable European markets.
See the dedicated analysis: Germany
Asia-Pacific: High Cash, High Variance
Japan (JPX): 5.80% CAGR with 5 cash periods. The 5-year equity CAGR window has more data coverage issues in Japan since annual reporting cycles and data depth start from mid-1980s but require two FY filings 4-7 years apart. The early cash periods (2000-2004) are largely data availability constraints, not strategy failures. Japan's equity compounders had solid absolute returns in recent years but couldn't overcome SPY's strong performance.
India (BSE+NSE): 6.48% CAGR with 6 cash periods, all in 2000-2005 before India's FY reporting depth was sufficient. Once invested (2006 onward), the strategy showed real resilience: in 2008 when SPY fell 26.1%, Indian equity compounders returned +2.1%, a +28.2% excess. 6.7% down capture globally. The Sharpe ratio of -0.001 is misleadingly near zero due to India's higher risk-free rate baseline (benchmark adjusted for local RFR). Absolute performance of the invested periods is better than the overall number suggests.
Korea (KSC), Taiwan (TAI+TWO): Both had 44% cash periods due to data start dates (KSC 1998, TAI 1997, need 5 years of prior data before first 5-year equity CAGR can be measured). Invested periods were mixed. Neither delivered consistent alpha.
China (SHZ+SHH): 2.16% CAGR with 57.8% maximum drawdown and 60% negative years. Two extraordinary outlier years: 2006 (+118.6%) and 2014 (+71.7%) driven by state-directed capital flows and policy cycles rather than fundamentals. The equity compounding signal didn't meaningfully differentiate Chinese companies from the broader market's boom-bust cycles.
Hong Kong (HKSE): -3.56% CAGR, -79.8% max drawdown. Three consecutive years of severe losses: 2021 (-37.9%), 2022 (-32.3%), 2023 (-30.2%). This reflects the China tech crackdown, Evergrande collapse, and property sector deterioration. The underlying quality screens (ROE > 8%, OPM > 8%) didn't protect against policy-driven sector destruction. The equity compounders in HK were concentrated in financial services and property, exactly the sectors targeted by the crackdowns.
See India analysis: India
The Pattern
The data shows a clear divide between the UK and everywhere else. What separates them?
Market structure. The UK's lack of technology mega-cap concentration means the quality compounders represent a larger portion of the market's actual returns. In the US, the Magnificent Seven now represent ~30% of the S&P 500, a portfolio of 30 quality compounders can't overcome that concentration. In the UK, no equivalent concentration exists.
Sector composition. UK equity compounders skew toward businesses with tangible assets, recurring revenues, and long operational histories. These sectors naturally produce steady book value growth without the boom-bust cycles of technology or commodities.
Crisis response. UK equity compounders didn't compound book value through leverage or expansion cycles. The companies that grew equity at 10%+ annually were genuinely reinvesting retained earnings into productive assets. When crises hit, they had no leverage to unwind and no speculative expansion to reverse. That's what a 4.7% down capture actually looks like at the company level.
The honest bottom line. We tested 14 exchanges. The signal works in one. That's not a strong result for equity compounding as a global strategy, but it's an honest one. In the UK, the signal has real predictive power. Elsewhere, structural factors (mega-cap concentration, commodity cycles, policy risk, data gaps) prevent the signal from converting into alpha.
Part of a Series: US | UK | India | Germany | Canada
Run It Yourself
Run the global qualifying stock count →
Backtest
git clone https://github.com/ceta-research/backtests.git
cd backtests

# All exchanges global run
python3 equity-growth/backtest.py --global --output results/exchange_comparison.json --verbose

# Individual exchanges
python3 equity-growth/backtest.py --preset uk
python3 equity-growth/backtest.py --preset india
python3 equity-growth/backtest.py --preset canada
Takeaway
The Compounding Equity Screen worked on one of fourteen exchanges: the UK. The strategy delivered 10.02% CAGR with 4.7% down capture, a portfolio that compounded at a premium and protected nearly everything during bear markets.
On the other thirteen exchanges, the strategy underperformed or was near benchmark, with max drawdowns ranging from -27% (Taiwan) to -80% (Hong Kong). The strongest academic basis for the signal exists, but signal-to-noise gets diluted by market structure, sector composition, and local policy factors that the equity CAGR screen can't filter.
The UK is the right market to apply this. Outside the UK, other strategies in our test suite have shown more consistent global results.
Run It Yourself
Explore the data behind this analysis on Ceta Research. Query our financial data warehouse with SQL, build custom screens, and run your own backtests across 70,000+ stocks on 20 exchanges.
Data: Ceta Research (FMP financial data warehouse), 2000-2025. Returns in local currency per exchange. Full methodology: METHODOLOGY.md. Past performance doesn't guarantee future results. This is educational content, not investment advice.
References
- Asness, C., Frazzini, A. & Pedersen, L. (2019). "Quality Minus Junk." Review of Accounting Studies, 24(1), 34-112.
- Buffett, W. (1977-2023). Berkshire Hathaway Annual Letters.
- Gordon, M. & Shapiro, E. (1956). "Capital Equipment Analysis: The Required Rate of Profit." Management Science, 3(1), 102-110.


