
Compounding Equity Screen Germany: 4.44% CAGR, Consistent

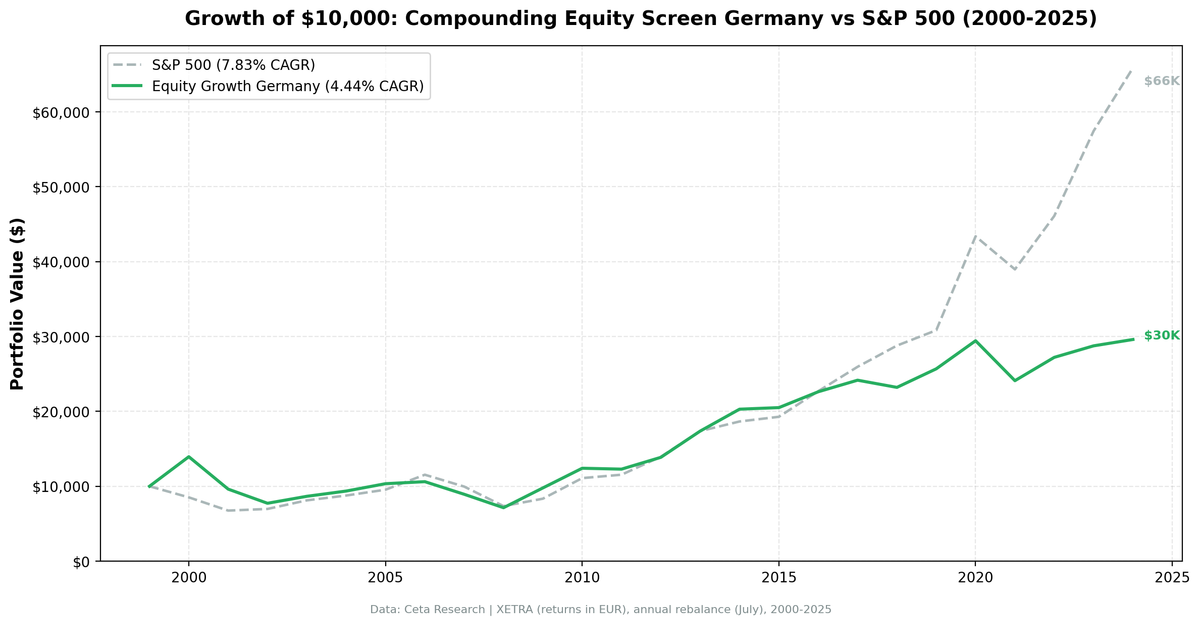
We backtested the Compounding Equity Screen on XETRA stocks from 2000 to 2025. The portfolio returned 4.44% annually vs 7.83% for the S&P 500. That -3.39% annual shortfall compounded into $10,000 becoming $29,600 vs $65,900 for the benchmark.
Contents
- Method
- Signal and Filters
- Results
- The One Good Year
- The Persistent Drag
- Full Annual Returns
- Why the Signal Struggles in Germany
- The Screen
- Limitations
- Takeaway
Germany was the weakest of the five major markets we tested. Only 8 of 25 years beat the benchmark (32% win rate). The strategy had one good year, 2000, when German equity compounders gained +39.5% while SPY fell -14.8%, and was mostly below benchmark from that point forward.
This is what honest factor analysis looks like. The equity compounding signal has a sound theoretical basis. It just doesn't translate into alpha in the German market.
Method
- Data source: Ceta Research (FMP financial data warehouse)
- Universe: XETRA (Germany), market cap > EUR 200M
- Period: 2000-2025 (25 annual rebalance periods, 0 cash)
- Rebalancing: Annual (July), equal weight top 30 by highest equity CAGR
- Benchmark: S&P 500 Total Return (SPY), returns in EUR
- Cash rule: Hold cash if fewer than 10 stocks qualify
Financial data uses a 45-day lag from the rebalance date for point-in-time correctness. Full methodology: backtests/METHODOLOGY.md
Signal and Filters
| Criterion | Metric | Threshold | Why |
|---|---|---|---|
| Value creation | Shareholders' equity CAGR (5yr) | > 10% | Core compounding signal |
| Quality overlay | Return on Equity (TTM) | > 8% | Growth from operations |
| Quality overlay | Operating Profit Margin (TTM) | > 8% | Pricing power confirmed |
| Liquidity | Market Cap | > EUR 200M | Investable universe |
Results
| Metric | Portfolio | S&P 500 |
|---|---|---|
| CAGR | 4.44% | 7.83% |
| Total Return | 196% | 559% |
| Max Drawdown | -48.8% | -36.3% |
| Volatility | 17.4% | 16.2% |
| Sharpe Ratio | 0.140 | 0.360 |
| Down Capture | 53.3% | -- |
| Up Capture | 61.6% | -- |
| Win Rate (vs SPY) | 32% | -- |
| Cash Periods | 0/25 | -- |
| Avg Stocks | 19.0 | -- |
The up capture of 61.6% and down capture of 53.3% are nearly symmetrical, the portfolio moves about 60% as much as SPY in both directions. This isn't defensive (down capture below 50%) and it's not growth (up capture above 80%). It's somewhere in the middle, generating lower absolute return than the benchmark it underperforms.
The One Good Year
2000. The Only Clear Winner:
| Year | Portfolio | S&P 500 | Excess |
|---|---|---|---|
| 2000 | +39.5% | -14.8% | +54.3% |
2000 was exceptional. German equity compounders with 5 years of consistent book value growth completely sidestepped the dot-com crash. While US tech stocks collapsed, German industrials, consumer businesses, and mid-cap manufacturers that had been quietly compounding equity at 10%+ per year barely noticed.
This single year is responsible for much of whatever favorable periods exist in the German results. If you start the backtest from 2001 onward, the picture is worse.
The Persistent Drag
After 2000, the strategy never built sustained outperformance:
2001-2003 (Post-Dot-Com Continuation):
| Year | Portfolio | S&P 500 | Excess |
|---|---|---|---|
| 2001 | -31.0% | -20.8% | -10.3% |
| 2002 | -19.6% | +3.3% | -22.9% |
| 2003 | +12.0% | +16.4% | -4.4% |
Immediately after the 2000 outperformance, German equity compounders lagged. The 2001-2002 losses suggest the portfolio had rolled into German tech-adjacent names and exporters during the portfolio formation in mid-2000, which then fell through 2001-2002.
2006-2023 (Mostly Negative Excess):
| Year | Portfolio | S&P 500 | Excess |
|---|---|---|---|
| 2006 | +2.6% | +21.0% | -18.3% |
| 2008 | -20.1% | -26.1% | +6.1% |
| 2009 | +37.0% | +13.4% | +23.6% |
| 2020 | +14.6% | +40.7% | -26.1% |
| 2023 | +5.7% | +24.6% | -19.0% |
2009 was a standout (+23.6% excess) but the post-COVID period (2020-2023) was consistently poor. German industrials and exporters were more exposed to supply chain disruptions, energy price shocks (post-Russia/Ukraine), and the deceleration of Chinese demand than US technology companies.
Full Annual Returns
| Year | Portfolio | S&P 500 | Excess |
|---|---|---|---|
| 2000 | +39.5% | -14.8% | +54.3% |
| 2001 | -31.0% | -20.8% | -10.3% |
| 2002 | -19.6% | +3.3% | -22.9% |
| 2003 | +12.0% | +16.4% | -4.4% |
| 2004 | +8.1% | +7.9% | +0.2% |
| 2005 | +10.5% | +8.9% | +1.6% |
| 2006 | +2.6% | +21.0% | -18.3% |
| 2007 | -15.9% | -13.7% | -2.2% |
| 2008 | -20.1% | -26.1% | +6.1% |
| 2009 | +37.0% | +13.4% | +23.6% |
| 2010 | +26.9% | +32.9% | -6.1% |
| 2011 | -1.0% | +4.1% | -5.1% |
| 2012 | +12.8% | +20.9% | -8.0% |
| 2013 | +25.3% | +24.5% | +0.8% |
| 2014 | +16.8% | +7.4% | +9.4% |
| 2015 | +1.0% | +3.4% | -2.3% |
| 2016 | +10.3% | +17.7% | -7.4% |
| 2017 | +6.8% | +14.3% | -7.5% |
| 2018 | -4.0% | +10.9% | -14.9% |
| 2019 | +10.7% | +7.1% | +3.6% |
| 2020 | +14.6% | +40.7% | -26.1% |
| 2021 | -18.1% | -10.2% | -7.9% |
| 2022 | +12.9% | +18.3% | -5.4% |
| 2023 | +5.7% | +24.6% | -19.0% |
| 2024 | +3.0% | +14.7% | -11.7% |
Why the Signal Struggles in Germany
1. XETRA is export-dependent. German equity compounders in the XETRA universe tend to be mid-cap industrial businesses, machinery, chemicals, automotive suppliers, specialized engineering. These companies compound book value through retained earnings from export revenues. When global trade slows (2012, 2020 supply chains, 2022-2023 China deceleration), export revenues compress and the equity growth story temporarily breaks.
2. Lower up capture than down capture. A 61.6% up capture with 53.3% down capture creates a negative asymmetry. The portfolio participates more in losses than in gains (relative to SPY). This isn't the defensive profile of the UK (91.5% up, 4.7% down), it's a portfolio that just moves less in both directions, resulting in lower absolute return.
3. The benchmark context. SPY returns measured in EUR include the USD/EUR currency effect. When the USD strengthened (particularly post-2014 and 2022), EUR-denominated SPY returns look artificially good. German stocks priced in EUR can't benefit from this. The currency adjustment inflates the apparent benchmark return from a German investor's perspective.
4. Industrial cycle exposure. The equity compounders selected by this screen in Germany are disproportionately exposed to industrial cycles. The ROE > 8% and OPM > 8% filters select industrials, not defensives. In a world where SPY returns are increasingly driven by technology, an industrial-heavy portfolio structurally underperforms.
The Screen
Run this screen live on Ceta Research →
-- (Same SQL as UK screen but filtered to XETRA and EUR 200M market cap)
 AND k.marketCap > 200000000
 AND p.exchange = 'XETRA'
Limitations
Currency effects. All returns in EUR. EUR/USD movements affect the benchmark comparison since SPY is USD-denominated. The apparent SPY outperformance is partly a currency effect.
Industrial concentration. The screen selects ~19 stocks on average from a XETRA universe that is industrials-heavy. Minimal technology exposure creates structural underperformance during tech-led markets.
Not value-trap detection. Companies can have high equity CAGR from expansion into underperforming segments. The ROE/OPM filters help, but can't distinguish between genuinely high-quality compounders and businesses that happened to have good five-year runs before deteriorating.
Takeaway
Germany delivered 4.44% CAGR, the weakest of the five major markets in our test, 3.39% below the S&P 500 annually. Only 8 of 25 years beat the benchmark. The strategy had one exceptional year (2000: +54.3% excess) and struggled thereafter.
The equity compounding signal isn't broken in Germany. It's working correctly, it's selecting real quality businesses. But those businesses (mid-cap German industrials) operate in a macro environment that structurally underperforms the US technology-heavy benchmark. That's the market structure story, not a signal failure.
For investors specifically interested in XETRA exposure, the screen at least selects quality businesses within that universe. Don't expect alpha versus the S&P 500. Do expect quality within the German market.
Part of a Series: US | UK | India | Screen Global | Canada
Run It Yourself
Explore the data behind this analysis on Ceta Research. Query our financial data warehouse with SQL, build custom screens, and run your own backtests across 70,000+ stocks on 20 exchanges.
Data: Ceta Research (FMP financial data warehouse), 2000-2025. Universe: XETRA (Germany). Returns in EUR. Full methodology: METHODOLOGY.md. Past performance doesn't guarantee future results. This is educational content, not investment advice.


