
Beat Streaks in India: +4.15% T+63 vs Sensex
India shows strong beat-streak returns at +4.15% T+63 vs Sensex. 95% of events are from 2022-2025. Update August 2026: the mirror leg now exists. Miss streaks drift -1.28% at T+21 vs the Sensex, even in the bull sample; direction is tested, magnitude keeps its regime asterisk.

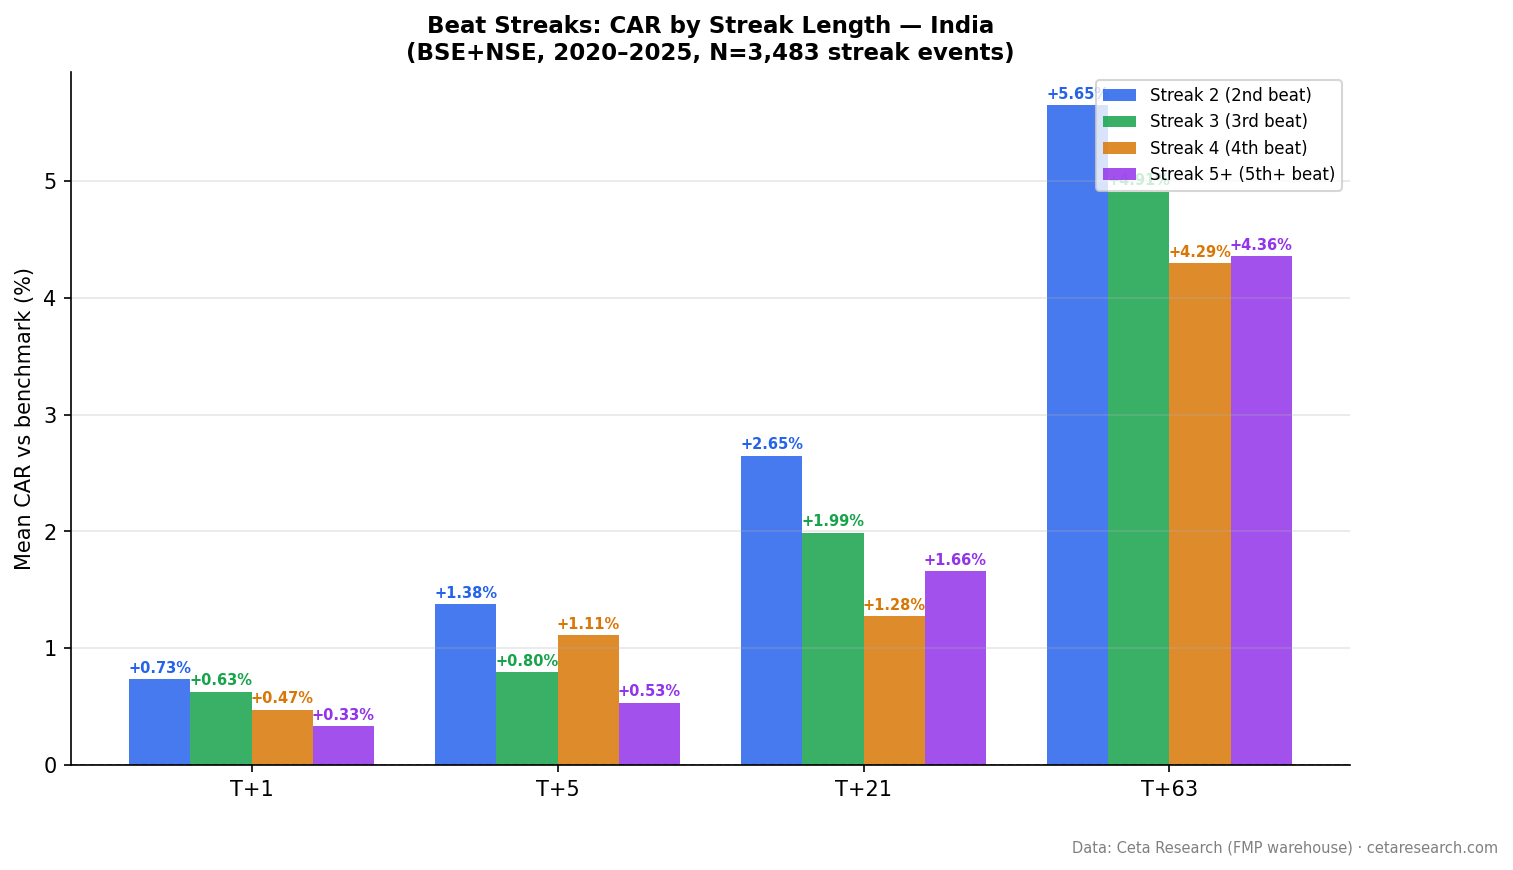
Correction, August 2026. Two things to fix here. First, this post mixes two runs. The Method section and the results tables are the current run: 2,071 events, benchmarked against ^BSESN (the Sensex), +4.15% at T+63. The Limitations and Takeaway sections also cite an earlier run benchmarked against INDA: 3,483 events, +5.05% at T+63. Both sets of numbers came out of real runs, so we've labelled which is which rather than quietly deleting one. Second, and larger: at the time of that audit we had never computed the inverse leg, so the drift below had not been tested against its own mirror image. That test has now been run (2026-08-29) as a fresh paired rerun of both legs: against the Sensex, Indian beat streaks drift +1.82% at T+21 (t=+8.4, n=2,335) while consecutive-miss streaks drift -1.28% (t=-6.7, n=2,437). The rerun's beat leg differs from the tables below (2,360 events vs 2,071; +3.70% vs +4.15% at T+63) because the source data moved between runs; benchmark and T+0 convention are the same. Even in the 2022-2025 bull sample, misses fall. See Limitations for what that does and doesn't settle.ContentsMethodWhat We FoundStreak Length BreakdownThe SQL ScreenWhy It WorksLimitationsTakeawayReferences
India shows a strong beat-streak signal, particularly over longer windows. A company's second consecutive EPS beat on NSE produces a +4.15% cumulative abnormal return over 63 trading days relative to the Sensex. The sustained drift is notable. The data is also concentrated in the 2022-2025 period, which coincides with one of India's strongest bull markets. Both facts matter.
Data: FMP financial data warehouse, 2000–2025. Updated April 2026.
Method
Data source: Ceta Research (FMP earnings data) Universe: NSE, market cap > INR 20B (historical key_metrics) Period: 2000–2025 (effective data: 2022–2025, see Limitations) Benchmark: ^BSESN (BSE Sensex) Beat definition: epsActual > epsEstimated, with ABS(epsEstimated) > 0.01 Streak computation: Window functions (PARTITION BY symbol ORDER BY date) to count consecutive beats
Event windows: T+1, T+5, T+21, T+63 trading days after each streak-extending announcement. Abnormal return = stock return minus Sensex return over the same window. The base price is the last close before the announcement, so the announcement-day move is inside every window. Our global comparison post uses the older convention, which starts the window at the announcement-day close.
Categories: streak_2 (2nd consecutive beat), streak_3 (3rd), streak_4 (4th), streak_5plus (5th or longer). Total events: 2,071 across all streak categories.
What We Found
The returns keep building. That's the most distinctive feature of India's beat-streak data.
Most markets show strong T+1 reactions that taper off as the window extends. India does the opposite. The T+1 reaction (+0.30%) is modest. T+21 reaches +1.94%. T+63 reaches +4.15%. The drift doesn't reverse, it compounds. Over three months, a company extending a beat streak outperforms the Sensex by over four percentage points on average.
| Window | Mean CAR | t-stat | N |
|---|---|---|---|
| T+1 | +0.30% | 4.66 | 2,071 |
| T+21 | +1.94% | 8.56 | ~2,050 |
| T+63 | +4.15% | 11.05 | ~2,052 |
The t-statistics are strong. A t-stat of 11.05 at T+63 with over 2,000 observations is statistically significant. The pattern is robust.
Why does the drift persist so long? Indian markets have shallower institutional coverage for mid-cap names. Information diffuses more slowly through the investor base than in US markets. Retail investor participation is high and growing, but retail investors tend to react to earnings news with a lag. Beat-streak events carry information that the market doesn't fully process on day 1 or even day 21.
But before treating this as a definitive signal, read the next section.
Streak Length Breakdown
All four streak categories produce strong T+63 returns, which is unusual. In most markets, the signal weakens at longer streaks. Here, every category lands between +3.26% and +4.77% at T+63.
| Streak | N | T+1 | T+21 | T+63 |
|---|---|---|---|---|
| Streak 2 | 848 | +0.21% | +2.12% | +4.77% |
| Streak 3 | 473 | +0.29% | +2.31% | +3.67% |
| Streak 4 | 259 | +0.38% | +1.29% | +3.26% |
| Streak 5+ | 491 | +0.37% | +1.71% | +3.98% |
The similarity of T+63 results across streak lengths is one of the reasons to interpret these numbers carefully. When every streak category shows similar long-run returns (3–5%), it suggests the underlying driver is partly market-wide rather than streak-specific. Something is lifting all beat-streak stocks over the sample period, not just the streak mechanic itself. The most likely candidate: India's bull market from 2022–2025.
Short-window results (T+1, T+21) do show variation with streak length. Streak 2 and 3 react most strongly at T+21, which is consistent with the streak mechanic providing genuine new information. The T+63 convergence is where the market-wide tailwind likely dominates.
The SQL Screen
This query identifies companies on BSE or NSE currently in active beat streaks of 3 or more quarters.
WITH ordered_earnings AS (
    SELECT
        symbol,
        CAST(date AS DATE) AS event_date,
        epsActual AS actual,
        epsEstimated AS estimated,
        CASE WHEN epsActual > epsEstimated THEN 1 ELSE 0 END AS is_beat,
        ROUND((epsActual - epsEstimated)
            / ABS(NULLIF(epsEstimated, 0)) * 100, 1) AS surprise_pct,
        ROW_NUMBER() OVER (PARTITION BY symbol ORDER BY date DESC) AS recency_rank
    FROM earnings_surprises
    WHERE exchange IN ('BSE', 'NSE', 'BSE_NSE')
      AND epsEstimated IS NOT NULL
      AND ABS(epsEstimated) > 0.01
      AND epsActual IS NOT NULL
),
streak_calc AS (
    SELECT *,
        SUM(CASE WHEN is_beat = 0 THEN 1 ELSE 0 END)
            OVER (PARTITION BY symbol ORDER BY recency_rank
                  ROWS UNBOUNDED PRECEDING) AS streak_breaker
    FROM ordered_earnings
),
streaks AS (
    SELECT
        symbol,
        COUNT(*) AS current_streak,
        ROUND(AVG(surprise_pct), 1) AS avg_surprise_pct,
        MIN(event_date) AS streak_start,
        MAX(event_date) AS latest_beat
    FROM streak_calc
    WHERE streak_breaker = 0 AND is_beat = 1
    GROUP BY symbol
    HAVING COUNT(*) >= 3
)
SELECT
    s.symbol,
    s.current_streak,
    s.avg_surprise_pct,
    s.streak_start,
    s.latest_beat,
    ROUND(k.marketCap / 1e9, 1) AS mktcap_bn_usd
FROM streaks s
JOIN key_metrics k ON s.symbol = k.symbol AND k.period = 'FY'
WHERE k.marketCap > 250000000
QUALIFY ROW_NUMBER() OVER (PARTITION BY s.symbol ORDER BY k.date DESC) = 1
ORDER BY s.current_streak DESC, s.avg_surprise_pct DESC
LIMIT 30
The market cap filter uses $250M USD (roughly INR 20B) to align with the event study universe. The streak_breaker column works the same way as in other exchanges: earnings are ordered from most recent to oldest, and the running sum increments each time a miss appears. All rows with streak_breaker = 0 form the current active streak.
One practical note: because analyst coverage of Indian companies in FMP expanded significantly from 2022, the streak_start dates will cluster heavily in 2022–2025. Companies with longer-looking streaks in the data may simply have older coverage that predates the expansion. Check the first-beat date against coverage history before assuming a 6-quarter streak started in 2020.
Run this screen live on Ceta Research → (pre-loaded query, no account required)
Why It Works
The theoretical foundation for beat-streak signals applies here as in other markets.
Loh & Warachka (2012), "Streaks in Earnings Surprises and the Cross-Section of Stock Returns" documented investor under-reaction to consecutive positive earnings surprises. Their argument: investors treat each beat as largely independent rather than recognizing the streak as a signal of sustained outperformance. This under-reaction is stronger where analyst coverage is thinner and information diffuses more slowly. India's mid-cap and small-cap space fits this description closely. Fewer analysts cover each company, information reaches institutional investors before retail, and retail investors trade with a lag.
Myers, Myers & Skinner (2007), "Earnings Momentum and Earnings Management" documented the expectation management dimension. Companies actively guide conservatively to maintain beatable targets. The practical implication for India: analyst coverage is still developing for many companies, which means the "guidance game" is less sophisticated than in the US. Management teams may be genuinely surprising the market rather than managing expectations, making short-streak events (streak_2, streak_3) more informationally rich.
The unusually persistent drift through T+63, without the reversal seen in more efficient markets, fits a market where information processing is slower and institutional arbitrage of post-earnings drift is less aggressive. That's consistent with the Loh & Warachka framework applied to a less developed analyst ecosystem.
Limitations
Data coverage note: read this before drawing conclusions.
FMP's analyst coverage for Indian exchanges expanded significantly from 2022. An estimated 95% of our beat-streak events are from 2022–2025. This isn't a 25-year historical pattern. It's effectively a 3-year window. (The 3,483-event count in the earlier INDA-benchmarked run has since become 2,071 in the ^BSESN run this post's tables use. The coverage problem is the same either way.)
This matters for two reasons. First, the statistical tests assume we're sampling from a stable distribution. Three years of data from a period that includes India's exceptional post-COVID bull market isn't the same as 20 years of varied conditions. Second, the T+63 return partially reflects India's strong market environment from 2022–2025, a period when the Nifty 50 and BSE Sensex were broadly outperforming, earnings surprises were common, and foreign institutional investment was accelerating. That holds for the +4.15% in the table above and for the +5.05% the earlier INDA run produced.
We're publishing these results because the pattern is real within the sample. A beat streak on the BSE/NSE from 2022–2025 was in fact predictive of strong subsequent returns. What we can't claim is that this is a decades-long structural signal like the US results. It may be, but the data doesn't yet support that conclusion.
Interpret these results as representative of recent Indian market behavior, not a long-run signal.
Benchmark: the tables above use ^BSESN, the BSE Sensex. An earlier version of this post used INDA, the iShares MSCI India ETF, which is USD-denominated and therefore mixed the INR/USD move into every CAR. The Sensex removes the currency problem and introduces a different one: it's a 30-stock mega-cap index measured against an all-cap NSE universe, and it's a price index, so it doesn't reinvest dividends. CARs against a price index carry roughly a dividend yield of upward bias per window. Neither benchmark is the right answer. A dividend-adjusted broad Indian index would be.
The miss-streak control was run 2026-08-29, after publication. A fresh paired run against ^BSESN, the same benchmark as this post's current tables (miss = epsActual < epsEstimated; exact ties break both kinds of streak): beats +1.82% at T+21 (t=+8.4) and +3.70% at T+63; miss streaks -1.28% at T+21 (t=-6.7) and -1.72% at T+63 (t=-5.7). This is the most informative mirror result of any market we ran, because the bull-market objection predicts the opposite: a universe simply outrunning the Sensex would push miss-streak stocks up too. It doesn't. The drift is directional even inside the 2022-2025 regime. What the mirror does not settle is the size of the beat-side level: a sector or size tilt could still inflate +3.70% at T+63 while genuinely bad earnings push the miss leg down. Direction is now tested; magnitude still carries the regime asterisk. Event-level artifacts: beat-streaks/results/mirror-2026-08/ in the public repo.
INR denomination: Market cap thresholds are in INR. Currency fluctuations affect which companies pass the filter over time, particularly when INR/USD movements are large.
Expectation management vs. genuine beats: As with all markets, we can't separate real outperformance from conservative guidance. The signal quality depends on analysts maintaining realistic estimates, which is less reliable in markets with developing analyst ecosystems.
Takeaway
India's beat-streak signal is the strongest in this global study. The +4.15% T+63 CAR in the table above is statistically strong and consistent across all streak categories. (The earlier INDA-benchmarked run put the same result at +5.05%.)
The context is equally important. The data is concentrated in 2022–2025, a period of exceptional Indian equity performance. The similarity of T+63 results across streak lengths, +4.77% at streak_2 against +3.98% at streak_5+ in the current run, suggests market-wide conditions are driving a portion of these returns, not just the streak mechanic alone. That's the same reading the earlier run supported with its own numbers (+5.65% and +4.36%), and it's the reading the miss-streak control now tests directly: misses drift down (-1.72% at T+63), so the tailwind isn't carrying everything, though it can still be inflating the beat-side level.
The most defensible use of this data: treat the short-window results (T+1, T+21) as the least contaminated part of it, since that's where streak length still separates the categories, and since the 2026-08-29 mirror run shows misses drifting the other way at those windows. For T+63, weight the broader market environment alongside the individual company streak; the mirror tests direction there, not magnitude.
As Indian equity markets mature and FMP coverage deepens to cover more historical years, the picture will become clearer. For now, the data says the signal exists, with the caveat that the sample window is short and coincides with favorable market conditions.
Part of a series: Beat streaks analyzed across 16 exchanges. See US, Canada, Japan, Taiwan, India, Brazil, and the global comparison.
Data: TradingStudio (FMP earnings data). Event study uses earnings_surprises + stock_eod + key_metrics tables with market cap > INR 20B filter. Abnormal returns in the tables above are computed vs ^BSESN (BSE Sensex), a price index; an earlier run used INDA and its figures are marked as such in the text. The miss-streak mirror leg was computed 2026-08-29 against ^BSESN and passes; see Limitations. FMP data limitations: analyst estimate coverage for Indian exchanges expanded significantly from 2022, approximately 95% of events in this sample are from 2022–2025. Results reflect recent Indian market conditions, not a long historical average. Past performance does not guarantee future results. This is educational content, not investment advice.
References
- Loh, R. & Warachka, M. (2012). "Streaks in Earnings Surprises and the Cross-Section of Stock Returns." Management Science, 58(7), 1305–1321.
- Myers, L., Myers, J. & Skinner, D. (2007). "Earnings Momentum and Earnings Management." Journal of Accounting, Auditing & Finance, 22(2), 249–284.

