
Beat Streaks Work Globally, With Exceptions: 16 Exchanges Compared
Earnings beat streaks tested across 16 exchanges, 2000-2025. 15 of 16 show positive T+21 CAR, India highest at +2.10%. Corrected August 2026: Germany and UK withdrawn as cross-listing artifacts. The 2026-08 mirror run adds the missing inverse: 9 of 10 markets pass, miss streaks drift down.

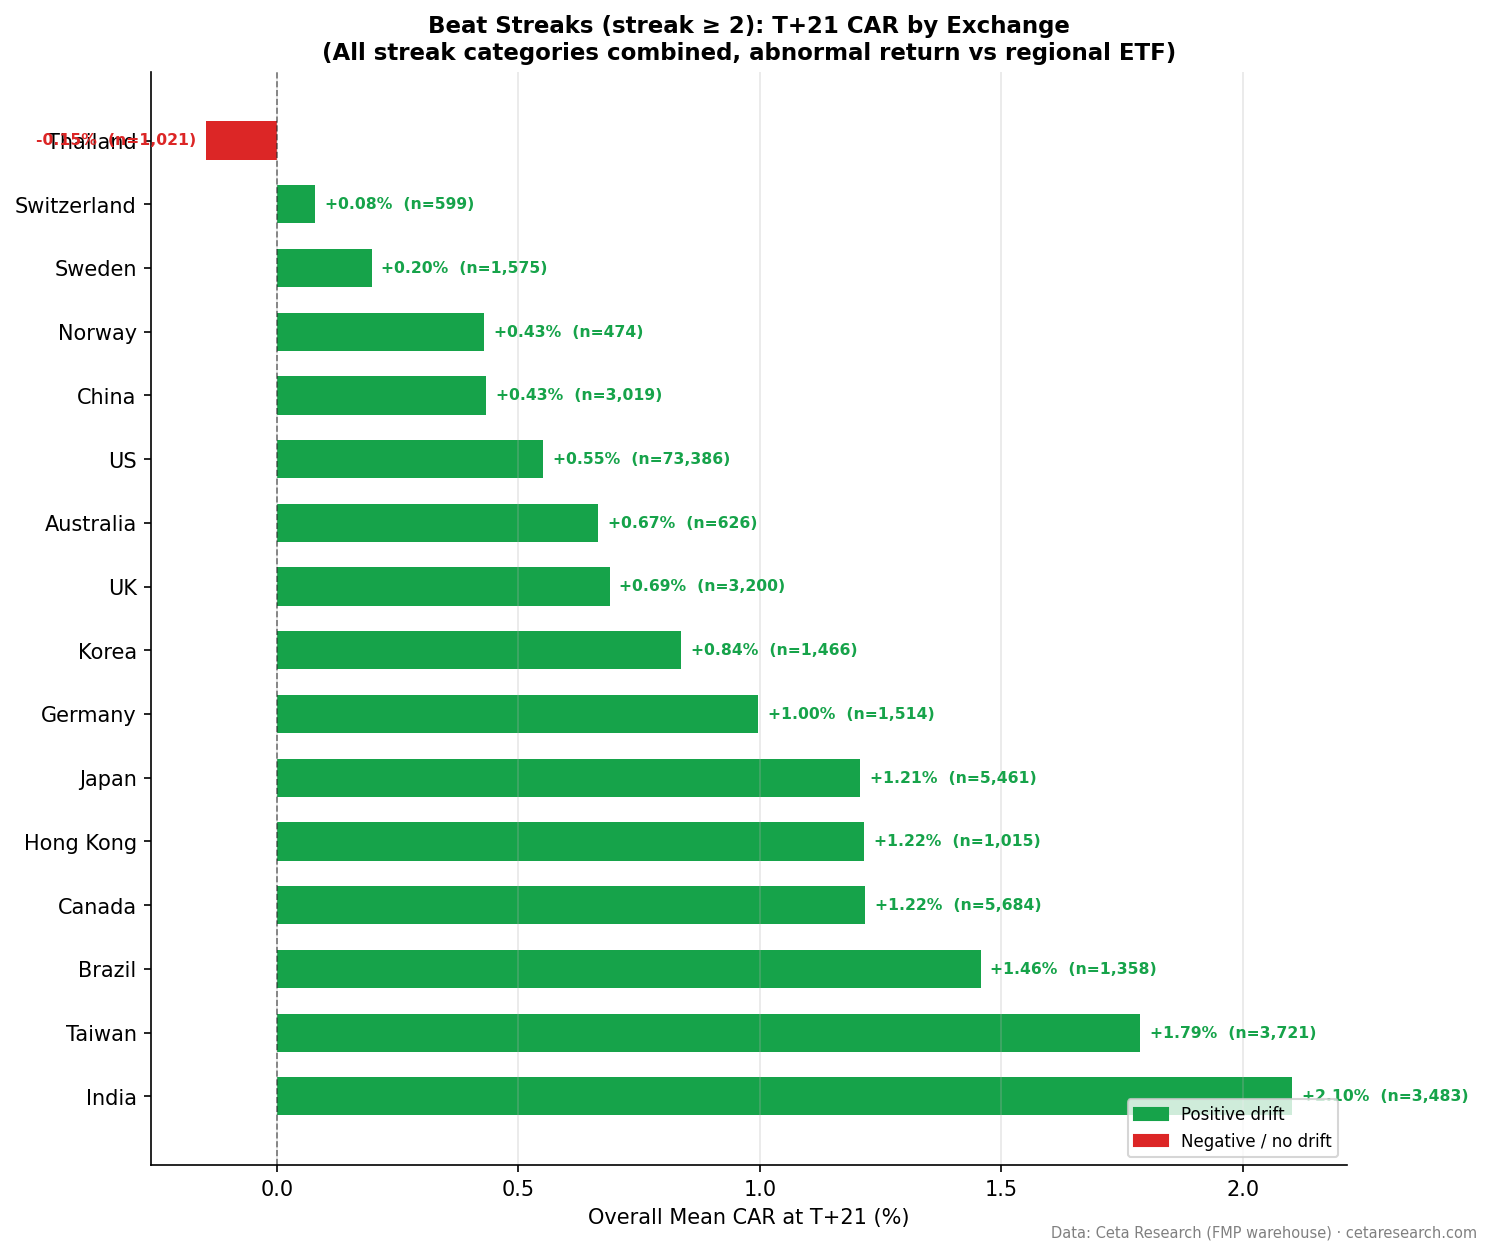
Correction, August 2026. An audit of our event studies found three problems with this post. First, the Germany and UK rows below don't measure German and British companies. Those exchange universes are majority foreign secondary listings, and once you filter to domestic companies the signal goes to zero. Both rows are withdrawn. Second, Taiwan and Thailand were benchmarked against SPY, a US index, so those two rows are a cross-market spread rather than a local abnormal return. Third, at the time of the audit we had never run the mirror test: this study measures streak-extending beats only. That gap is now closed. On 2026-08-29 we ran the inverse leg, consecutive earnings misses, as a fresh paired run on ten of these markets. Nine of ten pass: miss streaks drift down (significantly so in eight of the nine) while beat streaks drift up. China fails, and the way it fails is instructive. Full table in "The Mirror Test" section below. Every number in the original tables is unchanged from the original run. What changed is what we claim the numbers mean.ContentsThe SetupThe Global PictureWhat the Germany and UK Rows Actually MeasureThe Mirror Test (run 2026-08-29)Winners: Where Beat Streaks Work BestThe India CaveatThe Thailand Row: A Benchmark Failure, Not Counter-EvidenceThe Pattern That Holds EverywhereLimitationsTakeaway
Earnings beat streaks produce statistically significant post-announcement drift in 10 of the 16 exchanges we tested. The immediate reaction is universal. The 63-day drift is not. This is an honest look at where the signal holds, where it fades, and where it doesn't measure what the row label says.
The Setup
A beat streak is a sequence of two or more consecutive quarters where a company's reported EPS exceeds analyst estimates. We define a beat as epsActual > epsEstimated where ABS(epsEstimated) > 0.01, which filters near-zero estimates that carry no real information.
For each streak-extending announcement, we measure the cumulative abnormal return (CAR) at T+1, T+21, and T+63 trading days. CAR is the stock's return minus a regional benchmark ETF return over that window. T+0 is excluded to avoid confounding intraday moves.
Exchanges covered: US, Canada, Japan, Taiwan, India, Brazil, Hong Kong, Germany, UK, Korea, Australia, Norway, Sweden, Switzerland, China, and Thailand. Market cap floors applied per exchange in local currency. Total events: roughly 108,000 across all 16 markets.
Data: FMP financial data warehouse, 2000–2025. Updated March 2026.
The Global Picture
The T+1 reaction is positive on every exchange we tested. Every single one. Including Thailand, where the longer-term drift runs negative against SPY. That tells you something: the market's immediate recognition that a streak has extended is a global phenomenon, not a US-specific artifact.
Beyond T+1, the picture diverges. Ten exchanges show statistically significant T+21 drift at p<0.01. Four more are significant at p<0.05 or trending. Only Thailand posts negative T+21 and T+63 drift, and Thailand was measured against SPY, which is the wrong market for it.
Two of those ten significant rows, Germany and UK, are withdrawn. They measure exchange universes that are mostly not German or British. The section after the table has the split.
The big split is between markets with 20+ years of clean data versus markets where effective coverage starts post-2020. US and Canada have 25-year records. Japan runs from 2009. Everyone else varies, and for India, Germany, UK, Australia, and Hong Kong, 88 to 98 percent of events are from 2020 onward. Those results tell you about the current regime, not a structural market property.
| Exchange | Events | T+1 CAR | T+21 CAR | T+63 CAR | t(21) | Sig | Data Quality |
|---|---|---|---|---|---|---|---|
| India | 3,483 | +0.58% | +2.10% | +5.05% | 12.59 | ** | 95% from 2022+ |
| Taiwan ‡ | 3,721 | +0.49% | +1.79% | +1.20% | 9.43 | ** | 2012+ |
| Brazil | 1,358 | +0.30% | +1.46% | +2.49% | 4.88 | ** | 2015+ |
| Canada | 5,684 | +0.83% | +1.22% | +1.76% | 10.15 | ** | 2000+ (25yr) |
| Hong Kong | 1,015 | +0.69% | +1.22% | +2.84% | 3.11 | ** | 88% from 2020+ |
| Japan | 5,461 | +0.90% | +1.21% | +1.47% | 9.85 | ** | 2009+ |
| Germany † | 1,514 | +0.31% | +1.00% | +0.68% | 3.88 | ** | 96% from 2020+ |
| UK † | 3,200 | +0.44% | +0.69% | +0.53% | 4.07 | ** | 93% from 2020+ |
| Korea | 1,466 | +0.57% | +0.84% | +0.60% | 2.99 | ** | 2016+ |
| US | 73,386 | +0.52% | +0.55% | +0.31% | 14.83 | ** | 2000+ (25yr) |
| Australia | 626 | +0.24% | +0.67% | +0.93% | 1.73 | NS | 98% from 2020+ |
| Norway | 474 | +0.40% | +0.43% | +1.29% | 1.15 | NS | 2021+ |
| Sweden | 1,575 | +0.30% | +0.20% | +0.22% | 0.94 | NS | 2015+ |
| Switzerland § | 599 | +0.11% | +0.08% | +0.63% | 0.22 | NS | 2021+ |
| China ¶ | 3,019 | +0.75% | +0.43% | +1.28% | 2.01 | * | 2015+ |
| Thailand ‡ | 1,021 | +0.42% | -0.15% | -1.26% | -0.50 | NS | 2017+ |
Sig: ** = p<0.01, * = p<0.05, NS = not significant
† Withdrawn. The exchange universe is majority foreign-domiciled: 61.5% of UK events and 49.0% of German events are US companies. See the next section.
‡ Benchmarked against SPY, a US index, not a local one. Every figure in these two rows is a spread against the S&P 500 in dollars.
§ 35.7% of Swiss events are foreign-domiciled. The row's verdict doesn't change (the Swiss-only leg is also not significant), but it isn't a clean Swiss sample.
¶ Fails the 2026-08-29 mirror test: consecutive misses also drift up (+0.39%, t=3.5, against +1.27% for beats at T+21), so read this row's absolute levels as universe drift rather than an earnings reaction. The mirror run, which benchmarks the two-venue universe against the Shanghai Composite alone, shows both legs drifting up; the beat-minus-miss spread stays positive. See "The Mirror Test" section.
What the Germany and UK Rows Actually Measure
WHERE exchange = 'XETRA' selects listings, not companies. On XETRA and the LSE, that distinction is the entire result.
Of the 3,200 UK events, 19.8% belong to UK-domiciled companies. 61.5% belong to US-domiciled companies, and 90.3% of the 2,567 foreign events are 0xxx.L International Order Book lines, which are non-UK companies trading a London line in a foreign currency. Split the sample and the row falls apart: UK-domiciled events give a T+21 CAR of +0.03% with a t-stat of 0.09 on 613 events. The foreign block gives +0.87%, t=4.38. The published +0.69% is the foreign block, diluted by a flat domestic one.
Germany has the same shape. Of the 1,514 XETRA events, 28.9% are German-domiciled and 49.0% are US-domiciled. German-domiciled events give T+21 +0.10% (t=0.22) and T+63 -0.98% (t=-1.28), on 425 to 435 events depending on the window. The foreign block gives T+21 +1.36%, t=4.39.
So both rows are largely US companies' European listings scored against a country fund for a country most of those companies aren't from. That's a cross-listing artifact, not a property of the German or British market.
One limit on how far to push this. The domestic legs are flat at T+21, which is the significant headline window. At T+63 the UK domestic and foreign legs look similar and neither is significant, so T+63 carries less of the story than T+21 does.
We ran the same split on every exchange in the table.
Clean. Japan (100% home), Korea (100%), Brazil (100%), Thailand (100%), China (99.9%), India (99.8%), Sweden (98.2%), Taiwan (98.1%), Norway (98.1%), Canada (95.8%) and Hong Kong (90.4%, counting mainland Chinese issuers as domestic under the H-share convention) are domestic enough that the exchange label means what it says.
US. 83.6% US-domiciled. Splitting it makes the result stronger, not weaker: US-domiciled events give +0.61% (t=15.14, n=61,311) against +0.30% (t=3.02, n=11,990) for the rest. The ADR block dilutes the published number rather than driving it.
Switzerland. 64.3% Swiss, 35.7% foreign (US 14.5%, Germany 7.8%, France 4.2%). The Swiss-only leg is also not significant (t=1.28 at T+21, t=1.32 at T+63), so the "no signal" verdict survives, but the universe is mixed.
Australia cuts the other way. 82.4% Australian, with a foreign leg of -0.46% (t=-0.45) at T+21 pulling the pooled number down. The Australia-only leg is significant at t=2.26. The NS we published for Australia is partly a dilution artifact.
The Mirror Test (run 2026-08-29)
The original study computed one leg: what happens after a streak-extending beat. If drift after beats were just post-earnings drift, or a universe outrunning its benchmark, you'd expect drift after consecutive misses to point the same way. So we ran the mirror as a fresh paired run: beat and miss legs through the same pipeline, universes, market-cap floors and benchmarks as each other, with the event flipped to a second or later consecutive miss (epsActual < epsEstimated, strict, so an exact meet breaks both kinds of streak).
Two things to know before reading the table. This is a fresh August 2026 run, so its beat legs differ from the historical table above: it uses local benchmarks for every market (resolving the SPY rows for Taiwan and Thailand) and starts windows at the last pre-announcement close, the same convention as our dedicated US and India posts. And both legs share whatever biases the setup has: for the eight markets benchmarked to price indices (SPY and ^BVSP are total-return), ignoring dividends inflates beats and misses alike, which makes a significantly negative miss leg harder to produce, not easier.
| Market | Benchmark | Beats T+21 | t | Misses T+21 | t | Verdict |
|---|---|---|---|---|---|---|
| US | SPY | +1.05% | +26.2 | -2.31% | -25.9 | Pass |
| Canada | ^GSPTSE | +2.06% | +16.0 | -1.46% | -8.1 | Pass |
| Japan | ^N225 | +1.28% | +11.3 | -1.97% | -13.7 | Pass |
| Taiwan | ^TWII | +2.05% | +12.5 | -0.92% | -7.6 | Pass |
| India | ^BSESN | +1.82% | +8.4 | -1.28% | -6.7 | Pass |
| Thailand | ^SET.BK | +2.13% | +8.2 | -0.81% | -3.0 | Pass |
| Brazil | ^BVSP | +1.36% | +4.4 | -1.52% | -4.5 | Pass |
| Hong Kong | ^HSI | +1.60% | +4.8 | -1.01% | -3.3 | Pass |
| Korea | ^KS11 | +1.19% | +4.5 | -0.32% | -1.7 | Pass |
| China | 000001.SS | +1.27% | +7.3 | +0.39% | +3.5 | Fail |
Overall (streak >= 2) rows of the paired 2026-08-29 run. Pass = the miss leg drifts opposite to beats (or is flat); Fail = both legs significant in the same direction, the artifact signature. Miss-leg n ranges from 1,033 (Thailand) to 22,492 (US). Event-level artifacts: beat-streaks/results/mirror-2026-08/ in the public repo.
Nine of ten markets pass, most of them emphatically. US miss streaks lose 2.31% against SPY over 21 trading days (t=-25.9) and 3.16% by T+63. That is the anti-artifact pattern: the signal knows which direction the news pointed. It holds in India, where the bull-market caveat made us most suspicious, and in Thailand, whose local-index beat leg (+2.13%, t=8.2) also finally supplies what the SPY-benchmarked row couldn't: evidence that Thai beat streaks are real.
China fails the test. Beats drift +1.27% (t=7.3) and misses drift +0.39% (t=3.5) at T+21, and by T+63 it's +2.63% and +0.69%, both legs positive and significant. A universe that drifts up whether earnings beat or miss is outrunning its benchmark, not reacting to earnings. The likely mechanism is specific: the framework benchmarks the combined Shenzhen-plus-Shanghai universe against the Shanghai Composite alone (no usable Shenzhen index series in the price data), and Shenzhen skews smaller and ran harder than Shanghai over the sample. The China row in the table above should be read the way we now read pead's China numbers: the beat-minus-miss spread (+0.89pp at T+21, +1.95pp at T+63) is real signal, the absolute levels are not.
We also ran the leg the post always cited from the literature but never measured: what happens when a streak actually breaks. On US data, the first non-beat after a streak of two or more is punished immediately and keeps drifting: -1.20% at T+1 (t=-36.9), -2.70% at T+21, -3.09% at T+63 (n=17,959). That is Myers, Myers and Skinner's streak-break penalty, measured directly on our data.
Winners: Where Beat Streaks Work Best
Canada is the most credible outperformer. Five-thousand-plus events over 25 years, with T+21 drift at +1.22% and T+63 at +1.76%. The US T+63 result is +0.31%. Canada is nearly six times larger. The reason isn't mysterious: lower analyst coverage per stock, a resource-heavy sector mix where earnings are genuinely hard to forecast, and less institutional arbitrage capacity. The drift window stays open longer because fewer market participants are positioned to close it quickly.
Japan is the other long-running signal worth taking seriously. 5,461 events from 2009 onward, T+21 at +1.21%, t-stat of 9.85. Japan had a reputation for weak earnings discipline until the TSE governance reforms began in earnest. The beat streak data suggests that when Japanese companies do sustain a streak, the market is slow to reprice. Corporate governance improvements may have actually increased the signal's reliability, as genuine outperformance became easier to distinguish from managed earnings.
Taiwan stands out for a different reason: the streak length pattern. The third consecutive beat (+2.60% T+21) is the strongest streak-length result of any exchange outside India, whose second consecutive beat is higher at +2.65%. Note the caveat that Taiwan's whole row is measured against SPY, so its level isn't comparable to the locally benchmarked markets even though its internal shape is. The streak-3 peak means the market under-reacts most severely at precisely the point where the streak has been confirmed multiple times. It's the opposite of what you'd expect if investors were fully extrapolating the streak forward.
| Exchange | Streak 2 | Streak 3 | Streak 4 | Streak 5+ |
|---|---|---|---|---|
| US | +0.77% | +0.56% | +0.62% | +0.42% |
| Canada | +1.33% | +1.65% | +0.43% | +1.12% |
| Japan | +1.47% | +1.34% | +0.82% | +0.92% |
| Taiwan | +1.55% | +2.60% | +1.57% | +1.53% |
| India | +2.65% | +1.99% | +1.28% | +1.66% |
| Brazil | +1.19% | +2.53% | +1.55% | +1.06% |
T+21 CAR by streak length, selected exchanges.
The streak 3 effect in Taiwan (+2.60%), Brazil (+2.53%), and Canada (+1.65%) is notable across all three markets. The first repeat is easy to explain as a beat. The third consecutive beat carries more conviction about underlying fundamentals, and the market seems to lag in recognizing that.
The India Caveat
India's numbers are extraordinary. T+21 at +2.10%, T+63 at +5.05%, t-stat of 12.59. If those numbers are right, this is the strongest beat streak signal in the world by a wide margin.
The caveat is substantial. Ninety-five percent of India's 3,483 events are from 2022 onward. The Indian market had a prolonged bull run during that period. The +5.05% T+63 result almost certainly reflects, at least in part, the broader market tailwind rather than a clean beat-streak effect. The abnormal return calculation subtracts a benchmark, but if the benchmark itself underrepresents the domestic bull market dynamics for specific stock categories, the residual looks larger than it is.
This isn't a reason to dismiss the India result. The t-stat is 12.59. Something real is happening. But extrapolating this as a 25-year structural property of the Indian market would be wrong. It's a finding about how beat streaks behaved during one of India's strongest recent bull periods. As longer time-series data accumulates, the picture will sharpen.
For now: India is a promising signal with a data quality asterisk that matters. One more asterisk. Our dedicated India post reports +4.15% at T+63 on 2,071 events against the Sensex, not the +5.05% on 3,483 events against INDA shown here. Same market, different run, different benchmark and a different T+0 convention. The Limitations section explains the gap.
The Thailand Row: A Benchmark Failure, Not Counter-Evidence
Thailand has positive T+1 drift (+0.42%). Then the published numbers go negative: T+21 is -0.15%, T+63 is -1.26%, with a T+21 t-stat of -0.50.
The benchmark for those numbers is SPY. Thai stocks were measured against the S&P 500 in dollars, because no liquid Thai equity ETF with sufficient history was available in the framework. Taiwan was measured the same way. For Taiwan, US tech correlation makes SPY a defensible proxy. For Thailand it isn't one. The SET is domestically driven and weakly correlated with US equities, so what this row calls an abnormal return is mostly the Thailand-minus-US spread plus the THB/USD move.
We have since rerun Thailand against ^SET.BK, the local index. T+21 goes to +2.17% with a t-stat of 7.84. The sign flips. (The separate 2026-08-29 paired mirror run lands at +2.13%, t=8.2. Same picture, different vintage.)
We aren't swapping one number for the other, because that rerun changed three things at once: the benchmark (SPY to ^SET.BK), the T+0 base price (moved from the announcement-day close to the last pre-announcement close, which folds the announcement-day move into every window), and the underlying price data, which shifted event counts by as much as 22% on some exchanges. You can't attribute the flip to the benchmark alone. ^SET.BK is also a price index, so it doesn't reinvest dividends and CARs measured against it carry an upward bias of roughly the index's dividend yield pro-rated over the window.
What survives: this row is not evidence that Thai beat streaks reverse. It's evidence that Thai stocks measured against the S&P 500 in dollars lagged over the sample period. This row tells you nothing about Thai beat streaks. The 2026-08-29 paired mirror run does: Thai beats drift up (+2.13%, t=8.2) and Thai miss streaks drift down (-0.81%, t=-3.0) against ^SET.BK. See "The Mirror Test".
The Pattern That Holds Everywhere
T+1 is positive across all 16 exchanges. This is the one universal result.
It means the initial market reaction to a streak-extending beat is consistently positive regardless of exchange, region, market structure, or data quality. Even in Thailand, where longer-term drift against SPY is negative, the one-day reaction is +0.42%. Even in Sweden and Switzerland, where T+21 and T+63 show almost no signal, T+1 is +0.30% and +0.11%.
This matters for two reasons. First, it suggests the immediate price response is driven by a behavioral mechanism that applies across markets: investors are positively surprised when a streak extends, and that surprise gets priced in quickly. Second, it means short-term traders have a more reliable signal than longer-term investors, but the edge window is narrow. Earnings are announced after hours. The open the next morning is often where the move happens, and getting a fill at favorable prices is harder than the T+1 CAR implies.
The T+63 drift is where markets diverge. The US has +0.31%, compressed by institutional arbitrage. Canada has +1.76%, still building. India shows +5.05% in a regime-specific sample. And Thailand goes negative against SPY, which is the wrong benchmark for it. The longer you hold, the more the local market structure, the benchmark and the data quality determine your outcome.
Limitations
The miss-streak control was run after publication. The original design measured streak-extending beats and nothing else, which left every positive row untested against its own inverse. The 2026-08-29 mirror run (see "The Mirror Test") closes that for ten markets: nine pass, China fails. The historical table above still carries the original run's conventions, so read its rows through the mirror-test verdicts rather than as independently confirmed. The six markets we didn't pair (Germany and the UK are withdrawn; Australia, Norway, Sweden and Switzerland published no significant claim) remain untested.
Listing versus domicile. The event universe is selected by exchange code, which selects listings rather than companies. On the LSE and XETRA that breaks the row (see the section above). Switzerland is 64.3% domestic, enough to flag but not enough to change its verdict. Every other exchange in the table is 82.4% domestic or higher.
Recent-regime dominance: India, Germany, UK, Australia, and Hong Kong all have 88 to 98 percent of events from 2020 or later. Their results reflect post-COVID market conditions, not multi-decade structural properties. Treat them as current-regime estimates.
Benchmark mismatches: SPY is used for Taiwan and Thailand. For Taiwan, this is a defensible approximation given tech sector correlation. For Thailand, it's a poor fit, and the Thailand row should be read as a spread against the S&P 500 rather than a local abnormal return. An earlier version of this section said EWT was used for Taiwan with SPY as a fallback. That was wrong: EWT was never used, and Taiwan ran against SPY outright. The wider problem is that all 15 non-US markets in this table use USD-denominated US-listed ETFs (EWC for Canada, EWJ for Japan, INDA for India, and so on), so every non-US CAR here embeds a currency component. Sweden and Norway get no country ETF at all: both are benchmarked to VGK, a pan-European fund.
The published NS rows aren't robust either. A later run against local indices moves Sweden to +1.92% (t=7.41) against ^OMXS30, Australia to t=3.30 against ^AXJO, and Norway to t=2.35 against ^OSEAX. That run also changed the T+0 base price and refreshed the price data, so it isn't a clean benchmark-only comparison, and its local indices are price indices that don't reinvest dividends. What it does establish is that the "no signal" calls for Sweden, Australia and Norway in this table depend on choices we've since changed.
Our US and India posts show different numbers. The dedicated US post reports +1.08% at T+21 for the same market and period this table gives +0.55% for, and the India post reports +4.15% at T+63 on 2,071 events against the Sensex where this table shows +5.05% on 3,483 events against INDA. Those posts use a later run in which T+0 is the last pre-announcement close, so the announcement-day move sits inside every window. This table starts the window at the announcement-day close. For the US, +0.55% plus the +0.51% announcement-day move lands at +1.06%, close to the +1.08% the later run reports. Neither convention is wrong, but only the smaller number is available to a trader who enters after the announcement.
Sample sizes in non-US markets: Several exchanges have 500 to 1,500 events in total. Subcategory analysis (by streak length) within those samples carries real uncertainty. The t-stats at T+21 for Australia (1.73) and Norway (1.15) are below conventional significance thresholds. More data would sharpen the picture.
Coverage periods: Effective start dates vary from 2000 (US, Canada) to 2021 (Norway, Switzerland). Markets with shorter histories may look better or worse than they would over a full cycle.
Survivorship bias: Stocks that delisted due to failure are underrepresented across all exchanges. CARs are biased upward as a result.
Takeaway
Ten of 16 exchanges show statistically significant T+21 drift at p<0.01. Two of those ten, Germany and UK, measure universes that are mostly neither German nor British, and a third, Taiwan, is measured against SPY. The remaining seven (India, Brazil, Canada, Hong Kong, Japan, Korea and the US) are domicile-clean and benchmarked to their own region, which is still a wide enough spread of market structures to take seriously. It's weaker evidence than the original version of this post claimed. The mirror test now backs the surviving rows: in all seven of those markets, miss streaks drift the other way (Korea's only directionally, short of significance; see the mirror-test table), which is the check the original design never made.
The practical implications differ by context. For investors in US markets, the T+21 signal is real but compressed to +0.55%. For Canadian and Japanese markets, the same event produces 2x the drift with comparable statistical reliability and much longer histories. For Taiwan and Brazil, streak 3 is the highest-conviction entry point.
India and Hong Kong show strong signals on recent-only data, and those signals haven't been tested through a full cycle. Take them as current-regime findings, not confirmed structural properties. The Germany and UK rows used to sit in this sentence. They're out: those universes are 49.0% and 61.5% US-domiciled, and the domestic legs are flat.
Sweden and Switzerland produced no reliable signal in this run, but "no signal" turns out to be as fragile as "signal". Rerun against a local index, Sweden reaches +1.92% (t=7.41), and Australia and Norway cross significance too. The rerun changed more than the benchmark, so it doesn't settle the question. It does mean the NS rows here aren't a finding about those markets.
Thailand isn't counter-evidence any more. It's a benchmark failure: Thai stocks measured against the S&P 500 in dollars. Against the local index the sign flips, and the paired mirror run adds the missing half: Thai beat streaks drift up (+2.13%, t=8.2) while Thai miss streaks drift down (-0.81%, t=-3.0). The SET row here still tells you nothing, but the market itself now has a tested, passing signal.
The T+1 result is the most durable thing in this data. It's positive on all 16 exchanges, including the ones whose longer-window rows we've withdrawn. And its inverse is now measured: on US data, the announcement that breaks a streak costs -1.20% on day one (t=-36.9). The one-day move knows the direction of the news.
This is the global comparison blog. See dedicated analyses for US, Canada, Japan, Taiwan, India, and Brazil.
Data: Ceta Research (FMP warehouse). Beat streaks computed on earnings_surprises table using DuckDB window functions. Abnormal returns vs USD-denominated US-listed regional ETF benchmarks, with SPY used for Taiwan and Thailand where no country ETF was available and VGK (pan-Europe) for Sweden and Norway. Universes are selected by exchange code, which selects listings rather than domiciles. Market cap filters applied per exchange in local currency. Analysis period: 2000–2025 (exchange-specific effective start dates in table). The miss-streak mirror leg was computed 2026-08-29 as a separate paired run against local benchmarks; see "The Mirror Test" section.
Past performance does not guarantee future results. This is educational content, not investment advice.

