
Analyst Upgrades Across 5 Markets: What Works, What Fades, What


We measured 136,610 analyst rating revision events, upgrades and downgrades, across US, Germany, UK, Switzerland, and Canada from 2012 to 2025. Every market shows immediate price reaction on the day of the upgrade. What happens over the following three months is where markets diverge.
Contents
- Method
- The T+21 Snapshot
- What Works and What Doesn't (Per Market)
- United States: Fast fade, persistent downgrades
- Germany: Drift keeps growing
- UK: Sustained, cluster-driven
- Switzerland and Canada: Smaller samples, clear signals
- The Cluster Effect Across Markets
- Why Markets React Differently
- What This Doesn't Tell You
- Takeaway
Method
- Data source: Ceta Research (FMP stock_grade table, individual analyst grade changes)
- Period: 2012–2025 (14 years)
- Study type: Event study. Each analyst revision is an independent event.
- Benchmarks: SPY (US), EWG (Germany), EWU (UK), EWL (Switzerland), EWC (Canada)
- Windows: T+1, T+5, T+21, T+63 trading days
- Abnormal return: Stock return minus regional ETF benchmark at each window
- Market cap filters: Exchange-specific thresholds applied (>$1B USD for US, >€200M for Germany, >£300M for UK, etc.)
- Deduplication: Duplicate entries from re-fetches removed (keep most recent record per analyst/stock/date)
- Winsorization: 1st/99th percentile applied before computing statistics
Why these five markets: FMP's stock_grade data is concentrated in Western markets. Asian markets (India, Japan, Korea) have negligible individual analyst grade coverage in this dataset, fewer than 50 events per year for most, compared to 4,000+ per year in the US.
The T+21 Snapshot
| Exchange | Upgrades | T+1 CAR | T+21 CAR | T+63 CAR |
|---|---|---|---|---|
| Germany (XETRA) | 12,585 | +0.569%** | +1.458%** | +2.634%** |
| UK (LSE) | 9,059 | +0.579%** | +0.745%** | +0.621%** |
| Switzerland (SIX) | 2,402 | +0.448%** | +0.647%** | +1.258%** |
| Canada (TSX) | 2,232 | +0.513%** | +0.543%** | +1.247%** |
| US (NYSE+NASDAQ+AMEX) | 66,742 | +0.652%** | +0.492%** | +0.178%** |
** = significant at p<0.05. All T+1 returns significant in every market.
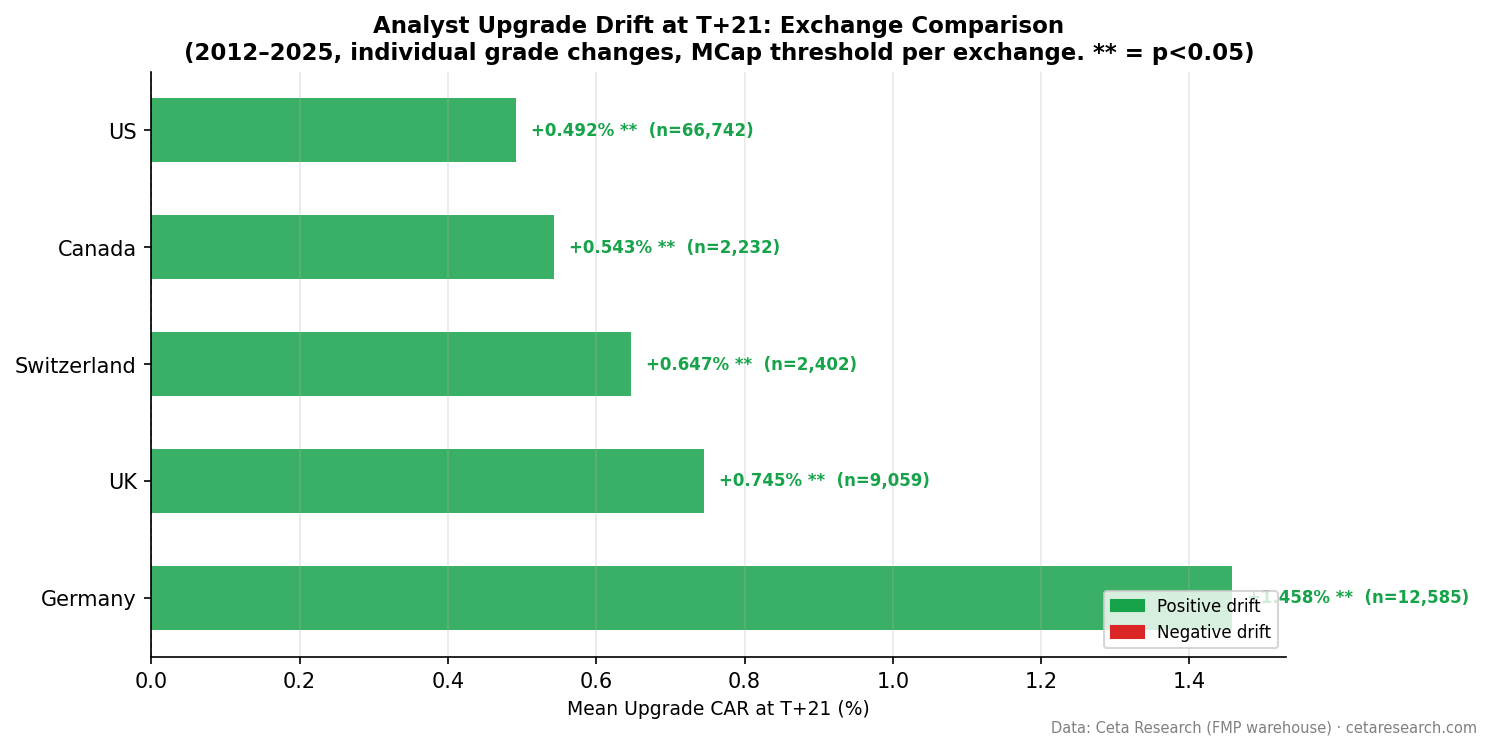
The US has the highest event count (66,742) and the fastest-fading drift (+0.18% at T+63). Germany has one-sixth the events but nearly 15x the three-month drift (+2.63%). The US is the most efficient market in this sample, upgrades get priced in fastest.
What Works and What Doesn't (Per Market)
United States: Fast fade, persistent downgrades
US upgrades peak early and fade. By T+63, all upgrades are barely above benchmark (+0.18%). Single-analyst upgrades turn negative at T+63 (-0.26%).
The cluster effect is the exception: clustered upgrades (two or more firms within 30 days) maintain +0.75% at T+63 vs single-analyst +0.18%, a 4x gap.
US downgrades are the standout finding: they don't fade. Every window keeps deepening: -0.82% → -0.88% → -1.00% → -1.48%. Three months after a US downgrade, the stock is still 1.48% below SPY on average.
Germany: Drift keeps growing
Germany is the clearest under-reactor in this dataset. Upgrade drift doesn't fade, it grows from +0.57% on day one to +2.63% at three months. Every window is statistically significant at t>16.
German downgrades behave differently: the initial drop (-0.62%) reverses completely. By T+63, downgraded German stocks are actually outperforming EWG (+0.82%). German downgrades appear to be over-reactions; German upgrades appear to be under-reactions.
UK: Sustained, cluster-driven
UK upgrades sustain through three months without the German acceleration. The cluster split matters: +1.37% vs +0.32% at T+21 for clustered vs single upgrades. Single upgrades on LSE are weak signals, clustered upgrades are the real signal.
UK downgrades deepen over time (-0.65% to -1.15%), similar to the US pattern.
Switzerland and Canada: Smaller samples, clear signals
Switzerland (SIX) and Canada (TSX) both show significant upgrade drift, but with smaller samples (2,200–2,400 events each). Both show continued drift through T+63 (around +1.25% each).
Switzerland shows the strongest persistent downgrade effect in the dataset: -1.89% at T+63. Every window is significant. Canadian downgrades are weaker and not significant at T+63.
Switzerland is unusual in one respect: single-analyst upgrades (+0.81% at T+21) beat clustered upgrades (+0.49%). This may reflect the smaller analyst community, clusters happen even when just two firms agree, which is less informative than in the US where it takes independent coverage across many firms.
The Cluster Effect Across Markets
| Exchange | Clustered T+21 | Single T+21 | Ratio |
|---|---|---|---|
| Germany | +1.937% | +0.946% | 2.0x |
| UK | +1.373% | +0.322% | 4.3x |
| US | +0.923% | +0.176% | 5.2x |
| Canada | +0.562% | +0.549% | 1.0x (no difference) |
| Switzerland | +0.492% | +0.807% | — (reversed) |
The cluster effect is strongest in the US and UK. Canada shows no cluster premium. Switzerland shows an inverse, individual upgrades outperform clustered ones, possibly because the Swiss market has thin enough coverage that a single upgrade from a major bank is already highly informative.
Why Markets React Differently
Three factors likely explain the cross-market variation:
Analyst coverage density. The US has the deepest coverage, major stocks have 20+ analysts. New information from one firm is incremental. Germany has far less coverage per stock; an upgrade from a Frankfurt-based bank can be genuinely novel to many market participants.
Investor type. US institutional investors are faster to act on analyst information. European retail investors, particularly in Germany, tend to be slower.
Market liquidity. Price adjustment happens faster in liquid markets. XETRA stocks outside the DAX30 trade less frequently; information takes longer to diffuse into price.
What This Doesn't Tell You
This is an event study, not a trading strategy. Abnormal returns are measured from the event date, which is often before you can act on the upgrade. Same-day execution is impossible for retail investors; professional investors with direct analyst relationships may have access earlier.
Transaction costs matter. Achieving the T+1 return means executing before other market participants have fully priced the upgrade. By the time a downgrade appears on a data terminal, the stock is already down.
The 14-year period covers one long bull market cycle with two major disruptions (COVID 2020, rate shock 2022). The pattern may behave differently in sustained bear markets or high-volatility regimes.
Takeaway
Every market in this study reacts to analyst upgrades. What differs is how long the reaction lasts.
Germany under-reacts the most persistently, upgrade drift grows for three months. The US is the most efficient, drift fades within weeks for single analysts. UK and Switzerland fall between, with sustained drift that doesn't accelerate.
Across all markets: downgrades are more durable signals than upgrades (except Germany, where downgrades reverse). Clustered upgrades carry 2-5x the information of single-analyst events (except Canada and Switzerland where the pattern breaks down).
The common thread: analyst revisions carry real information. The speed at which that information reaches price depends on the market's structure.
Part of a Series: Global | S Uk Lse Event Study | US | S Germany Xetra Event Study | US
Run It Yourself
Explore the data behind this analysis on Ceta Research. Query our financial data warehouse with SQL, build custom screens, and run your own backtests across 70,000+ stocks on 20 exchanges.
Data: FMP warehouse via Ceta Research, 2012–2025. Individual analyst grade changes (stock_grade table). Five exchanges: NYSE+NASDAQ+AMEX, XETRA, LSE, SIX, TSX.
Backtest code on GitHub.


