
Volume-Confirmed Momentum on Sweden Stocks: 10.49% CAGR, +6.81% vs Local Index
Volume-confirmed momentum on Swedish stocks returned 10.49% annually from 2001 to 2025, +6.81% over the OMX Stockholm 30 (3.68% CAGR). Sharpe of 0.487, the highest of 17 global exchanges. Down capture of 30.7% and 31% cash periods define it: defensive in crises, strong when invested.

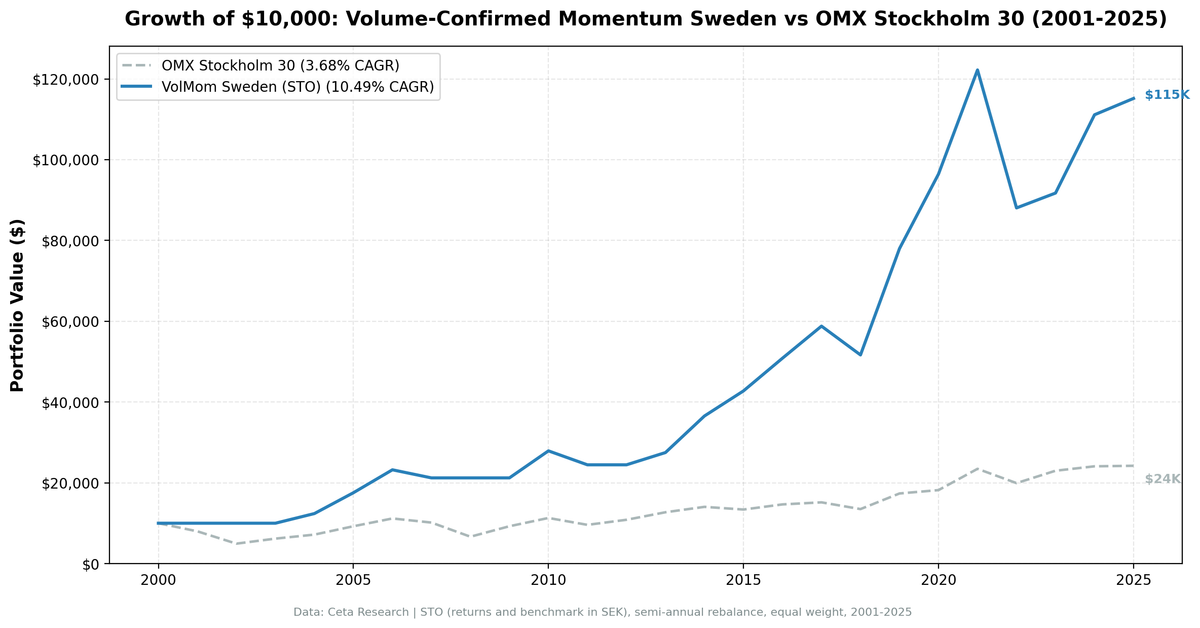
Sweden has the highest Sharpe ratio of the 17 markets we tested, 0.487, using a volume-confirmed momentum strategy. We took the top 30 momentum stocks on the Stockholm exchange, filtered by rising institutional volume and basic quality screens, and rebalanced semi-annually from 2001 to 2025. The strategy returned 10.49% annually against 3.68% for the OMX Stockholm 30, with +6.81% annual excess return and 30.68% down capture.
Contents
Data: FMP financial data warehouse, 2000–2025. Rerun September 2026.
Method
| Parameter | Value |
|---|---|
| Universe | STO (Stockholm Stock Exchange) |
| Rebalancing | Semi-annual (January, July) |
| Signal | 12-month return, skip last month (T-1M to T-12M) |
| Volume filter | 3-month avg daily volume > 12-month avg (vol_ratio > 1.0) |
| Quality filter | netIncome > 0 AND operatingCashFlow > 0 (FY, 45-day lag) |
| Selection | Top 30 by momentum, equal weight |
| Min threshold | 10 qualifying stocks to deploy capital |
| Data source | FMP via Ceta Research warehouse |
| Benchmark | OMX Stockholm 30 (^OMXS30) |
| Period | 2001–2025 |
| Academic reference | Lee & Swaminathan (2000), Journal of Finance 55(5) |
That academic reference is usually cited in the wrong direction, so it is worth stating plainly. Lee & Swaminathan found that "high (low) volume winners (losers) experience faster reversals" and that "among winners, low volume stocks show greater persistence in price momentum." Their momentum life cycle classes a high-volume winner as late-stage momentum. This strategy buys high-volume winners, so the paper is not a case for it, and it is a US study of NYSE and AMEX stocks ranked on turnover rather than a finding about Stockholm.
Sweden's equity market has low retail participation by global standards, with pension funds, insurers and funds accounting for much of the trading activity. That is a plausible reason a volume signal might behave differently here than in the US, but it is context rather than evidence: we did not measure trading composition, and the backtest cannot separate the volume filter's contribution from the momentum ranking underneath it.
The 31% cash rate (15 of 49 semi-annual periods with fewer than 10 buyable stocks) is on the higher end compared to other markets we tested. Sweden's universe is smaller. When momentum and volume signals don't align for enough stocks, the model stays in cash rather than forcing positions.
What We Found
Sweden delivers the best risk-adjusted result of any exchange in this study. The Sharpe of 0.487 is well above what we found in India (0.209), Canada (0.404) and the UK (0.303). The 10.49% CAGR compounds to roughly 11.5x over 24.5 years. The OMX Stockholm 30 grew to about 2.4x (3.68% CAGR) over the same period.
24.5-year summary (2001–2025):
| Metric | Volume-Confirmed Momentum | OMX Stockholm 30 |
|---|---|---|
| CAGR | 10.49% | 3.68% |
| Total Return | 1051.8% | 142.2% |
| Sharpe Ratio | 0.487 | n/a |
| Max Drawdown | -32.10% | -50.58% |
| Down Capture | 30.7% | 100% |
| Up Capture | 108.1% | 100% |
| Cash Periods | 15 of 49 (31%) | n/a |
| Avg Stocks When Invested | 26.1 | n/a |
The 30.7% down capture is the number that matters. Among the markets that stayed largely invested it is the lowest in the study; two markets sit lower, Malaysia at 8.1% and Norway, and both spent so much of the period in cash (41% and 82%) that their capture ratios describe very few invested periods. When the OMX falls, this portfolio falls only 31% as hard. The combination of defensive down capture and 108.1% up capture against a low-returning local index is what produces the Sharpe leadership. The OMX Stockholm 30 had essentially flat real returns over 2001-2025 (3.68% nominal). Against that backdrop, the strategy's 10.49% represents genuine alpha.
Year-by-year standouts:
| Year | Portfolio | OMX | Notes |
|---|---|---|---|
| 2001-2003 | 0% | various | Cash, not enough qualifying stocks |
| 2004 | +23.9% | +16.0% | First full deployment year, +7.9pp |
| 2005 | +41.6% | +28.8% | Best absolute year, +12.8pp vs OMX |
| 2006 | +32.4% | +20.8% | Sustained outperformance, +11.5pp |
| 2007 | -8.6% | -9.1% | Roughly in line |
| 2008 | 0% (cash) | -34.5% | Cash during the crash, saved ~34pp |
| 2009 | 0% (cash) | +38.9% | Also cash, missed the recovery |
| 2010 | +31.5% | +22.1% | Strong re-entry, +9.4pp |
| 2011 | -12.4% | -15.1% | Outperformed in down year |
| 2012 | 0% (cash) | +13.1% | Cash, missed mid-cycle |
| 2013 | +12.4% | +17.2% | Trailed the OMX |
| 2014 | +32.9% | +10.5% | +22.4pp, strong outperformance |
| 2015 | +17.0% | -4.7% | +21.7pp vs a flat OMX year |
| 2016 | +18.9% | +9.5% | Outperformed |
| 2017 | +15.6% | +3.5% | +12.1pp |
| 2018 | -12.1% | -11.0% | Roughly in line in a down year |
| 2019 | +51.0% | +28.6% | Exceptional outperformance |
| 2020 | +23.7% | +4.8% | +18.9pp, post-COVID recovery |
| 2021 | +26.7% | +28.9% | Roughly in line |
| 2022 | -28.0% | -15.1% | Worst relative year, momentum crash |
| 2023 | +4.2% | +15.4% | Underperformed in the tech rally |
| 2024 | +21.1% | +4.8% | +16.4pp, strong finish |
| 2025 | +3.6% | +0.5% | Outperformed a flat OMX year |
2008 tells the most important part of the story. The portfolio was in cash. The OMX fell 34.5%. We don't claim credit for "predicting" the crash. The portfolio was cash because the volume-confirmation and quality filters didn't produce 10 qualifying stocks at the January 2008 rebalance. That is the minimum-holdings rule doing what it was specified to do. Why the qualifying pool thinned that particular January we did not investigate, and we should not claim to know.
2009 was the cost. Staying in cash meant missing the OMX's 38.9% recovery. The model didn't re-enter until enough qualifying stocks passed the volume filter again. That's the trade-off with higher cash rates: defensive in crises, slow to redeploy.
2005 was the peak. A 41.6% return against OMX +28.8% reflects the Swedish mid-cap cycle of the mid-2000s. Nordic industrials and financials were in a sustained trend, volume was rising, and quality screens were easy to pass. The setup was ideal.
2022 was the worst relative year. -28.0% against OMX's -15.1% is a significant miss. Momentum strategies tend to crash hard when rate cycles reverse sharply. The stocks with the best 12-month trailing returns entering 2022 were often the rate-sensitive growth names that got hit hardest. This is the documented momentum crash pattern from Daniel & Moskowitz (2016).
Backtest Methodology
- Data: FMP financial data via Ceta Research warehouse. Price data from
stock_eod(adjusted closes). - Point-in-time: Quality filters use annual FY filings with 45-day reporting lag. No look-ahead bias.
- Signal: Price at T-12M to T-1M. Skip last month avoids short-term reversal contamination per Jegadeesh & Titman (1993).
- Volume ratio: 63-day avg daily volume divided by 252-day avg daily volume, computed at each rebalance date.
- Data quality: Stocks with an entry price under 1 SEK are excluded, and any single-period return above 200% is dropped as a price artifact. Phantom holiday rows and broken split adjustments are removed from the price series before any lookup.
- Equal weight: 30 positions, 3.33% each. No intraperiod rebalancing.
- Transaction costs: Modeled as size-tiered commissions. See methodology.
- Benchmark: OMX Stockholm 30 (^OMXS30), SEK-denominated. Strategy returns are also SEK-denominated. The OMXS30 is a price index, so it excludes dividends, while the portfolio's returns use dividend-adjusted prices. Treat the local edge as overstated by roughly the Swedish dividend yield.
- Execution: Next-day close (market-on-close model). Entry prices use the trading day after the rebalance signal date.
Limitations
31% cash rate is real. The model sits in cash 15 of 49 periods. You're not invested for almost a third of the backtest. That changes the real-world implementation: investors holding this strategy need to decide what to do with the cash allocation during those periods. Sitting in money-market funds changes the return profile.
Small universe. Sweden's exchange has fewer listed companies than the US, India, or Japan. The minimum 10-stock threshold is hit more often than in larger markets. The qualifying universe in any given period averages 26.1 stocks, close to the 30-stock target, meaning the strategy sometimes holds only marginally qualifying names.
Momentum crashes are real and severe. 2022 shows this clearly. A -28.0% year in a rate-tightening cycle is the documented momentum crash pattern, and the full-period max drawdown is -32.10%. The 0.487 Sharpe is computed over the full 24.5-year period. An investor who started in 2022 would see a very different picture for their first year.
Currency note. Returns are computed in local currency (SEK). An investor holding this in a different currency adds FX risk on top of equity risk. The SEK/USD fluctuation over 2001-2025 is not captured in these numbers.
Survivorship bias, partially controlled. The FMP dataset includes delisted companies. However, we can't guarantee complete coverage of all Swedish listings that existed and then disappeared. Some bias likely remains.
Takeaway
Sweden is the best-performing market in this study by Sharpe ratio. We can describe what produced that number without being able to explain why Sweden and not elsewhere: a 31% cash rate that kept the portfolio out of two of the worst years, a 30.7% down capture when it was invested, and a local index that compounded at 3.68% over a quarter century.
The 30.7% down capture is the feature that earns the 0.487 Sharpe, not just the 10.49% CAGR. When the OMX falls hard, the portfolio either moves to cash (2008, 2009, 2012) or falls only 31% as hard as the index. That combination of defensive posture and consistent outperformance against a weak benchmark is what compounds to a 6.81% annual excess return.
Whether that repeats is a different question from whether it happened. Sweden is one market out of 17, and the study offers no mechanism that predicted in advance which ones would land where.
Part of a Series
This is part of a multi-exchange volume-confirmed momentum study:
- Volume-Confirmed Momentum: US Stocks
- Volume-Confirmed Momentum: UK Stocks
- Volume-Confirmed Momentum: India
- Volume-Confirmed Momentum: Canada
- Volume-Confirmed Momentum: Sweden
- Volume-Confirmed Momentum: 17-Exchange Comparison
References
- Lee, C. & Swaminathan, B. (2000). Price Momentum and Trading Volume. Journal of Finance, 55(5), 2017-2069.
- Jegadeesh, N. & Titman, S. (1993). Returns to Buying Winners and Selling Losers. Journal of Finance, 48(1), 65-91.
- Daniel, K. & Moskowitz, T. (2016). Momentum Crashes. Journal of Financial Economics.
Past performance does not guarantee future results. This is educational content, not investment advice.

