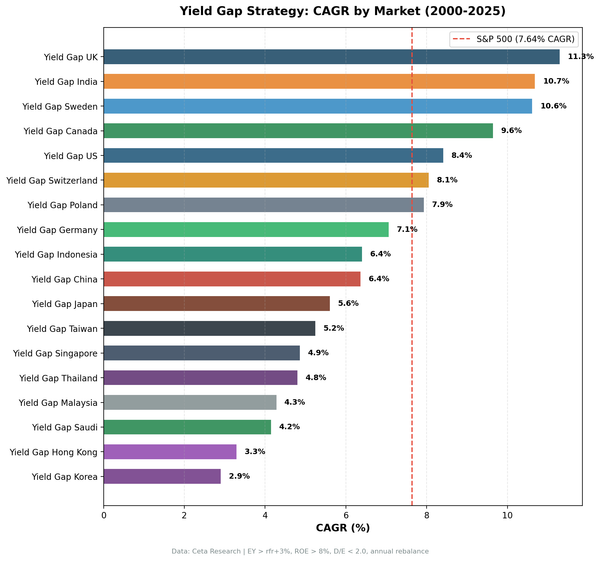
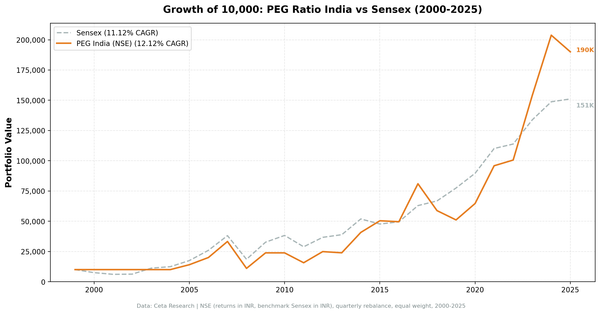
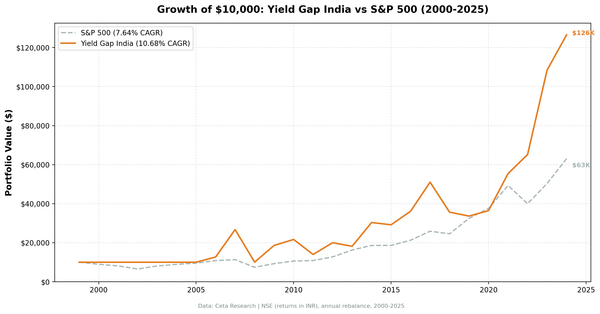
backtests
EV/EBITDA Below 10x on Indian Equities: 25-Year Backtest (NSE)
EV/EBITDA below 10x on NSE equities: 12.15% CAGR over 20 invested years vs 11.40% for the Sensex. A modest edge with lower beta.
backtests
EV/EBITDA below 10x on NSE equities: 12.15% CAGR over 20 invested years vs 11.40% for the Sensex. A modest edge with lower beta.
backtests
EV/EBITDA screen on Borsa Italiana returned 6.03% CAGR over 25 years, trailing SPY's 7.64%. Thin universe and six cash years. The strategy doesn't justify the complexity over a simple index fund.
backtests
A simple EV/EBITDA screen on Stockholm-listed stocks returned 9.74% CAGR over 25 years vs OMX Stockholm 30's 2.95%. The strategy outperformed in 76% of years, with 134.5% up capture and only 50.7% down capture against the local index.
backtests
EV/EBITDA below 10x is how private equity prices acquisitions. We tested it as an equity screen on 22,000+ US stocks over 25 years.
value-investing
PEG ratio on India's NSE: 12.12% CAGR over 25 years, +0.99%/yr vs the Sensex. The ride was violent, -67% in 2008, +116% in 2009. Here's the full data.
value-investing
South Africa's JSE delivered 5.98% CAGR over 25 years with strong downside protection. Beta 0.574, down capture 42.2%, -16.5% in 2008 vs S&P 500's -34.3%. Trails SPY on returns but adds real diversification value.
value-investing
Stockholm Exchange delivered 10.71% CAGR over 25 years, +7.54%/yr vs OMX Stockholm 30. Sharpe ratio of 0.437 is 7x the benchmark's 0.060.
value-investing
Japan delivered 6.47% CAGR over 25 years, +3.07%/yr vs the Nikkei 225. Sharpe 0.284 vs benchmark 0.066. Up capture 99.7%, down capture 76.1%. The strategy beat the index in 16 of 26 years.
value-investing
PEG ratio tested on 19 exchanges with local benchmarks. Sweden: +7.54% vs OMX30. Canada: +4.59% vs TSX. Japan: +3.07% vs Nikkei. India: +0.99% vs Sensex. 8 of 19 markets beat their home index.
value-investing
Peter Lynch's PEG ratio underperforms the full US exchange universe by 0.91%/yr over 25 years. Here's what works, what doesn't, and why universe selection changes everything.
value-investing
Canada's TSX PEG strategy delivered 9.67% CAGR with zero cash periods across 25 years, +4.59%/yr vs the TSX Composite. Next-day close execution, full backtest results and methodology.
value-investing
Taiwan's DCF discount portfolio returned 9.24% CAGR over 25 years, beating the TAIEX by +6.19% annually. The 0.399 Sharpe, -35.91% max drawdown (shallowest of any Asian market), and ~2.8:1 up/down capture asymmetry show strong risk-adjusted performance.