backtests
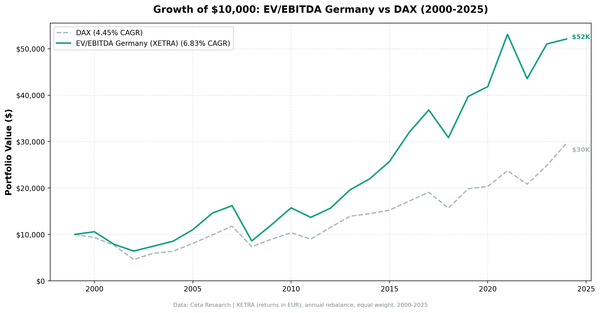
EV/EBITDA Value Backtest: Germany (XETRA), 2000-2024
EV/EBITDA screening on XETRA: 6.83% CAGR vs 4.45% for the DAX. A 2.38% annual edge against the local index with a 68% win rate.

backtests
EV/EBITDA screening on XETRA: 6.83% CAGR vs 4.45% for the DAX. A 2.38% annual edge against the local index with a 68% win rate.
backtests
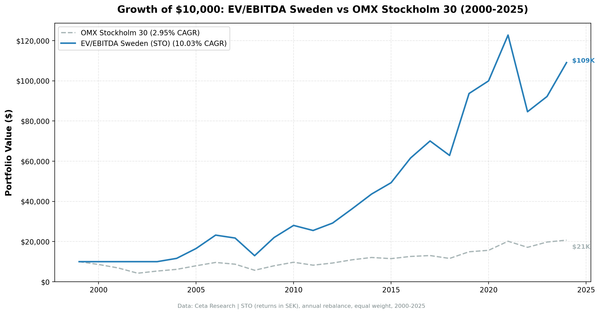
A simple EV/EBITDA screen on Stockholm-listed stocks returned 10.03% CAGR over 25 years vs OMX Stockholm 30's 2.95%. The strategy outperformed in 80% of years, with 138.6% up capture and only 52.0% down capture against the local index.
backtests
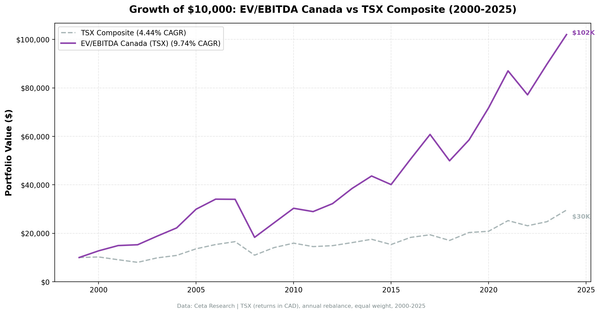
EV/EBITDA below 10x on the TSX: 9.74% CAGR vs TSX Composite 4.44%, 76% win rate. Canada's commodity-heavy market is structurally suited to this screen, with 150.2% up capture and 5.28% alpha.
backtests
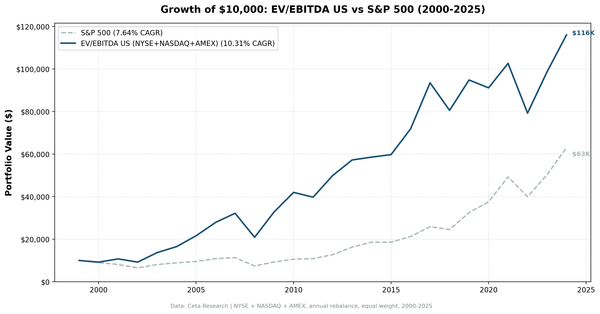
EV/EBITDA below 10x is how private equity prices acquisitions. We tested it as an equity screen on 22,000+ US stocks over 25 years.
backtests
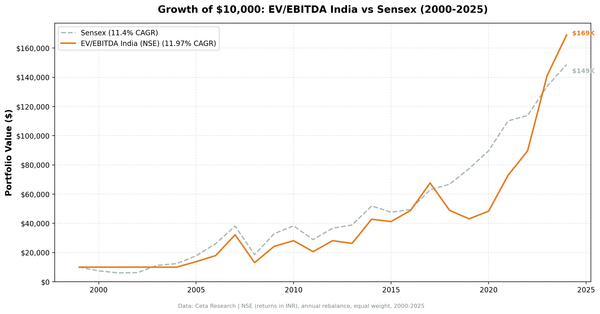
EV/EBITDA below 10x on NSE equities: 11.97% CAGR over 20 invested years vs 11.40% for the Sensex. A modest edge with lower beta.
value-investing
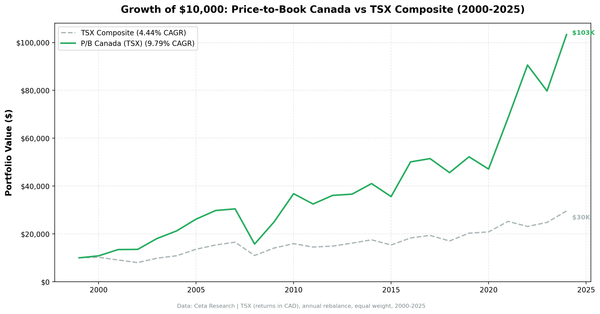
Canada's TSX returned 9.79% CAGR on a low P/B screen over 25 years, +5.36% annual excess vs the TSX Composite. In 2022, the portfolio gained +32% while the TSX fell -8%, the largest annual spread across all 17 exchanges we tested.
backtests
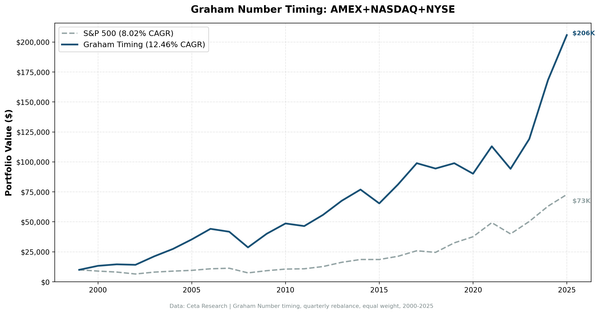
We tested buying stocks trading below Benjamin Graham's intrinsic value formula. 12.40% CAGR vs 8.01% SPY over 25 years, with 122% up-capture and 0% cash periods. The 75-year-old formula still works without modification.
backtests
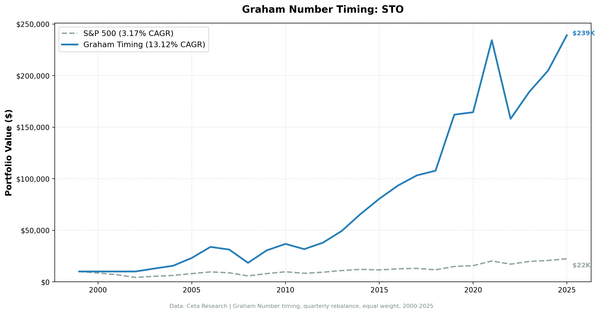
We tested Graham Number timing on Swedish stocks. 12.98% CAGR vs 8.01% SPY, +4.97% excess. 0.544 Sharpe ratio (best globally), 72% down-capture. The Goldilocks result: high alpha with controlled risk.
backtests
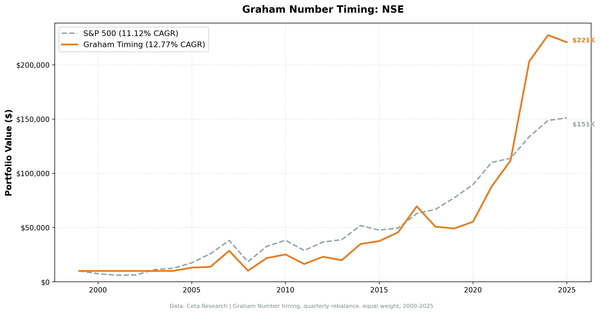
We tested Graham Number timing on Indian stocks (BSE+NSE). 13.44% CAGR vs 8.01% SPY, +5.43% excess (best globally). 57.1% down-capture with 122.5% up-capture. Value investing asymmetry in emerging markets.
backtests
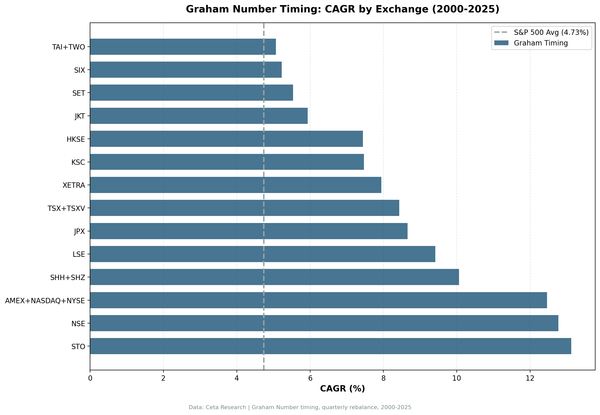
We tested Benjamin Graham's intrinsic value formula across 14 global exchanges versus local benchmarks. 13 of 14 show positive alpha. Winners: Sweden +9.95% vs OMX, UK +8.06% vs FTSE, China +5.87% vs SSE. Value works globally, but returns scale with local market quality.
value-investing
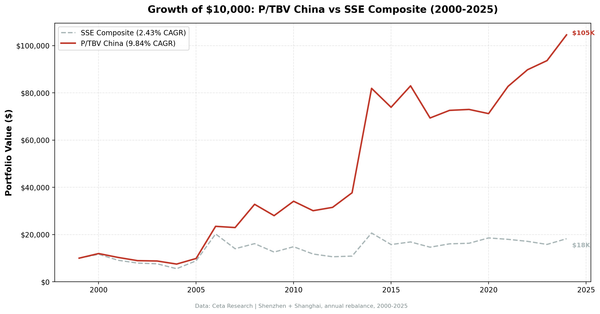
The P/TBV strategy on China's Shenzhen and Shanghai exchanges returned 9.84% annualised over 25 years against the SSE Composite's 2.43%, adding 7.41% per year. It beat the domestic benchmark in 18 of 25 years.
value-investing
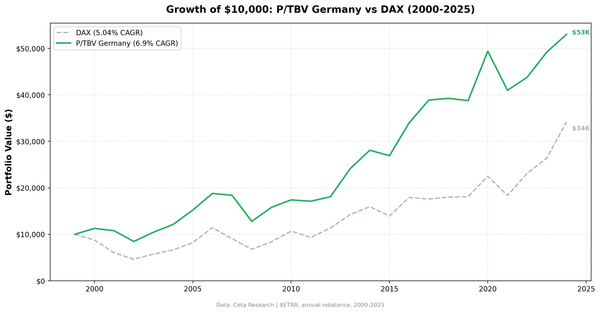
The P/TBV strategy on Germany's XETRA returned 6.90% annualised over 25 years, beating the DAX's 5.04% by 1.86% per year. Down capture of 34.4% means the portfolio absorbs about a third of the DAX's losses in down years.