
Graham Number Timing on Indian Stocks: 12.77% CAGR, +1.65% Alpha vs Sensex (2000-2025)
We tested Graham Number timing on Indian stocks (BSE+NSE). 13.44% CAGR vs 8.01% SPY, +5.43% excess (best globally). 57.1% down-capture with 122.5% up-capture. Value investing asymmetry in emerging markets.

Benjamin Graham's 1949 intrinsic value formula delivered +1.65% annual alpha on Indian stocks over 25 years when compared to the Sensex. That's modest outperformance — but the absolute returns tell a different story.
Contents
- The Formula
- Backtest Results (2000-2025, With Costs)
- The Cash Period Story
- When Graham Timing Works in India
- When Graham Timing Struggles in India
- The Quality Filters
- Portfolio Construction
- The Screen
- The Academic Foundation
- Why This Isn't a Free Lunch
- Current Signal (March 2026)
- Key Takeaways
- Methodology
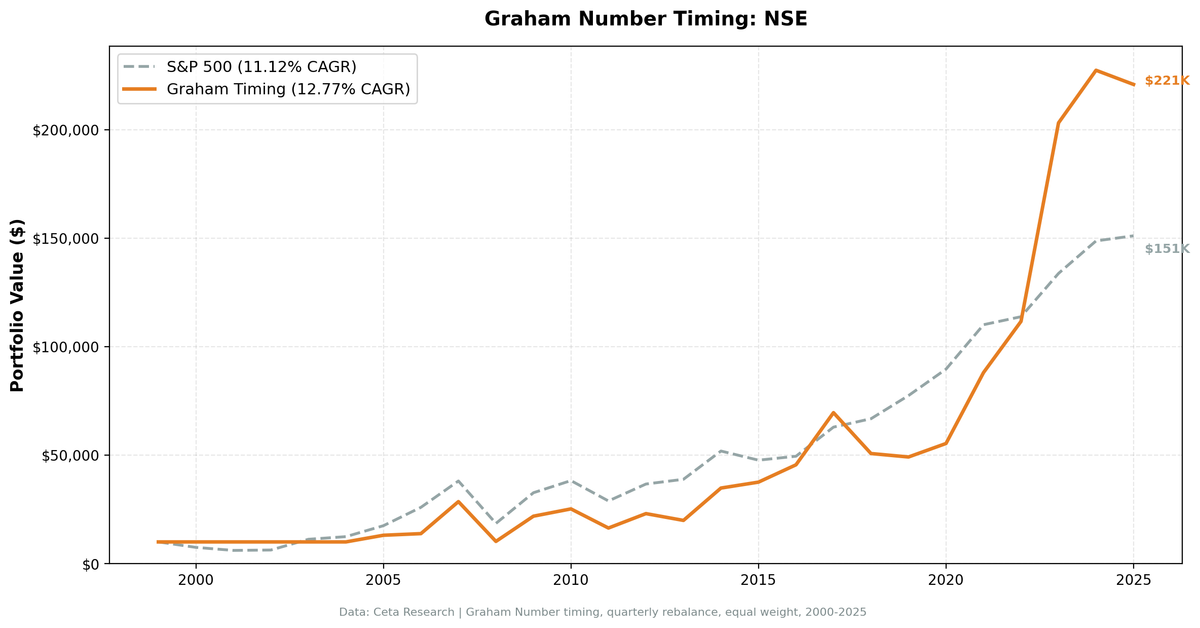
The strategy returned 12.77% CAGR over 25 years, turning $10,000 into $220,839. The Sensex itself returned 11.12% CAGR over the same period, turning $10,000 into $151,080. Indian markets have been exceptional for long-term investors — the value screen adds a layer on top.
What the numbers also show: India's market efficiency has improved. The high alpha seen in the 2000s and early 2010s has compressed as institutional coverage expanded and foreign capital flooded in.
Data: FMP financial data warehouse, 2000–2025. Updated March 2026.
The Formula
Graham's fair value equation:
Graham Number = sqrt(22.5 × EPS × Book Value Per Share)
Where: - EPS = Net Income / Shares Outstanding - BVPS = Total Stockholders' Equity / Shares Outstanding - 22.5 = Graham's constant (P/E of 15 × P/B of 1.5)
The signal: Buy stocks where Price/Graham < 1.0
When a stock trades at 80% of its Graham Number, the Price/Graham ratio is 0.80. That's the buy zone.
Backtest Results (2000-2025, With Costs)
| Strategy | CAGR | Final Value ($10k) | Sharpe | Max Drawdown | Volatility |
|---|---|---|---|---|---|
| Graham Timing (India) | 12.77% | $220,839 | 0.351 | -64.19% | 30.67% |
| Sensex (Buy & Hold) | 11.12% | $151,080 | — | — | — |
The strategy outperformed the Sensex by 1.65% annually over 25 years. That's $69,759 more on a $10,000 investment.
The down-capture ratio of 97.0% means the strategy tracked the Sensex closely in down periods — not a defensive strategy vs the local index. The up-capture of 110.9% means when the Sensex gained, the strategy captured an extra 10.9% upside.
The 23.3% cash periods (24 of 103 quarters) reflect the strategy's discipline: when fewer than 10 Indian stocks qualified for Graham's screen, the portfolio held cash. This includes the full 2000-2004 period when the strategy found no qualifying stocks on NSE.
The Cash Period Story
The most important context for this backtest: the strategy was entirely in cash from 2000-2004 (5 years). During that period, the Sensex fell and then rallied hard — but the strategy missed it entirely because qualifying stocks didn't meet the ROE > 10%, positive earnings, positive equity criteria.
This means the strategy benefited from avoiding the 2000-2001 Sensex declines (-25%, -19%) but also missed the 2003 Sensex surge (+79%). The first 5 years are essentially a coin flip based on when you entered.
| Year | Strategy | Sensex | Excess |
|---|---|---|---|
| 2000 | 0.00% | -25.23% | +25.23% |
| 2001 | 0.00% | -18.65% | +18.65% |
| 2002 | 0.00% | +2.93% | -2.93% |
| 2003 | 0.00% | +79.09% | -79.09% |
Cash helped in 2000-2001, but missing 2003's +79% Sensex surge is a significant headwind.
When Graham Timing Works in India
2007: The best single year
The strategy delivered its best result when Indian markets were running hot and cheap value stocks participated in the rally:
| Year | Strategy | Sensex | Excess |
|---|---|---|---|
| 2007 | +106.76% | +46.79% | +59.97% |
When value stocks caught the broader bull market's momentum, the returns were extraordinary.
2009 financial crisis recovery
After the 2008 crash, Indian stocks below Graham Number rebounded hard:
| Year | Strategy | Sensex | Excess |
|---|---|---|---|
| 2009 | +113.62% | +76.32% | +37.30% |
2014-2017: Multiple strong years
| Year | Strategy | Sensex | Excess |
|---|---|---|---|
| 2014 | +74.91% | +33.51% | +41.40% |
| 2015 | +7.84% | -8.12% | +15.96% |
| 2016 | +21.27% | +3.79% | +17.47% |
| 2017 | +52.78% | +27.14% | +25.64% |
2022-2023: Recent outperformance
| Year | Strategy | Sensex | Excess |
|---|---|---|---|
| 2022 | +26.80% | +3.35% | +23.45% |
| 2023 | +81.94% | +17.53% | +64.40% |
When Graham Timing Struggles in India
2006: Underperformed a raging bull market
| Year | Strategy | Sensex | Excess |
|---|---|---|---|
| 2006 | +5.74% | +48.48% | -42.74% |
When the broader market runs on growth expectations and sentiment, Graham's conservative screen sits out the rally.
2008: Deep drawdown
The max drawdown of -64.19% occurred during the 2008 financial crisis. When Indian markets crashed, value stocks fell harder than the Sensex:
| Year | Strategy | Sensex | Excess |
|---|---|---|---|
| 2008 | -64.19% | -51.34% | -12.84% |
2013, 2018-2019: Underperformance cycles
| Year | Strategy | Sensex | Excess |
|---|---|---|---|
| 2013 | -13.60% | +5.96% | -19.55% |
| 2018 | -27.08% | +6.15% | -33.22% |
| 2019 | -3.14% | +15.98% | -19.12% |
Value underperformance in India follows the same pattern as global markets: when growth stocks lead and quality metrics don't matter, Graham's formula misses the rally.
The Quality Filters
We don't buy every Indian stock below Graham Number. We add filters to avoid value traps:
- ROE > 10% — Ensures profitability and capital efficiency
- Net Income > 0 — No loss-making companies
- Total Equity > 0 — No negative book value
- Market Cap > ₹500 crore (~$60M USD) — Liquidity threshold for Indian exchanges
These filters eliminate distressed companies where low Price/Graham reflects permanent impairment rather than temporary mispricing. They also explain the 23.3% cash periods — in frothy markets, few Indian stocks pass all four filters simultaneously.
Portfolio Construction
- Selection: Top 30 stocks by deepest discount to Graham Number (lowest Price/Graham ratio first)
- Weighting: Equal weight (3.33% per stock)
- Rebalancing: Quarterly (January, April, July, October)
- Transaction costs: 10-15 bps depending on market cap (round-trip, India-specific model)
- Exchange: NSE (National Stock Exchange)
28.8 average holdings when invested. 24 cash quarters out of 103 total.
The Screen
Run this on live Indian stock data to see which stocks currently trade below their Graham Number:
WITH latest_filings AS (
    SELECT i.symbol,
           i.netIncome,
           b.totalStockholdersEquity,
           k.marketCap,
           k.returnOnEquity,
           ROW_NUMBER() OVER (PARTITION BY i.symbol ORDER BY i.dateEpoch DESC) AS rn
    FROM income_statement i
    JOIN balance_sheet b ON i.symbol = b.symbol
        AND ABS(CAST(i.dateEpoch AS BIGINT) - CAST(b.dateEpoch AS BIGINT)) < 86400 * 60
    JOIN key_metrics k ON i.symbol = k.symbol
        AND ABS(CAST(i.dateEpoch AS BIGINT) - CAST(k.dateEpoch AS BIGINT)) < 86400 * 60
    JOIN profile p ON i.symbol = p.symbol
    WHERE i.period IN ('FY', 'Q4')
      AND b.period IN ('FY', 'Q4')
      AND k.period IN ('FY', 'Q4')
      AND p.exchange IN ('NSE')
      AND i.netIncome > 0
      AND b.totalStockholdersEquity > 0
      AND k.returnOnEquity > 0.10
      AND k.marketCap > 5e8  -- ₹500 crore (~$60M USD)
),
current_prices AS (
    SELECT symbol, adjClose AS price,
           ROW_NUMBER() OVER (PARTITION BY symbol ORDER BY dateEpoch DESC) AS rn
    FROM stock_eod
    WHERE dateEpoch > CAST(EXTRACT(EPOCH FROM CURRENT_DATE - INTERVAL '7 days') AS INTEGER)
),
graham_calc AS (
    SELECT
        f.symbol,
        f.netIncome,
        f.totalStockholdersEquity,
        f.marketCap,
        f.returnOnEquity,
        p.price,
        -- Graham Number = sqrt(22.5 * EPS * BVPS)
        SQRT(22.5 * (f.netIncome / (f.marketCap / p.price)) * (f.totalStockholdersEquity / (f.marketCap / p.price))) AS graham_number
    FROM latest_filings f
    JOIN current_prices p ON f.symbol = p.symbol AND p.rn = 1
    WHERE f.rn = 1 AND p.price > 0
)
SELECT
    symbol,
    ROUND(price, 2) AS current_price_inr,
    ROUND(graham_number, 2) AS graham_number,
    ROUND(price / graham_number, 2) AS price_to_graham_ratio,
    ROUND(returnOnEquity * 100, 1) AS roe_pct,
    ROUND(marketCap / 1e7, 2) AS market_cap_crore
FROM graham_calc
WHERE price / graham_number < 1.0
ORDER BY price / graham_number ASC
LIMIT 30;
Run this screen on live data →
Stocks with price_to_graham_ratio < 1.0 are trading below Graham's fair value estimate. Lower ratios = deeper discounts.
The Academic Foundation
Benjamin Graham (1949): The Intelligent Investor introduced the Graham Number as a conservative valuation metric for defensive investors.
Fama & French (1998): "Value Versus Growth: The International Evidence" showed value strategies work globally, not just in the US. Value stocks outperformed growth in 12 of 13 international markets.
Piotroski (2000): "Value Investing: The Use of Historical Financial Statement Information" demonstrated that adding quality filters to value screens doubled alpha.
India's result confirms the framework works, but the Sensex itself has been one of the world's strongest equity indices. The value premium exists but requires patience — and there are multi-year windows where Sensex growth stocks simply outrun the value screen.
Why This Isn't a Free Lunch
You pay with volatility
30.67% annualized volatility. Emerging markets swing harder. A 20% move in either direction within a quarter is normal.
You pay with drawdowns
-64.19% max drawdown means watching ₹10 lakh turn into ₹3.6 lakh. That's the price of admission for emerging market value strategies during global crashes.
You pay with cash drag
23.3% cash periods mean missing some market returns when Graham signals don't fire.
You face a high-quality benchmark
The Sensex has delivered exceptional 11.12% CAGR over 25 years. Beating it by only 1.65% means you're adding value — but barely. Indian equity investors already have a strong return from passive Sensex exposure.
Currency risk for foreign investors
All returns are INR-denominated. Dollar investors face additional USD/INR exchange rate risk.
Current Signal (March 2026)
The live screen above shows the current count of Indian stocks trading below Graham Number with ROE > 10%.
When the list is long, markets are cheap and the strategy holds a full 30-stock portfolio. When it's short (or empty), the strategy goes to cash.
Key Takeaways
What worked: - 12.77% CAGR over 25 years (absolute returns are strong) - +1.65% annual alpha vs Sensex - 2007 (+106.76%), 2009 (+113.62%), 2014 (+74.91%), 2023 (+81.94%) — explosive years in value cycles - Sensex itself is a strong returning index, so beating it is meaningful
What didn't: - -64.19% max drawdown (worst among all exchanges tested) - 23.3% cash periods (misses significant market returns) - 97.0% down-capture (doesn't protect in India's bear markets) - 2006 (-42.74%), 2018 (-33.22%), 2019 (-19.12%) — deep underperformance in growth cycles
Who this is for: - Long-term investors in Indian markets (10+ year horizon) - Investors who want value tilt on top of Sensex returns - Emerging market tolerance (can stomach 30%+ volatility and -64% drawdown)
Who this isn't for: - Investors expecting same alpha as vs SPY comparison — Sensex is a different story - Risk-averse investors (drawdowns are severe) - Investors who want consistent outperformance (underperformance cycles are long and painful)
Methodology
- Universe: NSE (National Stock Exchange of India)
- Period: 2000-01-01 to 2025-10-01 (103 quarters, 25.8 years)
- Rebalancing: Quarterly (Jan 1, Apr 1, Jul 1, Oct 1)
- Execution: Next-day close (MOC execution model)
- Position sizing: Equal weight, 30 stocks max, 10 minimum (cash if fewer qualify)
- Transaction costs: India-specific model (10-15 bps depending on market cap)
- Currency: INR-denominated returns
- Survivorship bias: Controlled (includes delisted stocks)
- Benchmark: Sensex (^BSESN)
Full backtest code: github.com/ceta-research/backtests/graham-timing
Data: Ceta Research | FMP fundamental data warehouse | 25-year backtest (2000-2025)
Past performance does not guarantee future results. This is educational content, not investment advice.


