
Stock Splits Signal Something, Just Not What You Think
1,968 forward stock splits on US exchanges, 2000 to 2025. Post-split drift is gone in aggregate. Corrected August 2026: our -11.67% result for 5-for-1+ splits was mostly fund share splits and encoding errors. The genuine leg is -7.14%, not significant.

A stock split changes nothing about a company's fundamentals. A 4-for-1 split gives you four shares at a quarter of the price. Same market cap. Same ownership stake. Same business.
Contents
- Correction, August 2026
- Executive Summary
- Method
- Universe composition (audited August 2026)
- The Academic Case for Post-Split Drift
- Screening for Stock Splits
- Simple screen
- Advanced screen: $500M+ companies with meaningful splits
- Event Study Results
- Overall CAR by Window
- By Split Ratio
- The Split Ratio Effect
- Split Frequency Over Time
- Run It Yourself
- Limitations
- Takeaway
- References
And yet, the conventional wisdom says stocks that announce forward splits outperform in the months after. Academic papers from the 1960s and 1990s documented this. Finance blogs repeat it. The actual 2000-2025 data tells a more nuanced story.
We analyzed 1,968 forward stock splits on US exchanges to measure the effect, test whether it's statistically significant, and find out where it's strongest.
Data: FMP financial data warehouse, 2000-2025. Updated August 2026.
Correction, August 2026
We originally presented the 5-for-1+ result (-11.67% at one year, t=-4.00) as a finding about extreme split ratios. A universe audit in August 2026 showed that most of that number comes from what is in the category, not from how those companies traded.
Of the 207 events in the 5-for-1+ bucket, 102 (49.3%) are fund and ETF share splits, not operating-company splits. A further 11 non-fund records sit above a 25:1 ratio, a stratum dominated by encoding errors in the source split table: reverse splits recorded as forward splits, and IPO-date share conversions recorded as splits. Strip both groups out and the remaining common-stock splits at 5:1 through 25:1 return -7.14% at one year with a t-stat of -1.47, which is not statistically significant. Narrow further to US-domiciled common stock and the figure is -2.16% with a t-stat of -0.37.
Every published number below is unchanged. What changed is what those numbers mean. The positive half of this post survives the same audit: the pre-split run-up and the 2-for-1 result both hold on a fund-free, US-domiciled cut. The full decomposition is in the "By Split Ratio" section, and the universe composition is in the Method section.
Executive Summary
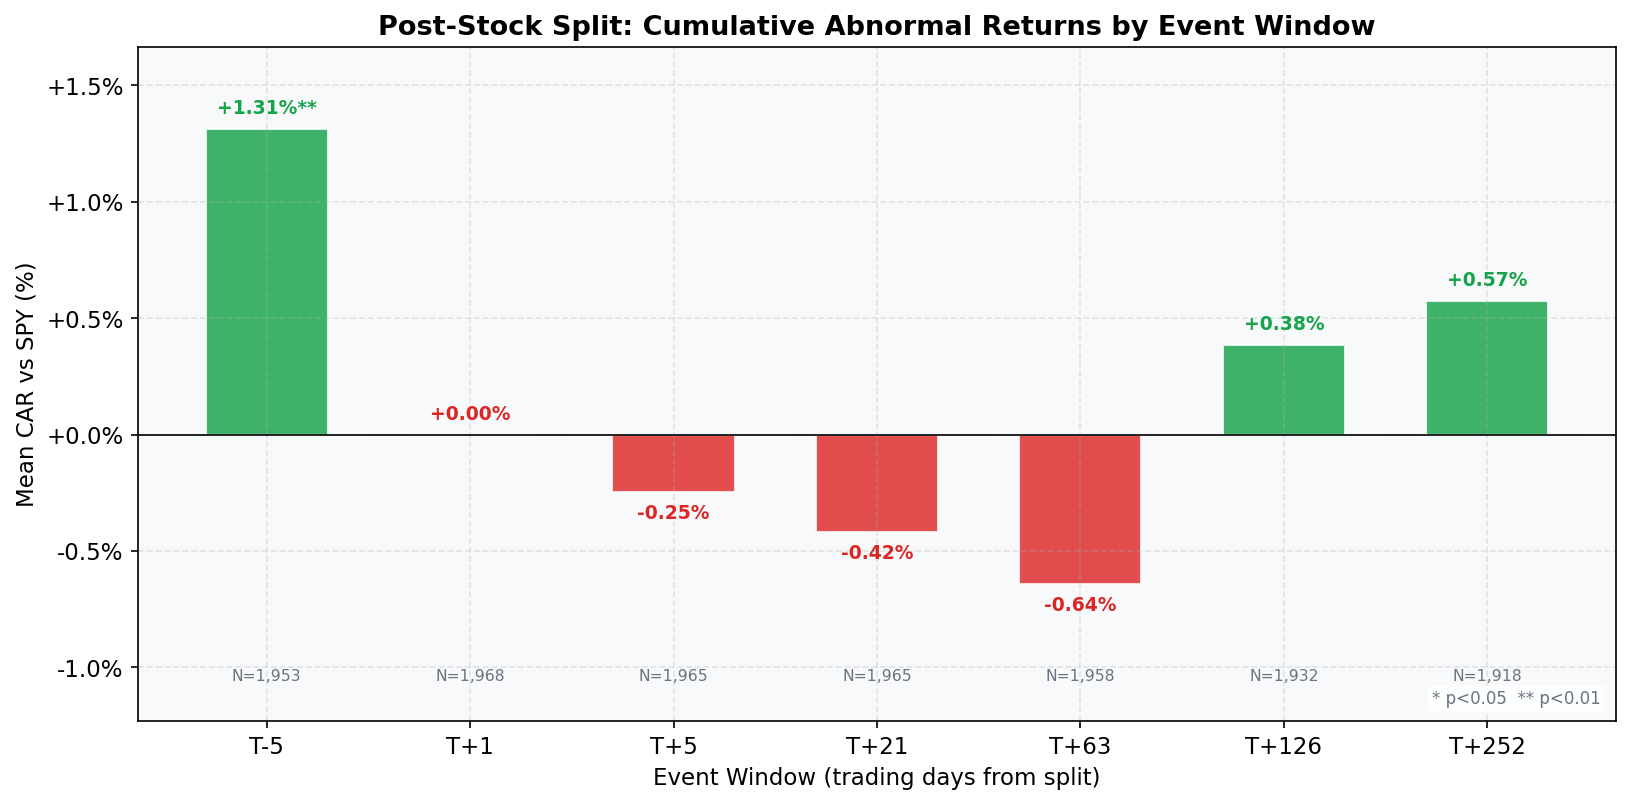
Forward stock splits show a modest pre-split run-up: +1.31% vs SPY in the 5 trading days before the effective date (t-stat 3.81, significant at p<0.01). On US-domiciled common stock only, that run-up is +1.47% (t=3.33, n=1,150). After the split, there is no statistically significant drift in either direction. The overall one-year CAR is +0.58%, with a t-stat of 0.72, far from significant.
The ratio tells a different story, and only half of it holds up. Standard 2-for-1 splits show +2.58% at one year (t=2.45, significant at p<0.05), and they still show +3.36% (t=2.51, n=666) on US-domiciled common stock alone. Extreme ratio splits (5-for-1 and above) show -11.67% at one year (t=-4.00), but that figure is carried by fund share splits (-12.37%, t=-3.51, n=98) and by 11 non-fund records above a 25:1 ratio averaging -40.86% (t=-2.98), a stratum dominated by encoding errors. The genuine common-stock leg is -7.14% (t=-1.47), which is not significant.
The practical implication: the post-split drift from Ikenberry (1996) hasn't reversed. It has disappeared in aggregate. What is left is a mild positive signal on standard 2-for-1 splits, plus a lesson about the split table itself, which mixes fund share splits and mis-encoded reverse splits into a universe that looks like operating companies.
Method
Data source: Ceta Research (FMP splits data, 70K+ stocks) Event table: splits_calendar (symbol, date, numerator, denominator) Universe: US-listed securities (NYSE, NASDAQ, AMEX), market cap > $500M at time of split Period: 2000-2025 (1,968 events with complete price data) Benchmark: SPY Execution: MOC (returns measured from next-day close after event) Event filter: Forward splits only (numerator > denominator, ratio >= 1.5x) Price data: adjClose (already split-adjusted)
Event windows: T-5, T+5, T+21, T+63, T+126, T+252 trading days. Abnormal return (CAR) = stock return minus SPY return over the same window. Stratification: by split ratio (2-for-1, 3-for-1, 4-for-1, 5-for-1+, other).
Universe composition (audited August 2026)
The universe is US-listed securities, not US operating companies. Three things follow from that, and they matter for reading the tables below.
- Funds and ETFs are in the sample. 496 of the 1,968 events (25.2%) are fund or ETF share splits: 429 ETF listings and 67 closed-end funds. The 5-for-1+ category is the most affected, at 102 of 207 events (49.3%).
- Domicile is not filtered. 83.7% of events are US-domiciled. The rest are mostly foreign companies with US listings, led by Canada (3.3%) and Brazil (2.1%); 1.8% of events have no domicile recorded.
- The source split table carries encoding errors. Some reverse splits are recorded as forward splits, and some IPO-date share conversions are recorded as splits. SINTX Therapeutics appears in the data as a "100-for-1 forward split" on 2022-12-20; the SEC filing and Nasdaq corporate action notice for that exact date describe a 1-for-100 reverse split. Ally Financial appears as a "310-for-1 split" dated 2014-04-10, which is the day it began trading on the NYSE.
Where these three issues change a conclusion, we report the published figure and the cleaned re-cut side by side rather than restating the table.
The Academic Case for Post-Split Drift
Stock splits are voluntary. Management chooses to split. They choose the timing and ratio.
The standard signaling story: management splits because the stock price is high due to fundamental strength, not a temporary blip. They're saying, implicitly, that this price level is sustainable.
Fama, Fisher, Jensen, and Roll studied stock splits in 1969 in one of the earliest event studies in finance. They found that stock prices rise in the months before a split but show no abnormal returns after, evidence of market efficiency. Decades later, Ikenberry, Rankine, and Stice challenged that conclusion in 1996. Studying 2-for-1 splits, they documented abnormal returns of roughly 7.9% in the first year and 12.1% over three years. Their conclusion: the market systematically underreacts to split information.
Three mechanisms were proposed. Attention effects: splits make headlines (NVDA's 10-for-1 in 2024, AAPL's 4-for-1 in 2020), driving gradual retail buying. Liquidity improvement: lower per-share prices tighten bid-ask spreads, increasing price discovery over weeks. Institutional constraints: some funds have minimum share price rules, so splits create new eligible buyers.
All three mechanisms predict the same thing: positive drift after the split. The 2000-2025 data offers weak support for standard 2-for-1 splits and nothing measurable anywhere else.
Screening for Stock Splits
Simple screen
Run this query on Ceta Research
SELECT symbol,
    CAST(date AS DATE) AS split_date,
    numerator,
    denominator,
    ROUND(CAST(numerator AS FLOAT) / denominator, 1) AS split_ratio
FROM splits_calendar
WHERE CAST(date AS DATE) >= CURRENT_DATE - INTERVAL '90' DAY
  AND numerator > denominator
ORDER BY split_date DESC
The numerator > denominator filter is meant to exclude reverse splits (which signal the opposite: weakness, delisting risk). The split ratio tells you the magnitude: 2-for-1 is standard, 10-for-1 is rare.
Two caveats we learned the hard way, and neither screen on this page handles them. First, splits_calendar includes ETF and closed-end fund share splits alongside operating companies, so add a security-type filter if you want stocks. Second, the numerator > denominator test trusts the encoding, and a handful of reverse splits and IPO-date conversions are recorded with the numerator and denominator the wrong way round. Ratios above roughly 25:1 are where those errors cluster, so treat that tail as suspect until you check the filing.
Advanced screen: $500M+ companies with meaningful splits
Run this query on Ceta Research
WITH splits AS (
    SELECT symbol,
        CAST(date AS DATE) AS split_date,
        numerator, denominator,
        ROUND(CAST(numerator AS FLOAT) / denominator, 1) AS split_ratio
    FROM splits_calendar
    WHERE CAST(date AS DATE) >= CURRENT_DATE - INTERVAL '180' DAY
      AND numerator > denominator
      AND CAST(numerator AS FLOAT) / denominator >= 2
)
SELECT s.symbol, s.split_date, s.split_ratio,
    ROUND(k.marketCap / 1e9, 1) AS mktcap_bn
FROM splits s
JOIN key_metrics k ON s.symbol = k.symbol AND k.period = 'FY'
WHERE k.marketCap > 500000000
QUALIFY ROW_NUMBER() OVER (PARTITION BY s.symbol ORDER BY k.date DESC) = 1
ORDER BY s.split_date DESC
Adds a $500M market cap floor and requires at least a 2-for-1 ratio. Micro-cap companies split for reasons unrelated to signaling (meeting exchange listing requirements, for example). The $500M filter is meant to focus on companies where the split is a genuine signal.
It does not always work. The market cap comes from the most recent fiscal-year key_metrics row, which can be stale or wrong around a reverse split, and several 2022-23 micro-caps cleared the $500M gate in our event study when they should not have. If you are screening live, sanity-check the market cap against a current quote.
Event Study Results
Overall CAR by Window
| Window | Mean CAR | t-stat | N | Hit Rate |
|---|---|---|---|---|
| T-5 | +1.31% | +3.81 | 1,953 | 48.4% |
| T+5 | -0.25% | -1.76 | 1,965 | 49.1% |
| T+21 | -0.42% | -1.47 | 1,965 | 47.0% |
| T+63 | -0.64% | -1.54 | 1,958 | 48.0% |
| T+126 | +0.38% | +0.66 | 1,932 | 48.2% |
| T+252 | +0.58% | +0.72 | 1,918 | 48.0% |
The pre-split window (T-5) captures the run-up in the days before the effective date. Stocks appreciate as the announcement (which typically precedes the effective date by weeks) drives attention. By T+5, the CAR is slightly negative but not significant. No post-event window reaches statistical significance. The one-year CAR of +0.58% has a t-stat of just 0.72. Post-split, the data is consistent with zero abnormal returns.
By Split Ratio
2-for-1 splits (N=1,046):
| Window | Mean CAR | t-stat | Hit Rate |
|---|---|---|---|
| T+21 | +0.01% | +0.03 | 47.3% |
| T+63 | +0.35% | +0.66 | 49.6% |
| T+252 | +2.58% | +2.45 | 49.9% |
2-for-1 splits show a modest positive drift that reaches significance at one year (t=2.45, p<0.05). This is roughly consistent with Ikenberry's 1996 finding, though much weaker than the 7.9% they documented. The standard forward split still carries a mild positive signal.
This is the one ratio result that survives the universe audit intact. Restricted to US-domiciled common stock, with funds and ETFs removed, the 2-for-1 one-year CAR is +3.36% (t=2.51, n=666). Cleaning the universe makes this leg slightly stronger, not weaker.
3-for-1 splits (N=195):
| Window | Mean CAR | t-stat | Hit Rate |
|---|---|---|---|
| T+21 | -2.06% | -1.94 | 44.1% |
| T+63 | -2.85% | -2.53 | 41.1% |
| T+252 | +1.01% | +0.37 | 44.2% |
3-for-1 splits show short-term underperformance at T+63 (significant at 5%), but the one-year result is close to zero.
4-for-1 splits (N=117):
| Window | Mean CAR | t-stat | Hit Rate |
|---|---|---|---|
| T+63 | -2.33% | -1.19 | 52.1% |
| T+252 | -8.35% | -2.87 | 41.8% |
The 4-for-1 result does not survive the universe audit either. Remove funds and ETFs and the one-year CAR is -8.03% with a t-stat of -1.47 (n=46). The point estimate barely moves. The significance is gone, because what remains after the funds come out is 46 events.
5-for-1+ splits (N=207):
| Window | Mean CAR | t-stat | Hit Rate |
|---|---|---|---|
| T+63 | -4.49% | -2.19 | 36.3% |
| T+126 | -7.02% | -2.91 | 38.7% |
| T+252 | -11.67% | -4.00 | 31.3% |
This is the number the original version of this post built its conclusion on, and it is the number the audit dismantled. Splitting the one-year window by what the events actually are:
| 5-for-1+ group at T+252 | Mean CAR | t-stat | N |
|---|---|---|---|
| Fund and ETF share splits | -12.37% | -3.51 | 98 |
| Non-fund, ratio above 25:1 | -40.86% | -2.98 | 11 |
| Non-fund common stock, 5:1 to 25:1 | -7.14% | -1.47 | 86 |
| Same, US-domiciled only | -2.16% | -0.37 | 50 |
(The group counts are below the 207 category total because events without a full year of subsequent price data drop out of the T+252 window. The US-domiciled row is a subset of the row above it, not a fourth group.)
Read down that table and the finding falls apart in two steps. Just under half the category is funds, and fund share splits carry a large, significant negative CAR of their own. The 11 records above a 25:1 ratio then contribute an average of -40.86%, and the biggest drag among them is not a split at all: SINTX at -121.14% is a 1-for-100 reverse split recorded as a 100-for-1 forward split. Ally Financial at -31.28% is the IPO conversion record. Rank all 11 records by one-year CAR and the five biggest drags are all confirmed or suspected data errors. The two confirmed genuine splits in the group, Chipotle (50:1, 2024) at -24.52% and Berkshire Hathaway Class B (50:1, 2010) at -4.41%, sit mid-pack at 7th and 8th most negative. The stratum is measuring data quality, not split behaviour.
What is left is 86 genuine common-stock splits at 5:1 to 25:1, returning -7.14% at one year with a t-stat of -1.47. That is a negative point estimate you cannot distinguish from zero. Among US-domiciled names it shrinks to -2.16% (t=-0.37).
We do not have a fund-free re-cut for the T+63 and T+126 windows in this category, so we make no claim about those rows either way.
The interpretation we published, that extreme split ratios mark overheated retail interest rather than management confidence, is not supported by the cleaned data. NVIDIA's 10-for-1 split in June 2024 did follow a 730% run, and it did underperform afterwards. It sits in the genuine 5:1 to 25:1 group, and that group's effect is not statistically distinguishable from zero. The anecdote is real. It was never evidence.
The Split Ratio Effect
The ratio effect is half real. One leg holds up under a clean universe. The other does not.
- Standard splits (2-for-1): Modest positive drift, +2.58% at one year as published and +3.36% (t=2.51, n=666) on US-domiciled common stock. Significant either way. Consistent with the signaling hypothesis. These companies typically split at reasonable valuations after steady appreciation.
- Extreme splits (5-for-1+): The published -11.67% is mostly composition. Fund share splits and an 11-record above-25:1 stratum full of encoding errors carry it. The 86 genuine common-stock splits in that bucket return -7.14% at one year with a t-stat of -1.47, and US-domiciled names among them return -2.16% (t=-0.37). Neither is significant.
So the "buy after split" trade still returns nothing in aggregate, but not for the reason we first gave. It is not that a positive standard-split effect is being canceled by a negative extreme-ratio effect. It is that only the standard-split effect is measurable at all, and it is small.
There is a second lesson here, and it is about data rather than markets. A category that is 49.3% funds and salted with backwards-encoded reverse splits will manufacture a large, significant-looking negative drift out of nothing. The t-stat of -4.00 was real arithmetic on the wrong sample.
Split Frequency Over Time
Forward splits have become less common since 2000. Peak years were 2013-2018. Many companies now let share prices run high. Berkshire Hathaway Class A trades above $600,000. Before its 20-for-1 split in 2022, Google traded above $2,800.
When a company does split in this environment, it stands out more. That salience doesn't show up as post-split alpha in aggregate, and the only measurable exception in 2000-2025 is the modest 2-for-1 result.
Run It Yourself
# Clone the repo and set your API key
git clone https://github.com/ceta-research/backtests
cd backtests
export CR_API_KEY="your-key-here"  # get at cetaresearch.com

# Run the event study (US, MOC execution)
python3 stock-split/backtest.py --preset us --output stock-split/results --verbose

# Legacy same-day execution (for comparison with old academic studies)
python3 stock-split/backtest.py --preset us --no-next-day --output stock-split/results --verbose

# Screen for recent splits
python3 stock-split/screen.py --days 90

# $500M+ companies, 2-for-1 and above
python3 stock-split/screen.py --days 180 --min-mktcap 500000000 --min-ratio 2.0
Limitations
Universe contamination. The event set is US-listed securities, not US operating companies. 496 of 1,968 events (25.2%) are fund or ETF share splits, and only 83.7% of events are US-domiciled, the rest being mostly foreign companies with US listings. This is the defect that broke the extreme-ratio finding, and the tables above are reported as originally run, with cleaned re-cuts alongside them where they change a conclusion.
Source data encoding. splits_calendar contains reverse splits recorded as forward splits and IPO-date share conversions recorded as splits. Our forward-split filter (numerator > denominator) trusts the encoding and therefore cannot catch either. The errors cluster above a 25:1 ratio, where 11 non-fund records average -40.86% at one year. We verified SINTX (2022-12-20) against its SEC filing and Nasdaq corporate action notice, and Ally Financial (2014-04-10) against its NYSE debut date. The rest of that stratum fits the same pattern but was not individually source-confirmed.
Market cap filter reliability. The $500M floor uses fiscal-year key_metrics market cap, which is stale or wrong around reverse-split events. Several 2022-23 micro-caps passed the gate that should not have.
Incomplete re-cuts. We recomputed the cleaned subgroups at T+252 and T-5 only. The T+63 and T+126 rows in the by-ratio tables have no fund-free version here, so read them as published rather than as cleaned.
Announcement vs effective date. Our data uses the effective split date, not the announcement date. The announcement typically occurs weeks earlier. Some of the pre-split (T-5) return likely captures announcement-period drift, making the true pre-announcement window longer than we measure.
Selection bias. Companies that split tend to be recent outperformers. Part of any post-split return may be mean reversion from a momentum run-up, not a split-specific effect. Our CAR calculation (stock minus SPY) controls for market-wide moves but not for company-specific momentum.
MOC execution. Post-event returns are measured from the next trading day close (market-on-close execution). This models realistic execution but means the immediate post-split day return is absorbed into the base price.
Small sample for extreme ratios. The 4-for-1 category has 117 events and 5-for-1+ has 207, against 1,046 for 2-for-1. After cleaning, those categories get much smaller: 46 non-fund 4-for-1 events at one year, and 86 non-fund 5:1 to 25:1 events, of which 50 are US-domiciled. At those sample sizes a large point estimate can still fail a t-test, which is exactly what happened.
Transaction costs. These are gross abnormal returns. Capturing the pre-split window requires knowing the effective date in advance, which means monitoring the announcement.
Takeaway
The pre-split window is real but modest: +1.31% vs SPY in 5 trading days, t-stat of 3.81, and +1.47% (t=3.33) on US-domiciled common stock. The post-split drift documented in 1969 and 1996 has not reversed in 2000-2025 US data. It has disappeared in aggregate.
The ratio-specific signal is half alive. Standard 2-for-1 splits still show mild outperformance, +2.58% at one year as published and +3.36% (t=2.51) on a fund-free US-domiciled cut. The extreme-ratio leg does not hold: the published -11.67% is carried by fund share splits and mis-encoded records, and the genuine common-stock version is -7.14% (t=-1.47), not significant. The blanket "buy after split" signal is dead. The "avoid high-ratio splits" signal was never there.
Screening for recent splits is easy and worth monitoring, with the caveat that the split table needs cleaning before you trust a stratified result. The edge, if it exists, is in the pre-split window and in the modest standard-split drift, not in the ratio tail.
Data: Ceta Research (FMP splits data, 2000-2025). Event study uses splits_calendar + stock_eod + key_metrics tables. US-listed securities (NYSE, NASDAQ, AMEX), market cap > $500M, including fund and ETF listings. Abnormal returns computed vs SPY benchmark with MOC execution. Cleaned subgroup figures recomputed from per-event returns in August 2026. Full methodology: github.com/ceta-research/backtests. Past performance does not guarantee future results. This is educational content, not investment advice.
References
- Fama, E., Fisher, L., Jensen, M. & Roll, R. (1969). "The Adjustment of Stock Prices to New Information." International Economic Review, 10(1), 1-21.
- Ikenberry, D., Rankine, G. & Stice, E. (1996). "What Do Stock Splits Really Signal?" Journal of Financial and Quantitative Analysis, 31(3), 357-375.
- Desai, H. & Jain, P. (1997). "Long-Run Common Stock Returns following Stock Splits and Reverse Splits." Journal of Business, 70(3), 409-433.

