
Sector Mean Reversion in Sweden: 10.79% CAGR and the Highest Win Rate in the Study
Sweden's sector mean reversion returned 10.79% annually over 26 years and beat OMX30 in 19 of 26 calendar years (73.1%) and 67.31% of quarters, the most consistent record of 13 exchanges. The tradeoff: a max drawdown of -62.27% and a beta above 1.

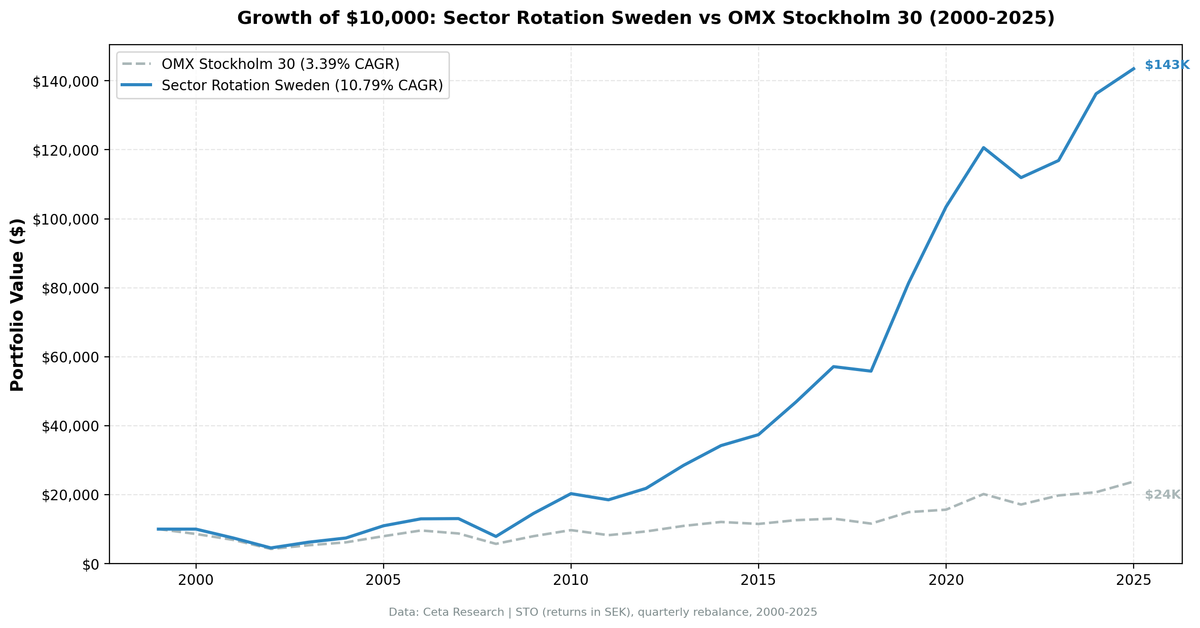
Sweden's sector rotation strategy returned 10.79% annually from 2000 to 2025, in SEK, against the OMX Stockholm 30's 3.39%. It beat the index in 19 of 26 calendar years (73.1%) and in 67.31% of the 104 quarters, and both are the highest of any exchange in the study. The excess CAGR of +7.40% over a weak domestic index tells a different story than a comparison to SPY would: OMX30 has compounded slowly, and the sector rotation strategy compounded well above it.
Contents
- Method
- What We Found
- Most Frequently Selected Sectors
- Notable Years
- Full Annual Returns
- Backtest Methodology
- Limitations
- Takeaway
- Part of a Series
- References
We tested sector mean reversion on 13 exchanges. Sweden sits in the top five on absolute returns. Its year-to-year consistency against the local benchmark is the best.
Data: FMP financial data warehouse, 2000-2025. Updated August 2026.
Method
Data source: Ceta Research (FMP financial data warehouse) Universe: STO (Nasdaq Stockholm), market cap > SEK 1B (~$90M USD) Period: 2000-2025 (26 years, 104 quarterly rebalance periods) Rebalancing: Quarterly (January, April, July, October) Signal: Buy all stocks in the bottom 2 sectors by 12-month trailing equal-weighted return Benchmark: OMX Stockholm 30 (^OMX) Cash rule: Hold cash if fewer than 5 sectors qualify, or fewer than 10 stocks pass the filters Transaction costs: Size-tiered model
This is a pure price signal. No fundamental data enters it, and entry is at the next available close after the signal date. Full methodology: backtests/METHODOLOGY.md
What We Found
Sweden's result looks different when measured against the local benchmark. The OMX30 has returned only 3.39% annually since 2000, weighed down by the dot-com collapse (STO was heavily Ericsson-exposed), the 2008 crisis, and weak recent years. Against that backdrop, the sector rotation strategy's 10.79% CAGR produces a +7.40% excess, and it beat OMX30 in nearly three out of four calendar years.
The capture ratios are asymmetric in the strategy's favor: 129.65% of the index's upside against 82.23% of its downside. What that doesn't buy is drawdown protection. Max drawdown was -62.27%, only 3.9 points shallower than the OMX30's own -66.13%, and the beta of 1.058 means the portfolio carried slightly more market risk than the index. The +7.32% Jensen alpha is what remains after adjusting for that beta.
| Metric | Portfolio | OMX Stockholm 30 |
|---|---|---|
| CAGR | 10.79% | 3.39% |
| Excess CAGR vs OMX30 | +7.40% | |
| Total Return | 1335.01% | 137.76% |
| Max Drawdown | -62.27% | -66.13% |
| Annualized Volatility | 23.98% | 19.49% |
| Sharpe Ratio | 0.367 | 0.071 |
| Beta | 1.058 | |
| Jensen Alpha | +7.32% | |
| Up Capture | 129.65% | |
| Down Capture | 82.23% | |
| Win Rate vs OMX30 (quarters) | 67.31% | |
| Win Rate vs OMX30 (calendar years) | 19 of 26 (73.1%) | |
| Avg Stocks per Period | 26.3 | |
| Cash Periods | 4 of 104 |
SEK 10,000 invested in January 2000 grew to SEK 143,501 by end of 2025 under this strategy. The same money in the OMX30 reached SEK 23,776.
Most Frequently Selected Sectors
Over 104 quarters, these were the sectors that appeared most often as the bottom two by trailing return:
| Sector | Quarters Selected |
|---|---|
| Basic Materials | 40 (38%) |
| Communication Services | 30 (28%) |
| Real Estate | 29 (27%) |
Basic Materials dominates, appearing in 40 of 104 quarters. Sweden has a large mining and forestry industry (Boliden, SSAB, SCA, Stora Enso), and these companies cycle through extended periods of sector underperformance that the mean reversion signal picks up reliably. Communication Services and Real Estate together add another 59 quarters of selection, with Technology close behind at 28.
Notable Years
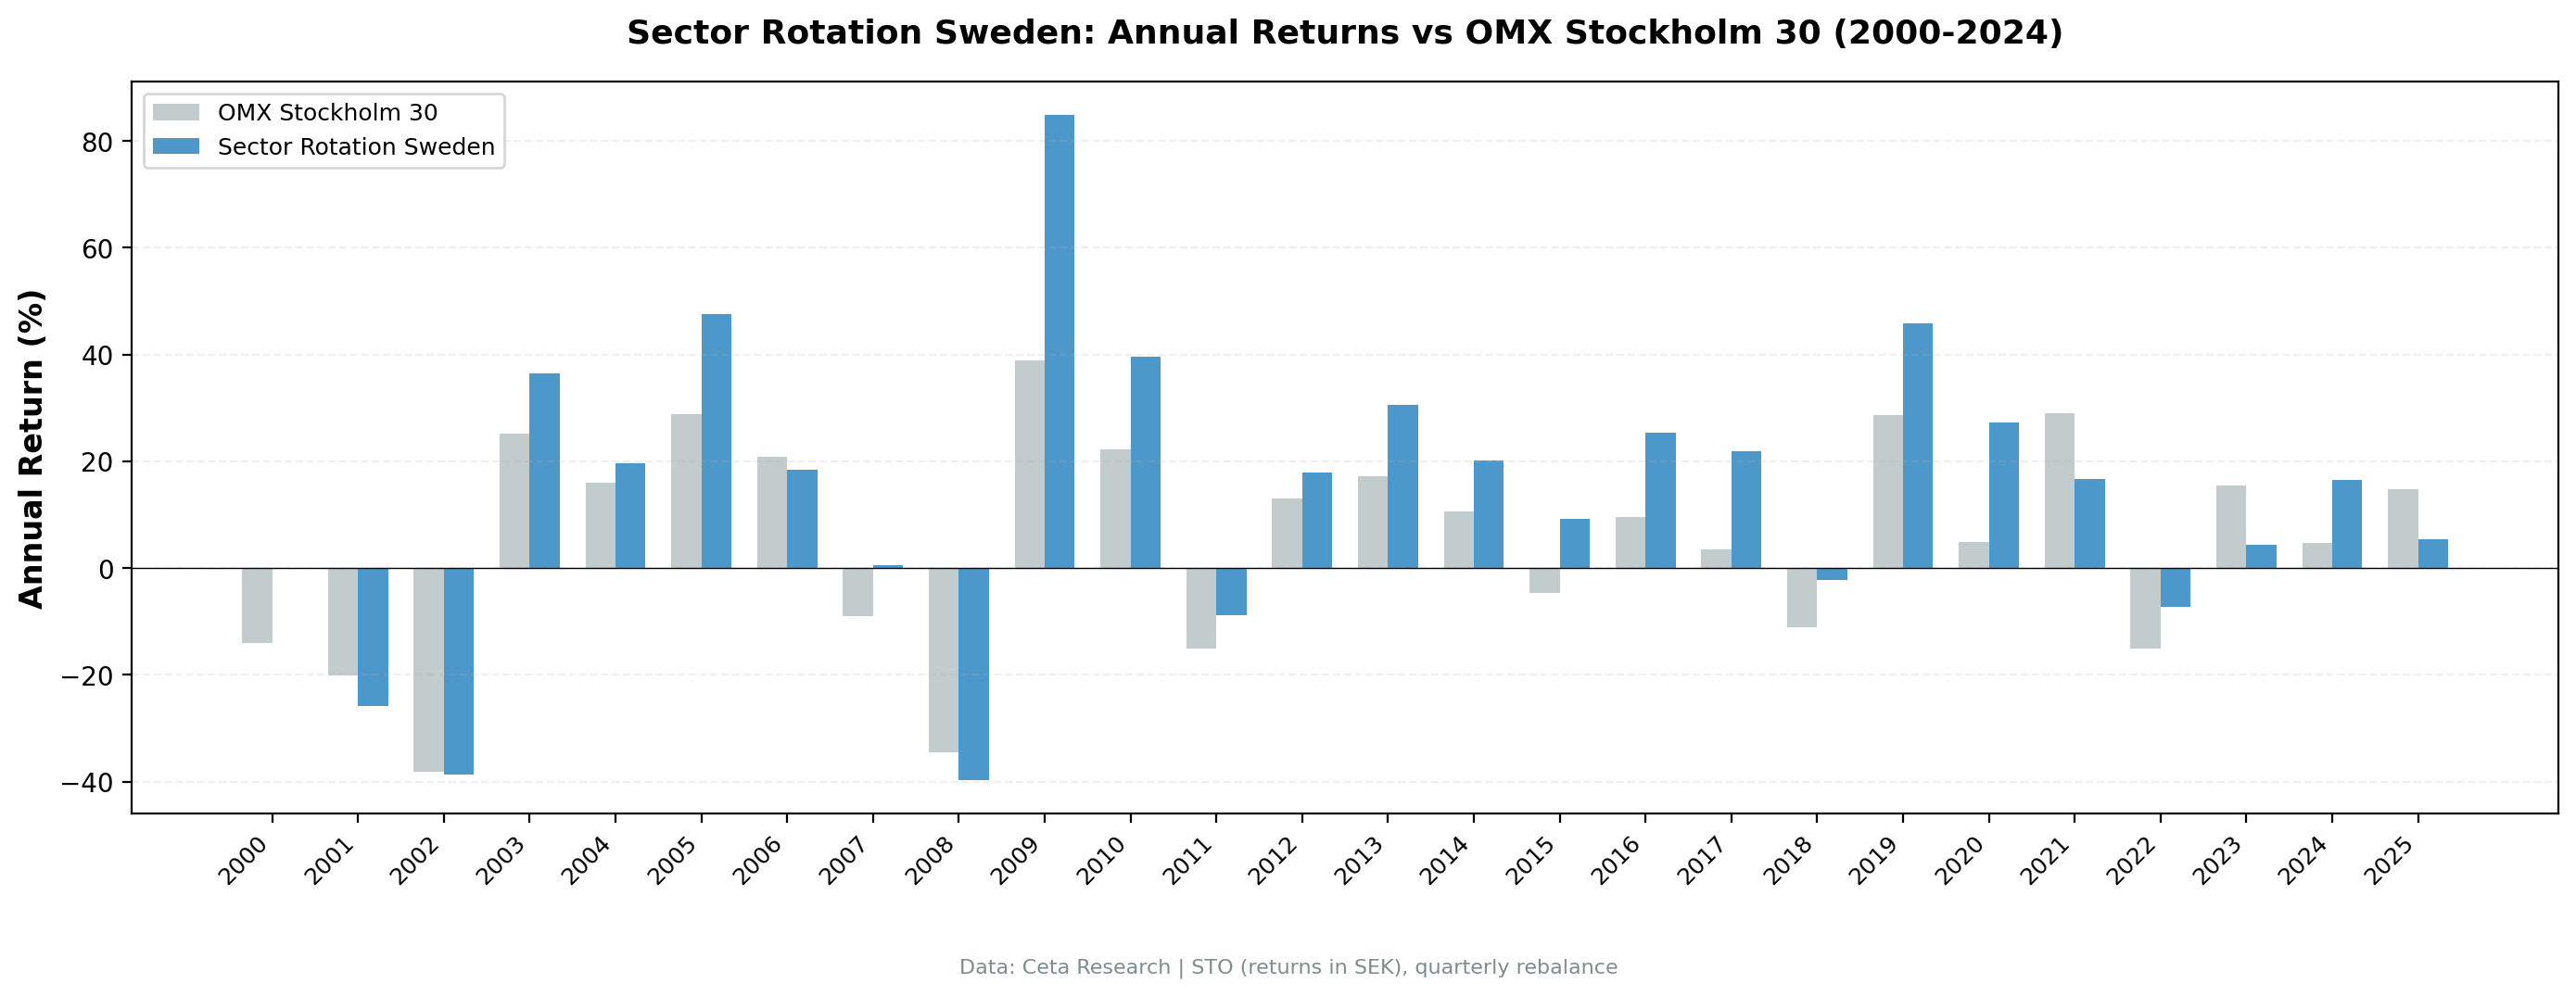
2001-2002: -25.77% and -38.69%. Sweden's stock market was heavily exposed to telecoms during the dot-com era. Ericsson alone accounted for a large share of the STO index, and it collapsed from 2000 to 2002. The mean reversion strategy bought into beaten-down sectors before they finished falling. The losses in 2001 and 2002 are the cost of being early, and the payoff came in 2003. The strategy sat in cash through 2000 while OMX30 fell 14.04%, then lagged the index by 5.69 and 0.53 points as the full telecom unwind played out.
2003-2004: +36.48% and +19.61%. The post-crash reversal. Sectors that had been hammered in the prior two years led the recovery: +11.28pp excess in 2003, followed by +3.58pp in 2004.
2005: +47.57%. The strongest single year in the early period. Basic Materials and Real Estate surged as Sweden benefited from the global commodities cycle and a recovering domestic economy. The +18.74pp excess over OMX30 reflects how deeply cyclical the selected sectors were.
2008: -39.73% vs OMX30 -34.45%. Sweden fell harder than the benchmark in the financial crisis, the worst absolute year in the record. An 82.23% down capture is an average across many quarters, and 2008 is the reminder that averages don't hold in every crisis. The max drawdown of -62.27% dates from this stretch.
2009: +84.85%. The recovery was strong. Basic Materials and Real Estate, which had been crushed, bounced aggressively. The +45.97pp excess over OMX30 is the widest single-year gap in Sweden's record. The same mechanism that produced the 2008 loss produced the 2009 gain.
2016: +25.35% vs OMX30 +9.50%. Beaten-down Basic Materials and Real Estate recovered sharply in the global reflation trade after the 2015 selloff, worth +15.85pp.
2019-2020: +45.74% and +27.21%. Back-to-back strong years from beaten-down sectors, +17.09pp and +22.41pp of excess. The 2020 result came through COVID disruption rather than in spite of it: OMX30 managed only +4.80% that year.
2021: +16.59% vs OMX30 +28.95%. The widest shortfall in the record at -12.36pp. The index ran and the laggard sectors didn't.
Full Annual Returns
| Year | Portfolio | OMX30 | Excess |
|---|---|---|---|
| 2000 | 0.00% (cash) | -14.04% | +14.04% |
| 2001 | -25.77% | -20.09% | -5.69% |
| 2002 | -38.69% | -38.16% | -0.53% |
| 2003 | +36.48% | +25.19% | +11.28% |
| 2004 | +19.61% | +16.03% | +3.58% |
| 2005 | +47.57% | +28.84% | +18.74% |
| 2006 | +18.43% | +20.84% | -2.41% |
| 2007 | +0.55% | -9.08% | +9.63% |
| 2008 | -39.73% | -34.45% | -5.28% |
| 2009 | +84.85% | +38.89% | +45.97% |
| 2010 | +39.50% | +22.14% | +17.37% |
| 2011 | -8.84% | -15.08% | +6.24% |
| 2012 | +17.93% | +13.06% | +4.87% |
| 2013 | +30.58% | +17.20% | +13.37% |
| 2014 | +20.16% | +10.53% | +9.63% |
| 2015 | +9.27% | -4.74% | +14.01% |
| 2016 | +25.35% | +9.50% | +15.85% |
| 2017 | +21.85% | +3.47% | +18.38% |
| 2018 | -2.30% | -11.01% | +8.71% |
| 2019 | +45.74% | +28.65% | +17.09% |
| 2020 | +27.21% | +4.80% | +22.41% |
| 2021 | +16.59% | +28.95% | -12.36% |
| 2022 | -7.21% | -15.07% | +7.86% |
| 2023 | +4.43% | +15.38% | -10.95% |
| 2024 | +16.56% | +4.76% | +11.81% |
| 2025 | +5.32% | +14.84% | -9.52% |
The 19-of-26 record shows up clearly in the table. Only seven years trail OMX30: 2001, 2002, 2006, 2008, 2021, 2023, and 2025. The absolute losses in 2001 (-25.77%) and 2002 (-38.69%) are meaningful, but the 2003 to 2007 run recaptured them. The lag in 2021, 2023 and 2025 is the main risk to note in the recent record.
Backtest Methodology
| Parameter | Value |
|---|---|
| Strategy | Sector Mean Reversion |
| Signal | Bottom 2 sectors by 12-month trailing EW return |
| Rebalancing | Quarterly (Jan, Apr, Jul, Oct) |
| Weighting | Equal weight within selected sectors |
| Universe | STO (Nasdaq Stockholm), market cap > SEK 1B (~$90M) |
| Period | 2000-2025 (26 years, 104 quarters) |
| Benchmark | OMX Stockholm 30 (^OMX) |
| Cash rule | Hold cash if fewer than 5 sectors qualify or fewer than 10 stocks pass filters |
| Transaction costs | Size-tiered model |
| Execution | Entry at the next available close after the signal date |
| Academic basis | Moskowitz & Grinblatt (1999) |
Limitations
Currency. All returns are in SEK. SEK/USD movements affect realized returns for foreign investors. The Swedish krona has been more volatile against the dollar than, say, the Swiss franc, and currency effects can materially shift realized returns in any given year.
Drawdown, not downside protection. The 82.23% down capture reads well, but the max drawdown of -62.27% is only 3.9 points shallower than the OMX30's -66.13%, and the beta of 1.058 is above the index. In 2008 the portfolio fell 39.73% against the benchmark's 34.45%. Investors who can't tolerate deep, multi-year drawdowns should weigh that against the 19-of-26 year record.
Small portfolio. The average of 26.3 stocks per period is concentrated relative to the 100.2 average in Taiwan or the much larger universes in the US. Fewer stocks mean more variance per year. Years like 2023 (+4.43%) or 2001 (-25.77%) are partly a function of how few positions the strategy holds.
Basic Materials concentration. 40 of 104 quarters selected Basic Materials, the heaviest single-sector tilt in Sweden's record. This strategy is effectively a levered bet on global commodity and industrial cycles as filtered through the Swedish market. If that cycle changes structurally, the rotation pattern will change with it.
Costs are modelled, frictions aren't. A size-tiered transaction cost model is applied to every position, but bid-ask spread and market impact are not. On a 26-stock Swedish portfolio rebalanced quarterly, spread is the larger omission.
Recent record. From 2021 to 2025, Sweden lagged OMX30 in three of five years, with 2021 the worst at -12.36pp. Mean reversion signals can go quiet for extended stretches even when the long-run record is strong.
Takeaway
Sweden's sector mean reversion delivers 10.79% CAGR over 26 years against the OMX30's 3.39%. The +7.40% excess CAGR is partly explained by how weak the OMX30 has been: a 3.39% local index is a low bar to clear, but it reflects a real market reality for investors benchmarked to Swedish equities. Beating it in 19 of 26 calendar years and 67.31% of quarters is the most consistent record in the study.
The cost isn't down capture, which at 82.23% is better than the index. It's depth. A -62.27% max drawdown against the OMX30's -66.13% means the strategy went almost as deep as the market did at the worst point, and it did so with a beta above 1.
The strongest years are post-crash recoveries: 2003 (+36.48%), 2005 (+47.57%), 2009 (+84.85%), and 2019 (+45.74%). The worst years are when the strategy buys into a sector before the bottom is in (2001 and 2002) or when the index runs ahead of the laggards (2021, 2023, 2025). The 2009 rebound (+84.85% vs OMX30 +38.89%) shows the strategy at its best: beaten-down cyclicals making a sharp return.
Part of a Series
We tested this strategy across 13 exchanges. Other analyses in the series:
- US (NYSE + NASDAQ + AMEX) →
- India (NSE) →
- Korea (KSC) →
- Taiwan (TAI + TWO) →
- Global comparison →: all 13 exchanges ranked by Sharpe, CAGR, and down capture
References
Moskowitz, T. J., & Grinblatt, M. (1999). Do industries explain momentum? Journal of Finance, 54(4), 1249-1290.
Data: Ceta Research (FMP financial data warehouse), 2000-2025. Universe: STO (Nasdaq Stockholm). Market cap > SEK 1B (~$90M). Returns in SEK. Benchmark: OMX Stockholm 30. Full methodology: METHODOLOGY.md. Past performance does not guarantee future results.
Past performance does not guarantee future results. This is educational content, not investment advice.

