
Sector Mean Reversion in Korea: Highest CAGR and Shallowest Drawdown of 13 Exchanges
Korea's sector mean reversion produced 14.28% CAGR over 26 years, the highest of 13 exchanges, with a Sharpe of 0.434 and a max drawdown of -35.09% against the KOSPI's own -52.73%. Beta 0.918, Jensen alpha +8.95%: the edge is alpha, not leverage.

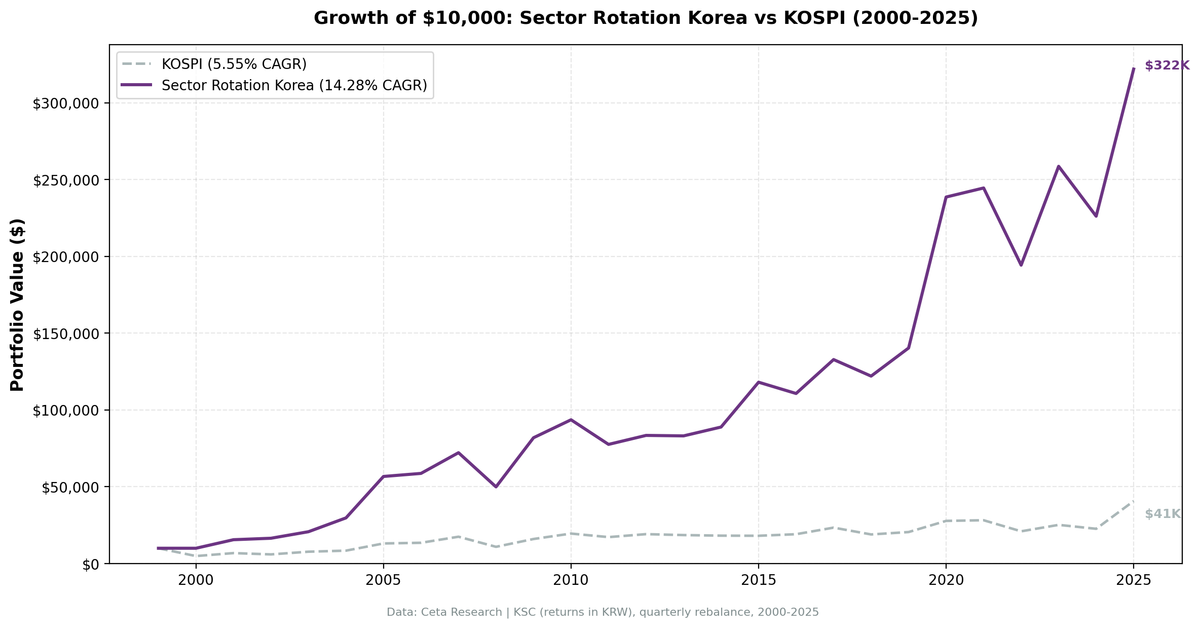
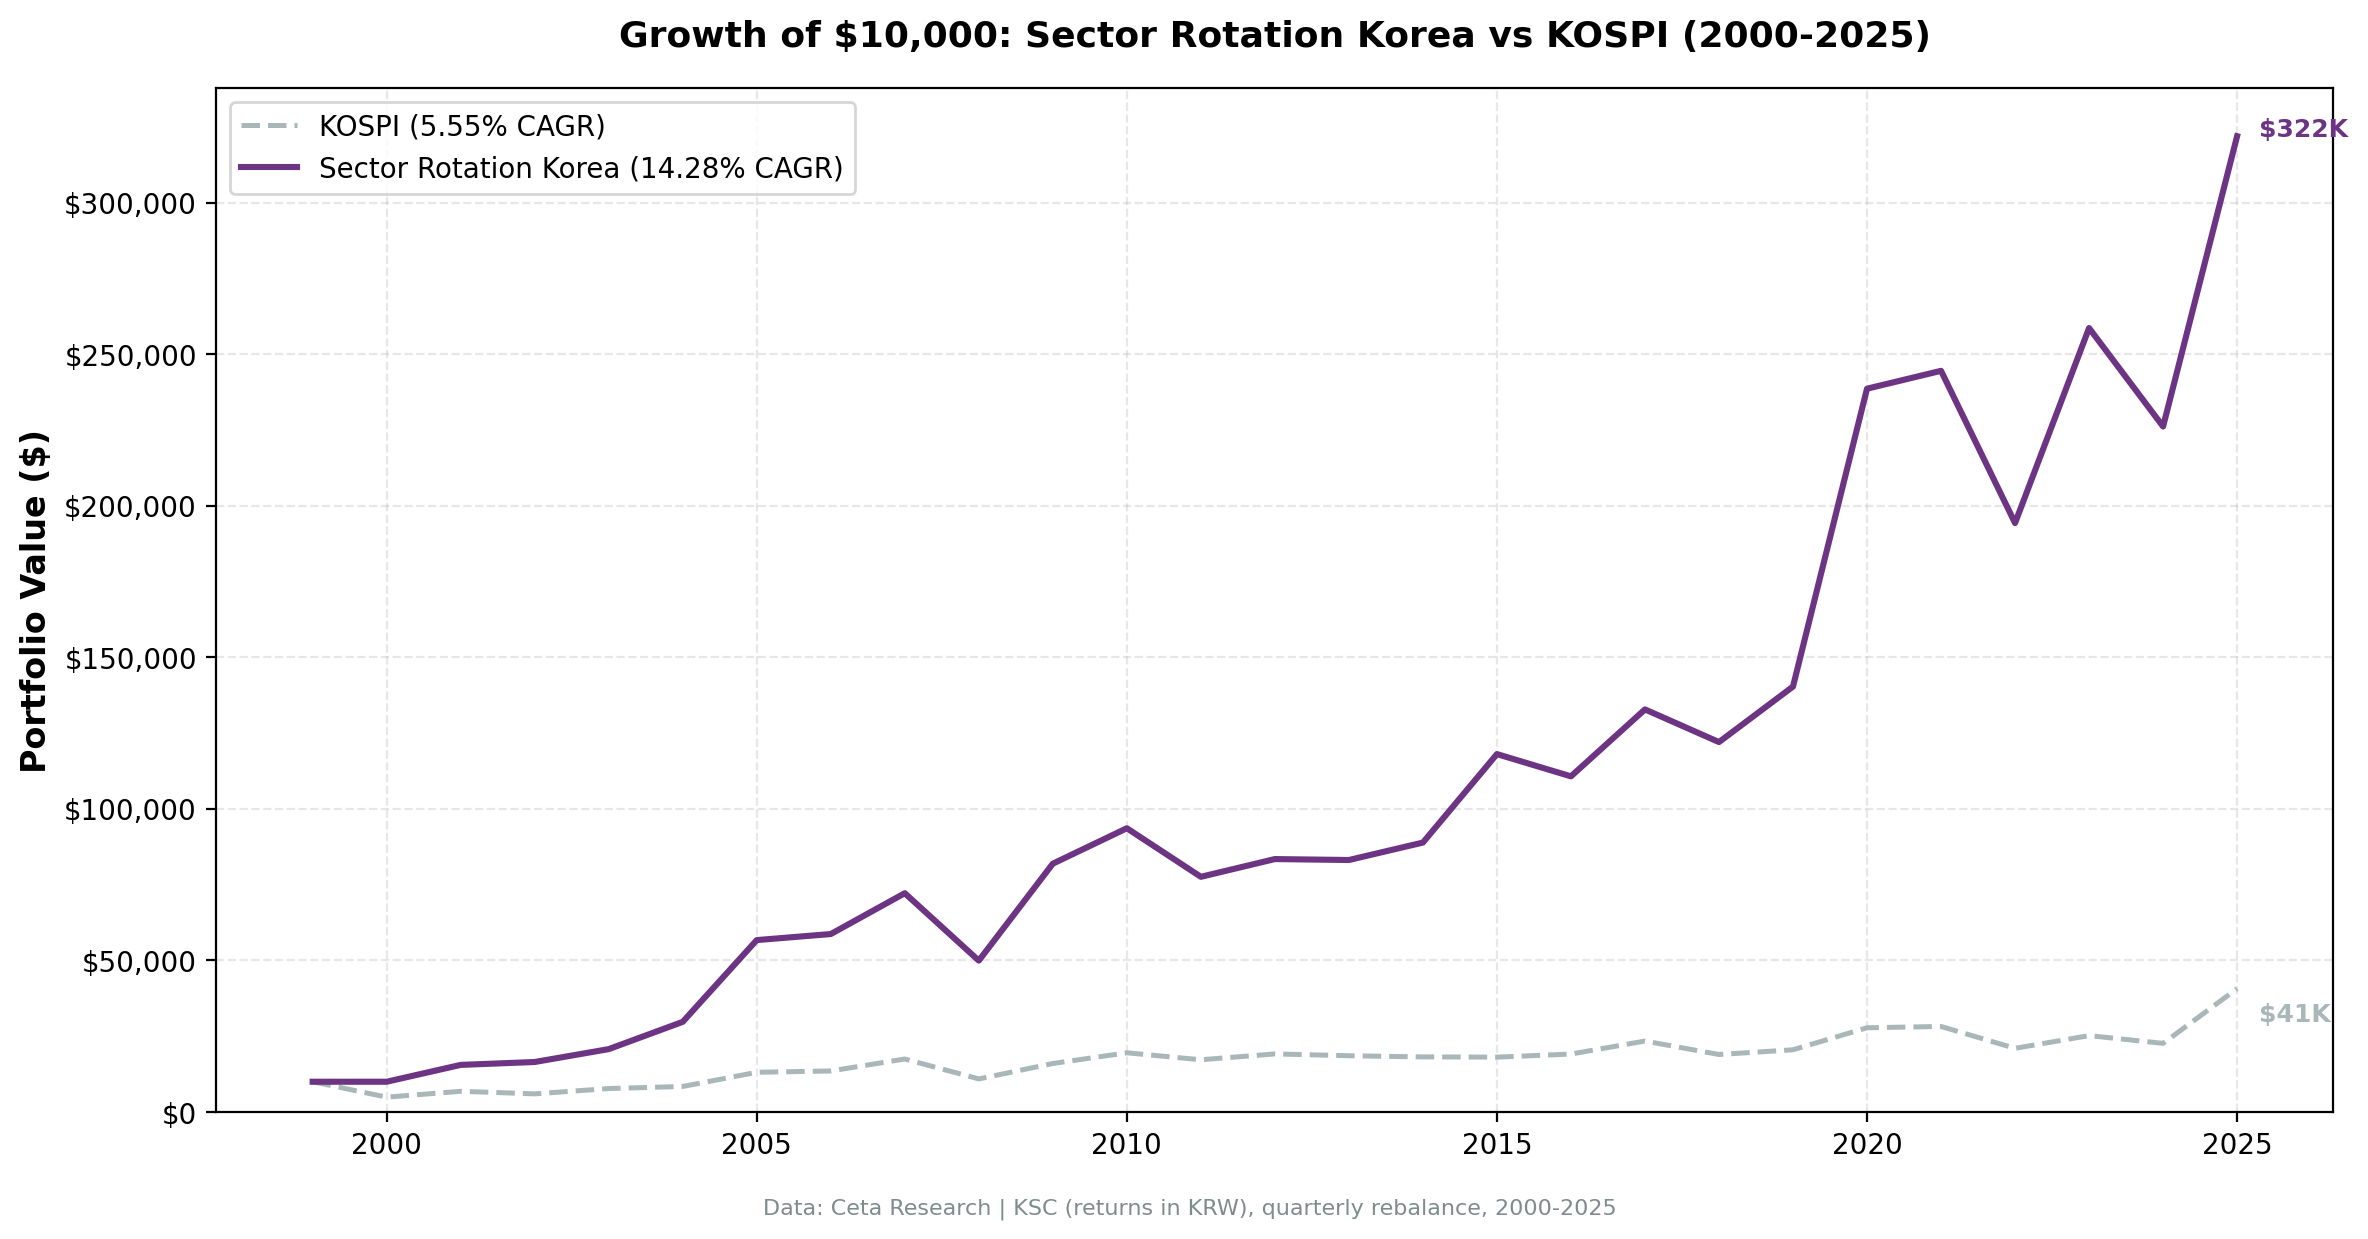
Korea's sector mean reversion returned 14.28% annually in KRW from 2000 to 2025, against the KOSPI's 5.55%. That's the highest CAGR of the 13 exchanges we tested. The excess of +8.74% a year came with a max drawdown of -35.09% while the KOSPI itself fell -52.73%, so the portfolio beat its index on return, on risk-adjusted return, and on drawdown at the same time. Over 26 years that produced a 3118.04% total return, turning KRW 10,000 into KRW 321,804.
Contents
- Method
- What We Found
- Most Selected Sectors (104 quarters)
- Notable Years
- Full Annual Returns
- Backtest Methodology
- Limitations
- Takeaway
- Part of a Series
- References
Data: FMP financial data warehouse, 2000-2025. Updated August 2026.
Method
Data source: Ceta Research (FMP financial data warehouse) Universe: KSC (Korea Stock Exchange), market cap > KRW 300B (~$220M USD) Period: 2000-2025 (26 years, 104 quarterly periods) Rebalancing: Quarterly (January, April, July, October) Signal: Buy all stocks in the bottom 2 sectors by 12-month trailing equal-weighted return Portfolio construction: Equal weight all qualifying stocks in selected sectors Benchmark: KOSPI (^KS11) Cash rule: Hold cash if fewer than 5 sectors qualify, or fewer than 10 stocks pass the filters Transaction costs: Size-tiered model Currency note: Returns are in KRW (local currency). Benchmark is KOSPI, also in KRW.
This is a pure price signal. No fundamental data enters it, and entry is at the next available close after the signal date. Full methodology: backtests/METHODOLOGY.md
What We Found
Korea is the strongest result in the study. The Sharpe of 0.434 is second only to Taiwan's 0.485, and the CAGR of 14.28% is the highest of the 13 exchanges. The -35.09% max drawdown is also the shallowest of the 13, and it sits against a KOSPI that lost -52.73% at its worst. That 17.6-point drawdown gap is the widest any market in the study opened up on its own index. Taiwan is next at 15.7 points.
The beta of 0.918 with a Jensen alpha of +8.95% is what makes the result credible. The portfolio carried slightly less market risk than the index and still compounded at more than twice the rate, so this is alpha rather than leverage.
| Metric | Portfolio | KOSPI |
|---|---|---|
| CAGR | 14.28% | 5.55% |
| Excess CAGR | +8.74% | |
| Total Return | 3118.04% | 306.94% |
| Max Drawdown | -35.09% | -52.73% |
| Annualized Volatility | 25.98% | 23.74% |
| Sharpe Ratio | 0.434 | 0.107 |
| Beta | 0.918 | |
| Jensen Alpha | +8.95% | |
| Win Rate (quarters vs KOSPI) | 57.69% | |
| Up Capture | 115.58% | |
| Down Capture | 64.38% | |
| Avg Stocks per Period | 51.2 | |
| Cash Periods | 4 of 104 |
The down capture of 64.38% is the headline number. When the KOSPI fell, this portfolio fell only 64.38% as much. Combined with 115.58% up capture, the strategy gained slightly more than the index when markets rose and lost a third less when they fell. That asymmetry is where the +8.74% excess CAGR comes from.
The portfolio held an average of 51.2 stocks per quarter, manageable for institutional or serious individual investors. Cash periods were 4 of 104 quarters, all four in 2000, when the universe didn't clear the 5-sector and 10-stock thresholds.
Most Selected Sectors (104 quarters)
| Sector | Quarters Selected |
|---|---|
| Communication Services | 28 (26%) |
| Financial Services | 26 (25%) |
| Energy | 26 (25%) |
Korea's underperformance cycles run through telecom, financials, and energy. Healthcare and Consumer Defensive follow at 23 quarters each, and Technology at 21, so the tech-heavy names that define Korea's index (Samsung, SK Hynix) are only a part of what the signal buys. Real Estate qualified in 3 quarters out of 104.
That spread is part of why Korea's risk profile looks manageable. The portfolio wasn't persistently concentrated in a single sector.
Notable Years
2001: +55.59%, KOSPI +39.16%. The strategy outperformed a rising KOSPI by 16.43 percentage points. Korean equities recovered broadly from the dot-com selloff, and the selected sectors participated fully.
2004: +43.34%, KOSPI +8.82%. A +34.51pp excess in a year when the index went almost nowhere. Sectors that had lagged through 2002 and 2003 did the work.
2005: +90.63%, KOSPI +55.45%. Korea's out-of-favor sectors had been cheap for several years post-dot-com. When the reversion came, it came hard: +35.18pp excess.
2008: -30.81%, KOSPI -37.55%. The strategy held up better during the financial crisis, +6.75pp ahead in the worst absolute year of the backtest. The -35.09% max drawdown reflects the 2008 episode and the quarters around it.
2020: +70.01%, KOSPI +35.37%. COVID recovery was sharp for Korean sectors that had been underperforming before the pandemic, worth +34.64pp for the year.
2025: +42.35%, KOSPI +79.65%. The KOSPI surged while the portfolio gained a respectable 42% and still lost by 37.30 percentage points. This is the worst single-year shortfall in the record, driven by concentrated index leadership in sectors the mean reversion signal avoids by construction.
Full Annual Returns
| Year | Portfolio | KOSPI | Excess |
|---|---|---|---|
| 2000 | 0.00% (cash) | -50.81% | +50.81% |
| 2001 | +55.59% | +39.16% | +16.43% |
| 2002 | +6.11% | -12.38% | +18.49% |
| 2003 | +25.75% | +29.30% | -3.55% |
| 2004 | +43.34% | +8.82% | +34.51% |
| 2005 | +90.63% | +55.45% | +35.18% |
| 2006 | +3.51% | +3.31% | +0.20% |
| 2007 | +22.94% | +29.14% | -6.20% |
| 2008 | -30.81% | -37.55% | +6.75% |
| 2009 | +64.04% | +46.55% | +17.50% |
| 2010 | +14.26% | +22.05% | -7.78% |
| 2011 | -17.11% | -11.77% | -5.34% |
| 2012 | +7.54% | +11.21% | -3.67% |
| 2013 | -0.37% | -3.15% | +2.77% |
| 2014 | +6.92% | -2.07% | +8.99% |
| 2015 | +32.83% | -0.40% | +33.23% |
| 2016 | -6.22% | +5.60% | -11.82% |
| 2017 | +19.94% | +22.38% | -2.44% |
| 2018 | -8.11% | -18.94% | +10.83% |
| 2019 | +15.00% | +8.22% | +6.78% |
| 2020 | +70.01% | +35.37% | +34.64% |
| 2021 | +2.47% | +1.51% | +0.96% |
| 2022 | -20.54% | -25.53% | +4.99% |
| 2023 | +33.11% | +19.96% | +13.16% |
| 2024 | -12.56% | -10.15% | -2.42% |
| 2025 | +42.35% | +79.65% | -37.30% |
The portfolio beat the KOSPI in 57.69% of the 104 quarters and in 17 of 26 calendar years (65.4%). The +8.74% excess CAGR comes from both frequency and the size of the biggest wins: 2000, 2005, 2020, 2004, and 2015 each cleared +33 percentage points of excess. The 2025 shortfall of -37.30pp is the largest single-year deficit in the record.
Backtest Methodology
| Parameter | Value |
|---|---|
| Signal | 12-month trailing equal-weighted sector return |
| Selection | Bottom 2 sectors each quarter |
| Universe | KSC, market cap > KRW 300B |
| Portfolio | Equal weight all qualifying stocks in selected sectors |
| Rebalancing | Quarterly (Jan, Apr, Jul, Oct) |
| Cash rule | Hold cash if fewer than 5 sectors qualify or fewer than 10 stocks pass filters |
| Transaction costs | Size-tiered model |
| Execution | Entry at the next available close after the signal date |
| Period | 2000-2025 (104 quarterly periods) |
| Benchmark | KOSPI (^KS11) |
Limitations
Currency risk. Returns are in KRW. The benchmark is also KOSPI in KRW, so the comparison is apples-to-apples for local investors. A foreign investor in KRW assets faces exchange rate exposure. KRW has been volatile over 26 years, with sharp depreciation episodes in 2008 and 2022. Realized returns in USD or EUR would differ from the local-currency numbers.
51 stocks per period. Averaging 51.2 stocks per quarter is manageable but still requires meaningful trading infrastructure. Four rebalances per year on roughly 50 Korean stocks involves transaction costs and Korea-specific market access considerations.
Sector concentration risk. Buying the bottom 2 sectors means concentrated bets. The strategy trailed the KOSPI three years running from 2010 to 2012, then again in 2016, 2024 and 2025. Extended periods of underperformance are a real test of conviction.
Costs are modelled, frictions aren't. A size-tiered transaction cost model is applied to every position, but bid-ask spread and market impact are not. On a 51-stock quarterly rebalance in Korean mid-caps, those are real.
Single-year gaps are wide. The portfolio beat the KOSPI in 17 of 26 years, but 2025 shows how large a single-year gap can be (-37.30pp against a KOSPI that rose 79.65%). In any given year, the outcome is uncertain.
Emerging market access. KSC-listed stocks require foreign investor registration and Korea-specific brokerage access. Short-selling restrictions, circuit breakers, and market hours differ from other markets. The backtest doesn't capture these operational frictions.
Takeaway
Korea's sector mean reversion produced 14.28% CAGR against the KOSPI's 5.55% over 26 years, a +8.74% annual excess, and it did so at a max drawdown of -35.09% against the index's -52.73%. That's the highest CAGR of the 13 markets tested and the widest drawdown gap over a local index, 17.6 points.
The 64.38% down capture is what makes the math work. Losing roughly two-thirds as much as the market in bad years while capturing 115.58% in good ones is a favorable trade. 2008 (-30.81% vs KOSPI -37.55%) and 2018 (-8.11% vs -18.94%) show it in practice. The 0.918 beta and +8.95% Jensen alpha say the gap isn't market exposure in disguise.
The balanced sector composition helps. Korea's market cycles through telecom, financials, and energy in its underperformance periods, so the signal isn't making the same concentrated bet quarter after quarter.
The honest counterweight is 2025: the portfolio gained 42.35% and still lost to the index by 37.30 percentage points. When leadership concentrates in whatever has already run, a strategy built on buying laggards will sit out the rally.
KRW-denominated results are the relevant measure for local investors. Foreign investors should account for currency exposure separately.
Part of a Series
- US analysis →: the baseline case, 10.60% CAGR against the S&P 500's 8.02%
- India (NSE) analysis →: 12.68% CAGR, but only +1.44% over the Sensex and a -69.67% drawdown
- Global comparison →: 13 exchanges, the full picture
References
Moskowitz, T. J., & Grinblatt, M. (1999). Do industries explain momentum? Journal of Finance, 54(4), 1249-1290.
Data: Ceta Research, FMP financial data warehouse. Universe: KSC. Quarterly rebalance, equal weight, 2000-2025. Returns in KRW. Past performance does not guarantee future results.
Past performance does not guarantee future results. This is educational content, not investment advice.

