
Sector Mean Reversion on Japanese Stocks (JPX): 6.90% CAGR, +2.97% vs Nikkei 225
Sector mean reversion on JPX large caps from 2000 to 2025: 6.90% CAGR vs 3.93% for the Nikkei 225, a +2.97% annual excess with Sharpe 0.333 and 66.82% down capture. Max drawdown of -50.39% beat the Nikkei at -61.06%. Utilities took 39% of quarters, a tilt created by Fukushima.

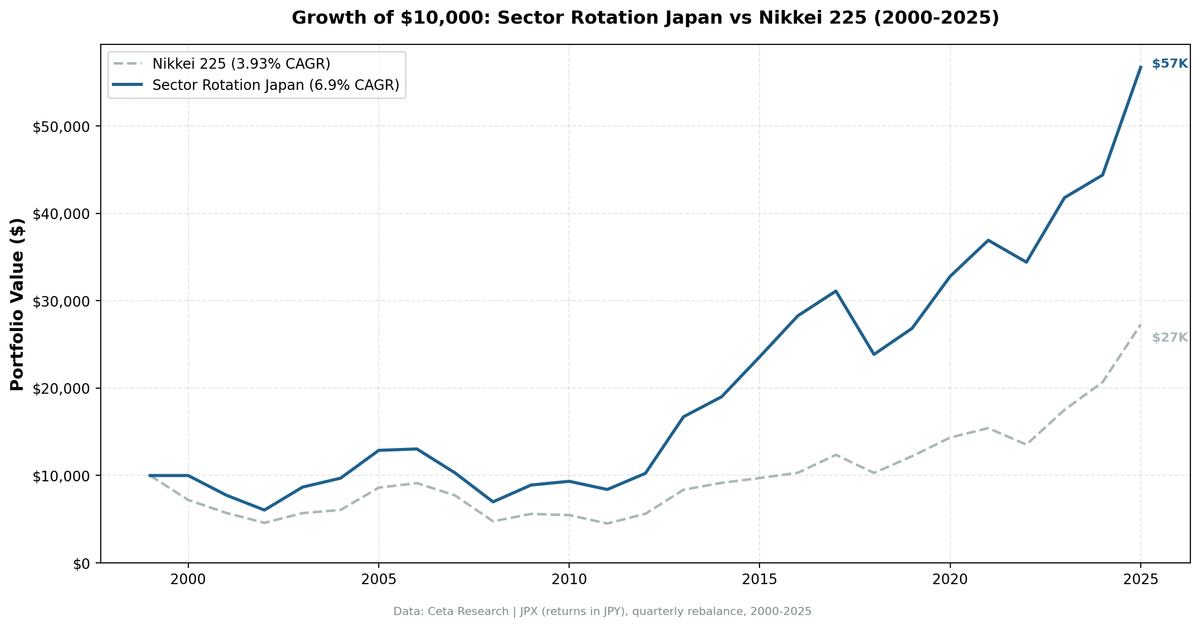
We ran a sector mean reversion strategy on Japan Exchange Group large-cap stocks from 2000 to 2025. The result was 6.90% annualized in JPY terms, +2.97% above the Nikkei 225 (^N225) at 3.93%, and a down capture of 66.82%. Measured against the local benchmark, the strategy works modestly in Japan.
Contents
- Method
- What is Sector Mean Reversion?
- The Screen
- What We Found
- 26 years. +2.97% annual excess vs Nikkei 225.
- Full Annual Returns
- Notable Years
- Backtest Methodology
- Limitations
- Takeaway
- Part of a Series
- References
- Run This Screen Yourself
The risk side is the stronger half of the story. The strategy's worst drawdown was -50.39% against the Nikkei's own -61.06%, so it beat the index on return and on the deepest loss. Its Sharpe of 0.333 is close to double the index's 0.182. Japan's near-zero risk-free rate (~0.1%) flatters that Sharpe, so read it as a local comparison rather than a global one. The down capture of 66.82% means the strategy absorbed about two-thirds of the Nikkei's downside.
Measured against SPY (8.02%), Japan's 6.90% CAGR still lags by -1.12%. That context matters for a non-Japanese investor. Japan is the borderline case in this study.
Data: FMP financial data warehouse, 2000-2025. Updated August 2026.
Method
| Parameter | Value |
|---|---|
| Data source | Ceta Research (FMP financial data warehouse) |
| Universe | JPX (Japan Exchange Group: Tokyo Stock Exchange + Osaka Stock Exchange), market cap > JPY 30B (~$200M USD) |
| Period | 2000-2025 (26 years, 104 quarterly rebalance periods) |
| Rebalancing | Quarterly (January, April, July, October), equal weight all qualifying stocks in selected sectors |
| Execution | Entry at the next available close after the signal date |
| Benchmark | Nikkei 225 (^N225) |
| Cash rule | Hold cash if fewer than 5 sectors qualify, or fewer than 10 stocks pass the filters |
What is Sector Mean Reversion?
At each quarterly rebalance, we rank all sectors by their equal-weighted 12-month trailing return. We buy every large-cap stock in the bottom 2 sectors. Next quarter, we re-rank and rotate. No discretion, no fundamental filters.
Moskowitz and Grinblatt (1999) established the part this strategy leans on: much of the momentum anomaly is explained by industry-level patterns, so sector membership is where the signal lives. What they documented at a 12-month horizon was continuation, not reversal, so this strategy runs against their result rather than following from it. The contrarian premise is a separate claim: sectors that underperform for a full year carry depressed valuations and low sentiment, and both tend to normalize.
On Japanese stocks, the sectors that kept showing up as the most beaten-down tell the country's economic story over 25 years:
| Sector | Quarters Selected (of 104) |
|---|---|
| Utilities | 41 (39%) |
| Financial Services | 29 (27%) |
| Energy | 26 (25%) |
| Technology | 21 (20%) |
| Real Estate | 21 (20%) |
| Communication Services | 17 (16%) |
| Consumer Defensive | 16 (15%) |
| Basic Materials | 13 (12%) |
| Healthcare | 13 (12%) |
| Consumer Cyclical | 2 (1%) |
| Industrials | 1 (0%) |
Utilities leads by a wide margin at 41 of 104 quarters. That's not random. Japan's utility sector spent much of the 2010s in structural decline: first from the Fukushima nuclear disaster in 2011, which forced reactor shutdowns, raised import costs and cut earnings, then from near-zero interest rates that compressed utility dividend attractiveness, and finally from the broader deflationary environment that kept capital costs low but demand growth lower. The strategy kept buying Japanese Utilities because they kept underperforming. Sometimes they recovered. Often they didn't snap back quickly. This Utilities concentration is a key reason the strategy's overall CAGR sits at 6.90% rather than higher.
Financial Services (29 quarters) and Energy (26 quarters) come next. Financials carry the long tail of the banking crisis and two decades of compressed net interest margins. Energy reflects Japan's position as one of the world's largest oil importers: when global crude prices rose (2004-2008, 2011-2014), Japanese energy costs surged and domestic energy stocks suffered. The strategy loaded into them during those periods.
The other end of the table is as informative. Industrials qualified once in 26 years and Consumer Cyclical twice. Japan's export champions almost never fell into the bottom two sectors, so this strategy systematically avoided them.
The Screen
The screen below ranks JPX large-cap sectors by their current 12-month equal-weighted return. The bottom rows are what the strategy would buy today.
WITH prices AS (
    SELECT e.symbol, e.adjClose, CAST(e.date AS DATE) AS trade_date
    FROM stock_eod e
    JOIN profile p ON e.symbol = p.symbol
    WHERE p.sector IS NOT NULL AND p.sector != ''
      AND p.marketCap > 30000000000
      AND p.exchange IN ('JPX')
      AND CAST(e.date AS DATE) >= CURRENT_DATE - INTERVAL '400' DAY
      AND e.adjClose IS NOT NULL AND e.adjClose > 0
),
recent AS (
    SELECT symbol, adjClose AS recent_price
    FROM prices
    QUALIFY ROW_NUMBER() OVER (PARTITION BY symbol ORDER BY trade_date DESC) = 1
),
year_ago AS (
    SELECT symbol, adjClose AS old_price
    FROM prices
    WHERE trade_date <= CURRENT_DATE - INTERVAL '252' DAY
    QUALIFY ROW_NUMBER() OVER (PARTITION BY symbol ORDER BY trade_date DESC) = 1
),
stock_returns AS (
    SELECT r.symbol, pr.sector, (r.recent_price / ya.old_price - 1) * 100 AS return_12m
    FROM recent r
    JOIN year_ago ya ON r.symbol = ya.symbol
    JOIN profile pr ON r.symbol = pr.symbol
    WHERE ya.old_price > 0 AND r.recent_price > 0
      AND (r.recent_price / ya.old_price - 1) BETWEEN -0.99 AND 5.0
)
SELECT pr.sector,
    ROUND(AVG(sr.return_12m), 2) AS avg_return_12m_pct,
    COUNT(DISTINCT sr.symbol) AS n_stocks,
    ROW_NUMBER() OVER (ORDER BY AVG(sr.return_12m) ASC) AS rank_worst
FROM stock_returns sr
JOIN profile pr ON sr.symbol = pr.symbol
GROUP BY pr.sector
HAVING COUNT(DISTINCT sr.symbol) >= 5
ORDER BY avg_return_12m_pct ASC
What We Found
The strategy was invested in 100 of 104 quarters. The four cash quarters all fall in 2000. For the rest of the run it was fully deployed, averaging 99.8 stocks per period.
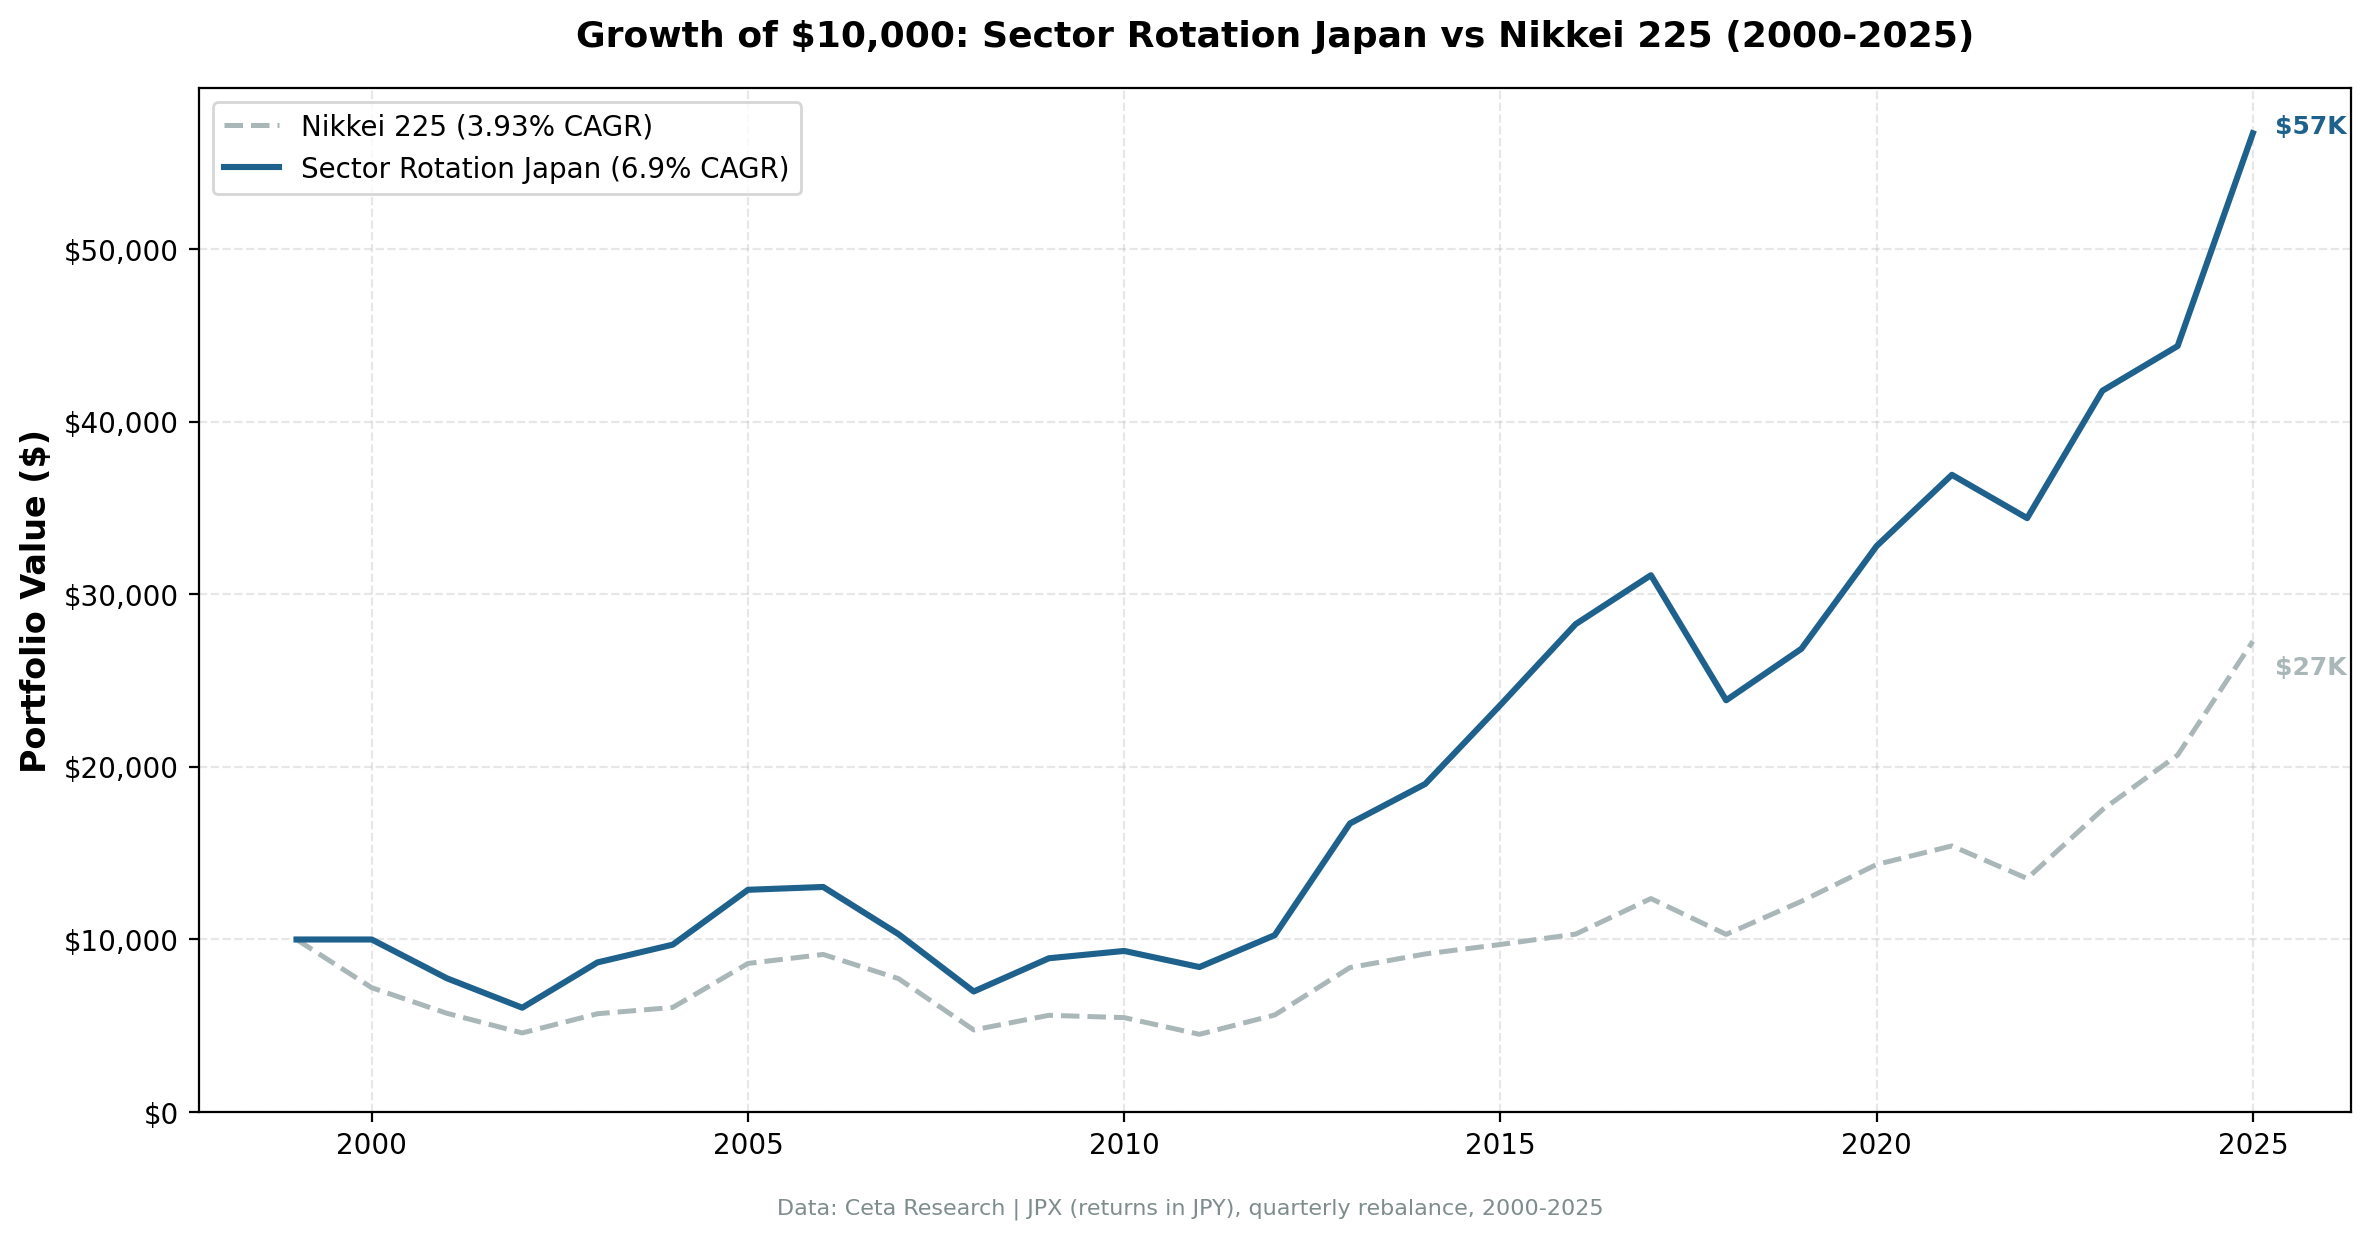
26 years. +2.97% annual excess vs Nikkei 225.
| Metric | Strategy | Nikkei 225 |
|---|---|---|
| CAGR | 6.90% | 3.93% |
| Excess CAGR vs Nikkei | +2.97% | |
| Total Return | 467.29% | 172.77% |
| Volatility | 20.45% | 21.12% |
| Sharpe Ratio | 0.333 | 0.182 |
| Sortino Ratio | 0.605 | 0.286 |
| Calmar Ratio | 0.137 | 0.064 |
| Max Drawdown | -50.39% | -61.06% |
| Win Rate (of 104 quarters) | 55.77% | |
| Up Capture | 90.05% | |
| Down Capture | 66.82% | |
| Beta | 0.783 | |
| Jensen Alpha | +3.80% | |
| Avg Stocks per Period | 99.8 | |
| Cash Periods | 4 of 104 |
JPY 10,000 compounded to JPY 56,729 in the strategy against JPY 27,277 in the Nikkei.
Note: vs SPY (8.02%), Japan's strategy at 6.90% CAGR lags by -1.12%. Beating the Nikkei is meaningful for a JPY-based investor. For USD-based investors, the SPY comparison is the relevant hurdle.
The down capture of 66.82% against the Nikkei means the strategy absorbs about two-thirds of the local index's downside. The up capture of 90.05% shows it gives up some upside to get that. Both sit below 100%, which is what a 0.783 beta looks like in practice: a lower-risk version of the index that still finished ahead of it. The Jensen alpha of +3.80% says the excess survives the beta adjustment.
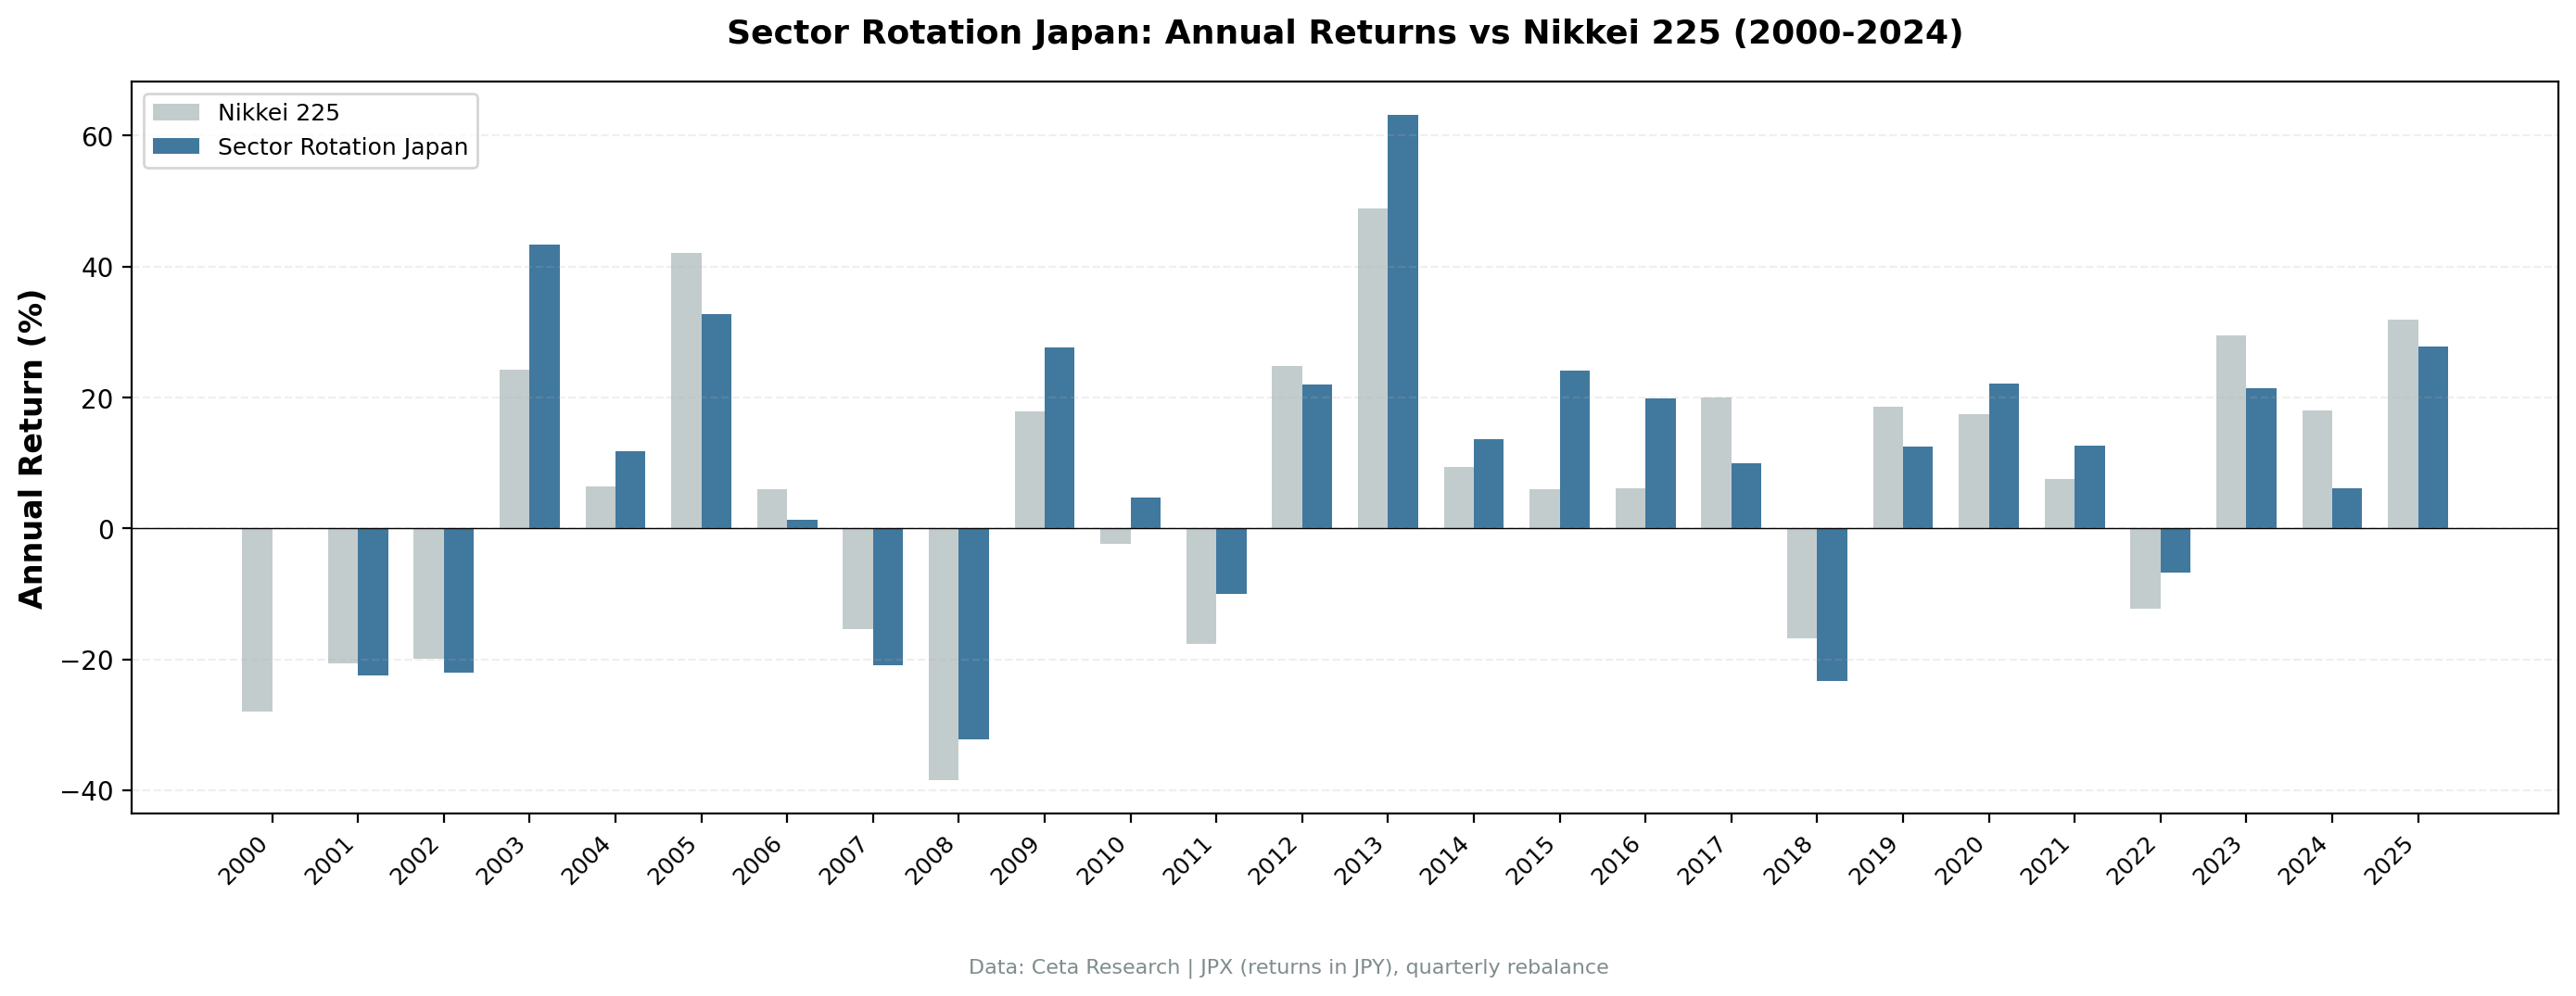
The strategy beat the Nikkei in 55.77% of the 104 quarters and in 14 of 26 calendar years.
Full Annual Returns
| Year | Strategy | Nikkei 225 | Excess |
|---|---|---|---|
| 2000 | 0.00% (cash) | -27.95% | +27.95% |
| 2001 | -22.51% | -20.59% | -1.92% |
| 2002 | -21.97% | -19.85% | -2.12% |
| 2003 | +43.42% | +24.24% | +19.18% |
| 2004 | +11.86% | +6.40% | +5.46% |
| 2005 | +32.78% | +42.06% | -9.27% |
| 2006 | +1.27% | +6.06% | -4.79% |
| 2007 | -20.94% | -15.34% | -5.60% |
| 2008 | -32.26% | -38.45% | +6.19% |
| 2009 | +27.59% | +17.82% | +9.77% |
| 2010 | +4.75% | -2.41% | +7.16% |
| 2011 | -10.00% | -17.68% | +7.67% |
| 2012 | +21.98% | +24.86% | -2.88% |
| 2013 | +63.17% | +48.85% | +14.33% |
| 2014 | +13.68% | +9.43% | +4.26% |
| 2015 | +24.09% | +5.99% | +18.11% |
| 2016 | +19.86% | +6.20% | +13.67% |
| 2017 | +10.02% | +19.97% | -9.95% |
| 2018 | -23.30% | -16.78% | -6.52% |
| 2019 | +12.51% | +18.62% | -6.11% |
| 2020 | +22.18% | +17.47% | +4.71% |
| 2021 | +12.58% | +7.50% | +5.09% |
| 2022 | -6.80% | -12.24% | +5.44% |
| 2023 | +21.45% | +29.44% | -7.99% |
| 2024 | +6.20% | +18.08% | -11.88% |
| 2025 | +27.78% | +31.87% | -4.09% |
Two clean winning streaks carry the record: 2008-2011 and 2013-2016, four straight years each. The losing end is the last three years, 2023 to 2025, when the Nikkei rose 29.44%, 18.08% and 31.87% and the strategy trailed every time. That's the recurring shape. When the index runs, a portfolio built out of the year's two worst sectors doesn't keep up. When the index falls, it usually loses less.
Notable Years
2000: the best relative year came from sitting out. The Nikkei fell -27.95% while the strategy held cash for all four quarters, so the +27.95pp excess is the widest in the backtest and none of it came from stock selection. Worth flagging, because the cash rule contributes more to the headline excess than any single invested year does.
2001-2002: asset bubble deflation continued. Japan's crisis didn't start in 2008. It started in the early 1990s and was still unwinding in the early 2000s. The Nikkei fell from its 1989 peak of nearly 39,000 to under 8,000 by 2003. The strategy lost -22.51% in 2001 and -21.97% in 2002, pulling heavily from beaten-down Financial Services and Real Estate. Both years trailed the index slightly, by -1.92pp and -2.12pp. There was no reversion to catch because the sectors weren't oversold, they were still deteriorating.
2003: Koizumi reform payoff, +43.42% against the Nikkei's +24.24%. Prime Minister Junichiro Koizumi's reforms (2001-2006) cleaned up the banking sector, privatized postal savings and drove a manufacturing and export recovery. Sectors that had been deeply undervalued snapped back hard, and the strategy's Financials and Real Estate holdings led the way. The +19.18pp excess is the widest of any invested year.
2005: the trap year. The strategy returned +32.78%, one of its best absolute results, and still lost to the Nikkei by -9.27pp because the index gained +42.06%. Absolute return and relative return can point in opposite directions, and 2005 is the cleanest example of it in this dataset.
2008: the strategy held up. 2008 returned -32.26% against the Nikkei's -38.45%, a +6.19pp cushion. Plenty of strategies that lag over full cycles do so because they collapse harder in crises. Japan's sector reversion didn't, and that carries into the -50.39% max drawdown against the index's -61.06%.
2011: Fukushima. The Great East Japan Earthquake in March 2011 and the subsequent nuclear disaster restructured Japan's energy sector for a decade. All reactors were eventually shut down. Japan imported additional natural gas and oil to compensate, and utility earnings collapsed. The strategy lost -10.00% that year against the Nikkei's -17.68%, so it beat the index by +7.67pp even while owning the sector at the center of the shock. The lasting effect is structural: Fukushima is why Utilities show up in 41 of 104 quarters. The signal kept flagging Utilities as the worst sector because the sector genuinely was impaired, and the strategy kept rotating in, often too early.
2013: the best year in the backtest, +63.17%. Prime Minister Shinzo Abe's "three arrows" program (fiscal stimulus, monetary easing, structural reform) drove a reflation trade that lifted everything. The Nikkei gained +48.85%. Beating a +48.85% index by +14.33pp with the two worst sectors of the prior year is the strongest single result Japan produced.
2015-2016: two quiet years, two wide margins. The Nikkei managed only +5.99% and +6.20%. The strategy returned +24.09% and +19.86%, for +18.11pp and +13.67pp of excess. The 2015 margin is second only to 2003 among invested years. Beaten-down domestic sectors benefited from yen depreciation and renewed domestic demand while the index stalled.
2022: down capture in action. The Nikkei fell -12.24% as global rates rose. The strategy fell -6.80%, roughly half as much. Japan's near-zero interest rate environment meant its market didn't reprice the way US equities did, and the Utilities and Energy positions the strategy held didn't carry growth-stock rate sensitivity.
2023-2025: three years of trailing a strong index. The Nikkei returned +29.44%, +18.08% and +31.87%. The strategy returned +21.45%, +6.20% and +27.78%, for -7.99pp, -11.88pp and -4.09pp. The 2024 gap is the worst relative year in the backtest. All three were positive in absolute terms, so this is a keeping-up problem rather than a losing-money problem. It ties 2005-2007 and 2017-2019 as the longest losing streak against the benchmark in the record, and it's the one that's still running.
Backtest Methodology
| Parameter | Choice |
|---|---|
| Universe | JPX (TSE + OSE), market cap > JPY 30B (~$200M USD) |
| Signal | Bottom 2 sectors by equal-weighted 12-month trailing return |
| Portfolio | All qualifying stocks in selected sectors, equal weight |
| Rebalancing | Quarterly (January, April, July, October) |
| Execution | Entry at the next available close after the signal date |
| Cash rule | Hold cash if fewer than 5 sectors qualify, or fewer than 10 stocks pass the filters |
| Transaction costs | Size-tiered model. Bid-ask spread and market impact are not modelled |
| Benchmark | Nikkei 225 (^N225) |
| Period | 2000-2025 (26 years, 104 quarters) |
| Risk-free rate | ~0.1% (Bank of Japan near-zero rates) |
| Academic basis | Moskowitz & Grinblatt (1999) |
| Data | Ceta Research (FMP financial data warehouse) |
Limitations
Currency note. Returns are in JPY. The Nikkei 225 benchmark is also in JPY, so the +2.97% excess comparison is clean on a local basis. For a USD-based investor, the relevant comparison is SPY (8.02% CAGR), where Japan lags by -1.12%. Over 26 years, USD/JPY movements have been large and volatile. The yen strengthened sharply after the 2008 crisis, weakened under Abenomics from 2013, and weakened further after 2021. A USD-based investor's realized return would differ substantially from the JPY numbers shown here.
Utilities concentration. Utilities appeared in 41 of 104 quarters. The strategy spent roughly 40% of its time heavily loaded into Japanese utility stocks, a sector that was structurally impaired after Fukushima. That concentration creates long stretches where the portfolio effectively bets on a nuclear recovery timeline. When that bet doesn't pay off quickly, returns suffer.
Fukushima as a structural break. The 2011 disaster changed Japan's energy mix in ways that persisted for the entire back half of the backtest. A 26-year test spans two meaningfully different utility sector regimes, pre and post-Fukushima. The post-Fukushima environment is the one most relevant to forward expectations, but the backtest blends both.
Deflationary environment. Japan's decades of low growth, low inflation and near-zero interest rates create a distinct macro backdrop. Mean reversion in Japanese sectors operates more slowly than in economies with stronger nominal growth. When a sector is beaten down in a deflationary context, the recovery trigger is less clear. That's part of why the strategy spent 39% of quarters in Utilities without capturing as much upside.
Cash years flatter the excess. The single widest excess year, 2000 at +27.95pp, came from holding cash through a -27.95% Nikkei. Strip it out and the remaining 25 years are a much closer contest: 13 wins, 12 losses.
Sharpe methodology note. The Sharpe of 0.333 uses Japan's ~0.1% risk-free rate. The same strategy measured against a US 2% risk-free rate would produce a Sharpe closer to 0.24. The Sharpe numbers across this study aren't directly comparable because each market uses its local risk-free rate. Japan's near-zero floor makes its Sharpe look better relative to the raw return than a global comparison would suggest.
Takeaway
Japan's sector mean reversion produced +2.97% annual excess over the Nikkei 225 across 26 years, with a total return of 467.29%. It beat the index on return, on Sharpe (0.333 vs 0.182) and on worst drawdown (-50.39% vs -61.06%). Measured against the local benchmark, the strategy works. Measured against SPY (8.02%), Japan's 6.90% CAGR still lags by -1.12%. That gap matters for the audience.
The Sharpe of 0.333 is supported by Japan's near-zero risk-free rate. The Utilities-heavy selection is the story. Post-Fukushima Japan had a persistently beaten-down utility sector, and the mean reversion signal kept identifying it. Sometimes the recovery came (2013, 2015, 2016). Often the sector stayed cheap and depressed.
For a JPY-based investor benchmarking against the Nikkei, the 66.82% down capture and the shallower drawdown are the real product. For a USD-based investor, the SPY comparison is more relevant, and Japan lags there. The currency overlay also dominates: JPY moves against USD can dwarf the +2.97% local excess in any given year.
Part of a Series
We tested this strategy across 13 exchanges. Other analyses in the series:
- US (NYSE + NASDAQ + AMEX) →
- India (NSE) →
- Korea (KSC) →
- Taiwan (TAI + TWO) →
- Sweden (STO) →
- Global comparison →: all 13 exchanges ranked by Sharpe, CAGR and down capture
References
Moskowitz, T. J., & Grinblatt, M. (1999). Do industries explain momentum? Journal of Finance, 54(4), 1249-1290.
Run This Screen Yourself
Via Python:
import requests, time

API_KEY = "your_api_key"  # get one at cetaresearch.com
BASE = "https://tradingstudio.finance/api/v1"

query = """
WITH prices AS (
    SELECT e.symbol, e.adjClose, CAST(e.date AS DATE) AS trade_date
    FROM stock_eod e
    JOIN profile p ON e.symbol = p.symbol
    WHERE p.sector IS NOT NULL AND p.sector != ''
      AND p.marketCap > 30000000000
      AND p.exchange IN ('JPX')
      AND CAST(e.date AS DATE) >= CURRENT_DATE - INTERVAL '400' DAY
      AND e.adjClose IS NOT NULL AND e.adjClose > 0
),
recent AS (
    SELECT symbol, adjClose AS recent_price
    FROM prices
    QUALIFY ROW_NUMBER() OVER (PARTITION BY symbol ORDER BY trade_date DESC) = 1
),
year_ago AS (
    SELECT symbol, adjClose AS old_price
    FROM prices
    WHERE trade_date <= CURRENT_DATE - INTERVAL '252' DAY
    QUALIFY ROW_NUMBER() OVER (PARTITION BY symbol ORDER BY trade_date DESC) = 1
),
stock_returns AS (
    SELECT r.symbol, pr.sector,
        (r.recent_price / ya.old_price - 1) * 100 AS return_12m
    FROM recent r
    JOIN year_ago ya ON r.symbol = ya.symbol
    JOIN profile pr ON r.symbol = pr.symbol
    WHERE ya.old_price > 0 AND r.recent_price > 0
      AND (r.recent_price / ya.old_price - 1) BETWEEN -0.99 AND 5.0
)
SELECT pr.sector,
    ROUND(AVG(sr.return_12m), 2) AS avg_return_12m_pct,
    COUNT(DISTINCT sr.symbol) AS n_stocks,
    ROW_NUMBER() OVER (ORDER BY AVG(sr.return_12m) ASC) AS rank_worst
FROM stock_returns sr
JOIN profile pr ON sr.symbol = pr.symbol
GROUP BY pr.sector
HAVING COUNT(DISTINCT sr.symbol) >= 5
ORDER BY avg_return_12m_pct ASC
"""

resp = requests.post(f"{BASE}/data-explorer/execute", headers={
    "X-API-Key": API_KEY, "Content-Type": "application/json"
}, json={
    "query": query,
    "options": {"format": "json", "limit": 100},
    "resources": {"memoryMb": 16384, "threads": 6}
})
task_id = resp.json()["taskId"]

while True:
    result = requests.get(f"{BASE}/tasks/data-query/{task_id}",
                          headers={"X-API-Key": API_KEY}).json()
    if result["status"] in ("completed", "failed"):
        break
    time.sleep(2)

print("JPX sector rankings (worst to best, 12-month return):")
for r in result["result"]["rows"]:
    flag = " <-- BUY" if r["rank_worst"] <= 2 else ""
    print(f"#{r['rank_worst']} {r['sector']:30s} {r['avg_return_12m_pct']:+.1f}%  ({r['n_stocks']} stocks){flag}")
Get your API key at cetaresearch.com. The full backtest code (Python + DuckDB) is on GitHub.
Data: Ceta Research, FMP financial data warehouse. Universe: JPX (TSE + OSE), market cap > JPY 30B (~$200M USD). Quarterly rebalance, equal weight, 2000-2025. Returns in JPY. Benchmark: Nikkei 225 (^N225, JPY). Note: vs SPY (8.02% CAGR), this strategy at 6.90% lags by -1.12%. Full methodology: METHODOLOGY.md. Past performance does not guarantee future results.
Past performance does not guarantee future results. This is educational content, not investment advice.

