
Sector Mean Reversion in India: 12.68% CAGR, and Almost No Edge Over the Sensex
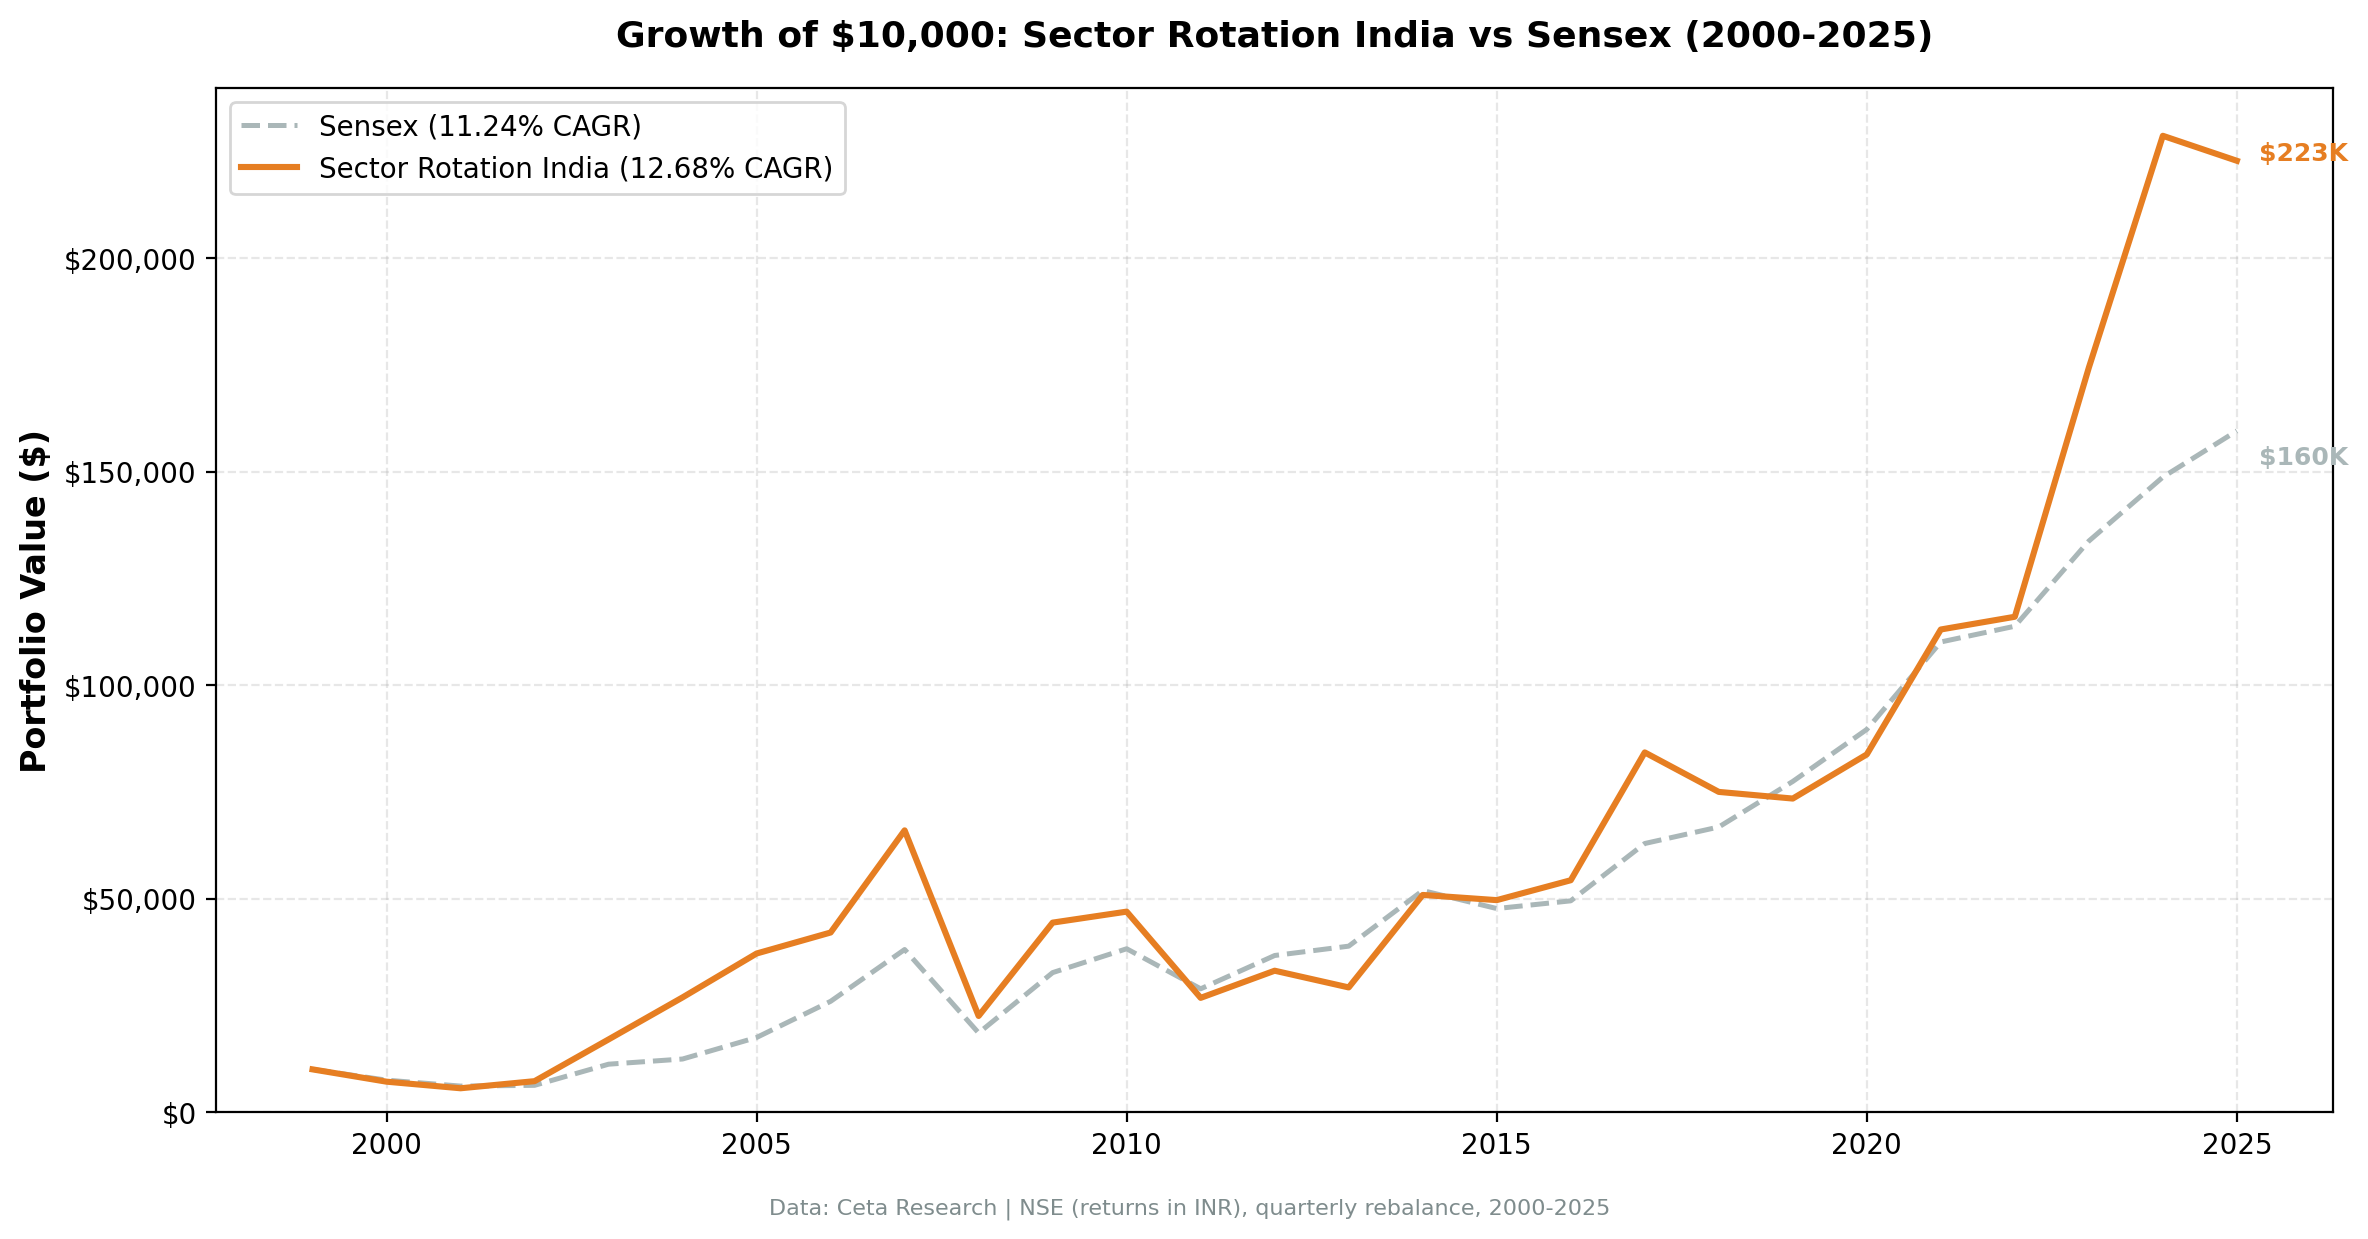
Buying the two most out-of-favor sectors on NSE each quarter returned 12.68% annually over 26 years against the Sensex's 11.24%. On a beta of 1.348 that +1.44% gap becomes a -0.21% Jensen alpha, and it costs a -69.67% max drawdown to earn.

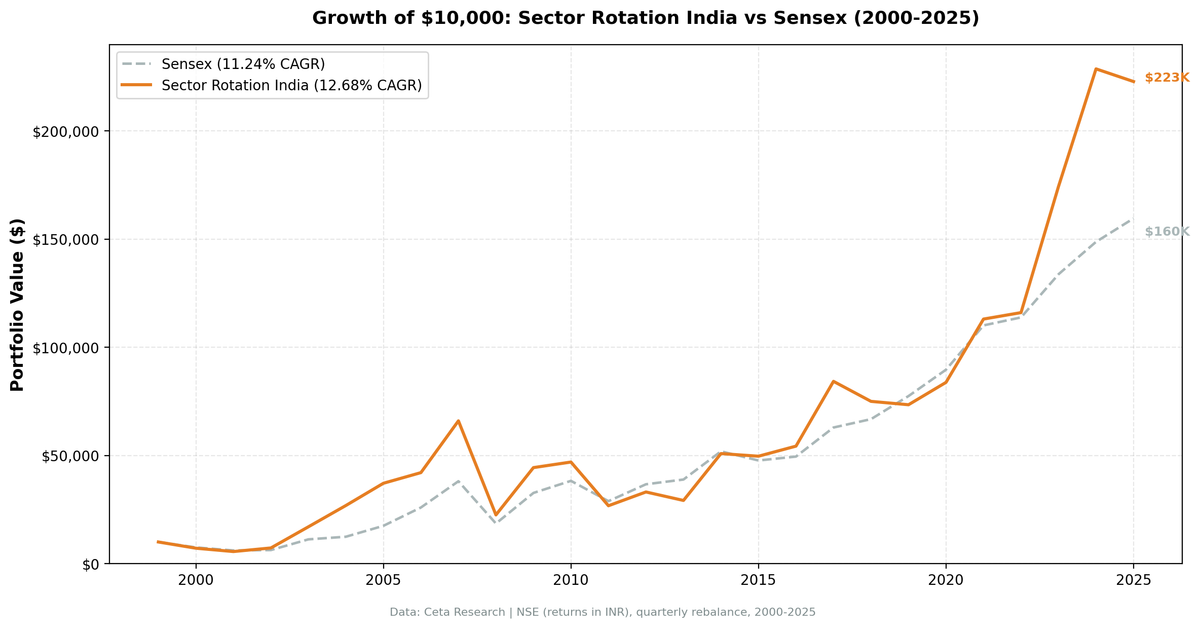
India's sector mean reversion strategy returned 12.68% annually on NSE from 2000 to 2025, turning INR 10,000 into INR 222,873 (2,129% total return). The Sensex grew at 11.24% annually over the same period, to INR 159,555. That's a +1.44% excess CAGR, and it doesn't survive a risk adjustment: the portfolio runs a beta of 1.348 against the Sensex, and Jensen's alpha is -0.21%. You took materially more risk to earn a gap that a bit of leverage on the index would have produced for free.
Contents
- Method
- What We Found
- Most Selected Sectors (104 quarters)
- Notable Years
- Full Annual Returns
- Backtest Methodology
- Limitations
- Takeaway
- Part of a Series
- References
The rest of the profile is worse than that summary suggests: a -69.67% max drawdown, 37.90% annualized volatility, and a 127.88% down capture.
Data: FMP financial data warehouse, 2000-2025. Updated August 2026.
Method
Data source: Ceta Research (FMP financial data warehouse) Universe: NSE (India), market cap > INR 20B (~$240M USD) Period: 2000-2025 (26 years, 104 quarterly periods) Rebalancing: Quarterly (January, April, July, October) Signal: Buy all stocks in the bottom 2 sectors by 12-month trailing equal-weighted return Portfolio construction: Equal weight all qualifying stocks in selected sectors Execution: Entry at the next available close after the signal date Benchmark: Sensex (^BSESN, INR) Cash rule: Hold cash if fewer than 5 sectors qualify, or fewer than 10 stocks pass the filters Transaction costs: Size-tiered model, applied to every position Currency note: Returns are in INR. Benchmark is Sensex (also INR). This is a like-for-like comparison.
The signal uses prices only. There's no fundamental data in this strategy, so there's no reporting lag to model. Full methodology: backtests/METHODOLOGY.md
What We Found
India has one of the highest raw CAGRs of any exchange tested, and that's the number people quote. The Sensex itself grew at 11.24% annually over 26 years, so the strategy's edge over the thing you could have bought instead is +1.44%, not the +4.66% you'd get by comparing Indian returns to the S&P 500.
| Metric | Portfolio | Sensex |
|---|---|---|
| CAGR | 12.68% | 11.24% |
| Excess CAGR | +1.44% | |
| Total Return | 2128.73% | 1495.55% |
| Max Drawdown | -69.67% | -51.34% |
| Annualized Volatility | 37.90% | 23.72% |
| Sharpe Ratio | 0.163 | 0.200 |
| Sortino Ratio | 0.304 | 0.328 |
| Beta vs Sensex | 1.348 | |
| Alpha (Jensen) | -0.21% | |
| Win Rate (quarters vs Sensex) | 44.23% | |
| Up Capture | 133.17% | |
| Down Capture | 127.88% | |
| Avg Stocks per Period | 68.0 | |
| Cash Periods | 0 of 104 |
Read the top three rows together. The strategy earns 1.44 points more than the Sensex, at 37.90% volatility against the index's 23.72%, with a max drawdown of -69.67% against the index's -51.34%. Its Sharpe ratio is lower than the benchmark's. Its Sortino is lower. Its Jensen alpha is negative.
The up/down capture explains the mechanism: 133.17% of Sensex upside and 127.88% of Sensex downside. That's close to a symmetric leveraging of the index. A 1.35x position in a Sensex fund would have delivered roughly the same shape without the quarterly rebalancing of 68 stocks.
The win rate of 44.23% means the strategy beat the Sensex in fewer than half of all quarters, 46 of 104. On calendar years it's 12 of 26. The excess comes from a handful of very large win years, not from winning often.
Most Selected Sectors (104 quarters)
| Sector | Quarters Selected |
|---|---|
| Utilities | 35 |
| Real Estate | 30 |
| Communication Services | 29 |
| Healthcare | 22 |
| Energy | 19 |
| Consumer Defensive | 19 |
| Technology | 19 |
| Consumer Cyclical | 14 |
| Financial Services | 13 |
| Industrials | 7 |
| Basic Materials | 1 |
Utilities dominated, appearing in 35 of 104 quarters. India's utility sector goes through extended regulatory and tariff cycles, making it prone to multi-year underperformance followed by recovery. Real Estate reflects India's property cycles. Communication Services appeared often as Indian telco went through multiple rounds of price wars, spectrum battles, and consolidation. Basic Materials appeared once in 26 years, the rarest selection of any market in the study.
Notable Years
2003: +135.13%. Post-dot-com recovery coincided with India's early infrastructure boom. The Sensex returned 79.09% that year. The strategy beat it by +56.03%, the widest gap in the record.
2004-2005: Large split. The strategy gained 57.88% in 2004 while the Sensex gained 10.83%. Then in 2005 the Sensex surged 40.59% while the strategy returned 38.25%. The contrarian tilt means you lag in momentum-driven years and lead in recovery years.
2006: Underperformance. The Sensex returned 48.48% in 2006, the strategy returned 13.25%. This is the cost of being in beaten-down sectors when the broader market is surging. The -35.23% gap is the worst in the record.
2008: -65.89%. The strategy dropped 65.89%, the Sensex dropped 51.34%. The strategy amplified the crash. Buying beaten-down cyclical sectors right into the global financial crisis meant holding the hardest-hit names when everything fell.
2009: +97.15%. The recovery was proportionally stronger: 97.15% vs Sensex 76.32%. The sectors destroyed in 2008 recovered violently. If you held through the crash, the rebound more than compensated.
2011: -43.02%. Communication Services and Real Estate were selected. Both kept falling. The Sensex fell 24.53%. The strategy amplified the decline. This is the core risk in mean reversion: sometimes sectors keep going down.
2018-2019: Two straight misses. -10.98% then -2.08%, against a Sensex that gained 6.15% and 15.98%. A -35 point cumulative gap over two years, with no crash to blame it on.
2023: +50.29%. The best recent year, against a Sensex that returned 17.53%.
Full Annual Returns
| Year | Portfolio | Sensex | Excess |
|---|---|---|---|
| 2000 | -28.82% | -25.23% | -3.59% |
| 2001 | -21.71% | -18.65% | -3.05% |
| 2002 | +29.87% | +2.93% | +26.94% |
| 2003 | +135.13% | +79.09% | +56.03% |
| 2004 | +57.88% | +10.83% | +47.06% |
| 2005 | +38.25% | +40.59% | -2.34% |
| 2006 | +13.25% | +48.48% | -35.23% |
| 2007 | +56.89% | +46.79% | +10.11% |
| 2008 | -65.89% | -51.34% | -14.55% |
| 2009 | +97.15% | +76.32% | +20.82% |
| 2010 | +5.80% | +17.10% | -11.30% |
| 2011 | -43.02% | -24.53% | -18.49% |
| 2012 | +23.77% | +27.04% | -3.27% |
| 2013 | -11.83% | +5.96% | -17.79% |
| 2014 | +74.21% | +33.51% | +40.70% |
| 2015 | -2.39% | -8.12% | +5.73% |
| 2016 | +9.39% | +3.79% | +5.60% |
| 2017 | +55.14% | +27.14% | +28.00% |
| 2018 | -10.98% | +6.15% | -17.13% |
| 2019 | -2.08% | +15.98% | -18.06% |
| 2020 | +14.08% | +15.74% | -1.66% |
| 2021 | +34.93% | +22.85% | +12.08% |
| 2022 | +2.64% | +3.35% | -0.71% |
| 2023 | +50.29% | +17.53% | +32.75% |
| 2024 | +31.15% | +11.20% | +19.95% |
| 2025 | -2.56% | +7.28% | -9.84% |
The pattern: wins are concentrated in a few enormous years (2002, 2003, 2004, 2014, 2017, 2023, 2024) while the losses arrive in clusters (2005-2006, 2010-2011, 2013, 2018-2019). Strip out 2003 and 2004 and the 26-year record no longer beats the index at all. That's the honest test of a +1.44% edge: it rests on two years near the start of the sample.
Backtest Methodology
| Parameter | Value |
|---|---|
| Signal | 12-month trailing equal-weighted sector return |
| Selection | Bottom 2 sectors each quarter |
| Universe | NSE, market cap > INR 20B |
| Portfolio | Equal weight all qualifying stocks in selected sectors |
| Rebalancing | Quarterly (Jan, Apr, Jul, Oct) |
| Cash rule | Hold cash if < 5 sectors qualify or < 10 stocks pass filters |
| Execution | Next available close after the signal date |
| Transaction costs | Size-tiered model |
| Period | 2000-2025 (104 quarterly periods) |
| Benchmark | Sensex (^BSESN, INR) |
Limitations
The edge doesn't survive a risk adjustment. +1.44% excess CAGR sounds like alpha. On a beta of 1.348, Jensen's alpha is -0.21%. The strategy took roughly 35% more market risk than the Sensex and gave back everything that risk earned. This is the single most important number in the post.
Down capture above 100%. The strategy captures 127.88% of Sensex downside against 133.17% of its upside. When the Indian market falls, this portfolio falls harder. That's what you expect from a strategy that systematically buys the most out-of-favor sectors, and it's most of why the drawdown is what it is.
Maximum drawdown of -69.67%. A 69.67% drawdown requires a 230% return to break even. The Sensex's own worst drawdown over the same period was -51.34%. Living through a 66% loss in a single year (2008) while holding requires a time horizon most investors don't have.
The result rests on two years. 2003 (+56.03% excess) and 2004 (+47.06% excess) account for more than the entire 26-year edge. Both came in the first five years of the sample, when NSE data is thinnest. Remove them and the strategy trails the index.
+1.44% is inside the noise band. Re-running this backtest on a later data vintage moves published excess figures by up to 2.6 percentage points, because FMP revises coverage and corrects history over time. An edge of +1.44% is smaller than the measurement error. Treat the honest reading as "no reliable edge over the Sensex", not "a small edge".
Concentrated sector bets. Utilities and Real Estate appeared in 35 and 30 quarters. This isn't broad sector diversification. In years when both underperform simultaneously (2011, 2013, 2019), the portfolio has no hedge.
Data quality. NSE data before 2005 is thinner than post-2010, which is exactly where the two years carrying the result sit. Early returns should be read with extra caution.
Low win rate. The strategy beat the Sensex in 46 of 104 quarters (44.23%) and 12 of 26 calendar years. If you enter at the wrong time or exit during a losing stretch, you may underperform the index badly.
Takeaway
India doesn't reward sector mean reversion, once you measure it against the right thing.
The 12.68% CAGR is strong in absolute terms and it's the number that gets quoted. But the Sensex compounded at 11.24% over the same 26 years with lower volatility (23.72% vs 37.90%), a shallower worst drawdown (-51.34% vs -69.67%), and a higher Sharpe (0.200 vs 0.163). The strategy's +1.44% gap is smaller than the year-to-year noise in the underlying data, and once adjusted for a beta of 1.348 it turns slightly negative.
The strategy does work in India's violent recovery years: 2002-2004 after the dot-com unwind, 2009 after the crash, 2023-2024. Those years are real and they're large. They're also clustered, and the stretches between them (2005-2006, 2010-2011, 2018-2019) are long enough to break most investors' conviction.
For a US investor comparing to SPY, India at 12.68% beats the S&P 500's 8.02% by roughly 4.7 points a year. That comparison is currency-mixed (INR returns against a USD benchmark) and it flatters the strategy rather than the country. The value added over what an Indian investor could have bought instead is, on this evidence, close to zero.
Korea and Taiwan are where this signal actually works. See the comparison post.
Part of a Series
- US analysis: 10.60% CAGR, +2.58% vs S&P 500
- Korea analysis: the best result in the study, 14.28% CAGR, +8.74% vs KOSPI, 0.434 Sharpe
- Global comparison: 13 exchanges, the full picture
References
Moskowitz, T. J., & Grinblatt, M. (1999). Do industries explain momentum? Journal of Finance, 54(4), 1249-1290.
Data: Ceta Research, FMP financial data warehouse. Universe: NSE. Quarterly rebalance, equal weight, 2000-2025. Returns in INR. Benchmark: Sensex (^BSESN). Past performance does not guarantee future results.
Past performance does not guarantee future results. This is educational content, not investment advice.

