
Revenue Surprise Momentum Across 9 Exchanges: What Local Benchmarks Reveal
We tested revenue surprise momentum on 9 exchanges using local benchmarks. US: +3.54% excess vs the S&P 500. UK: +2.38% vs the FTSE 100, on a 10-stock portfolio. India looks good in absolute terms but trails the Sensex by 2.41% a year.

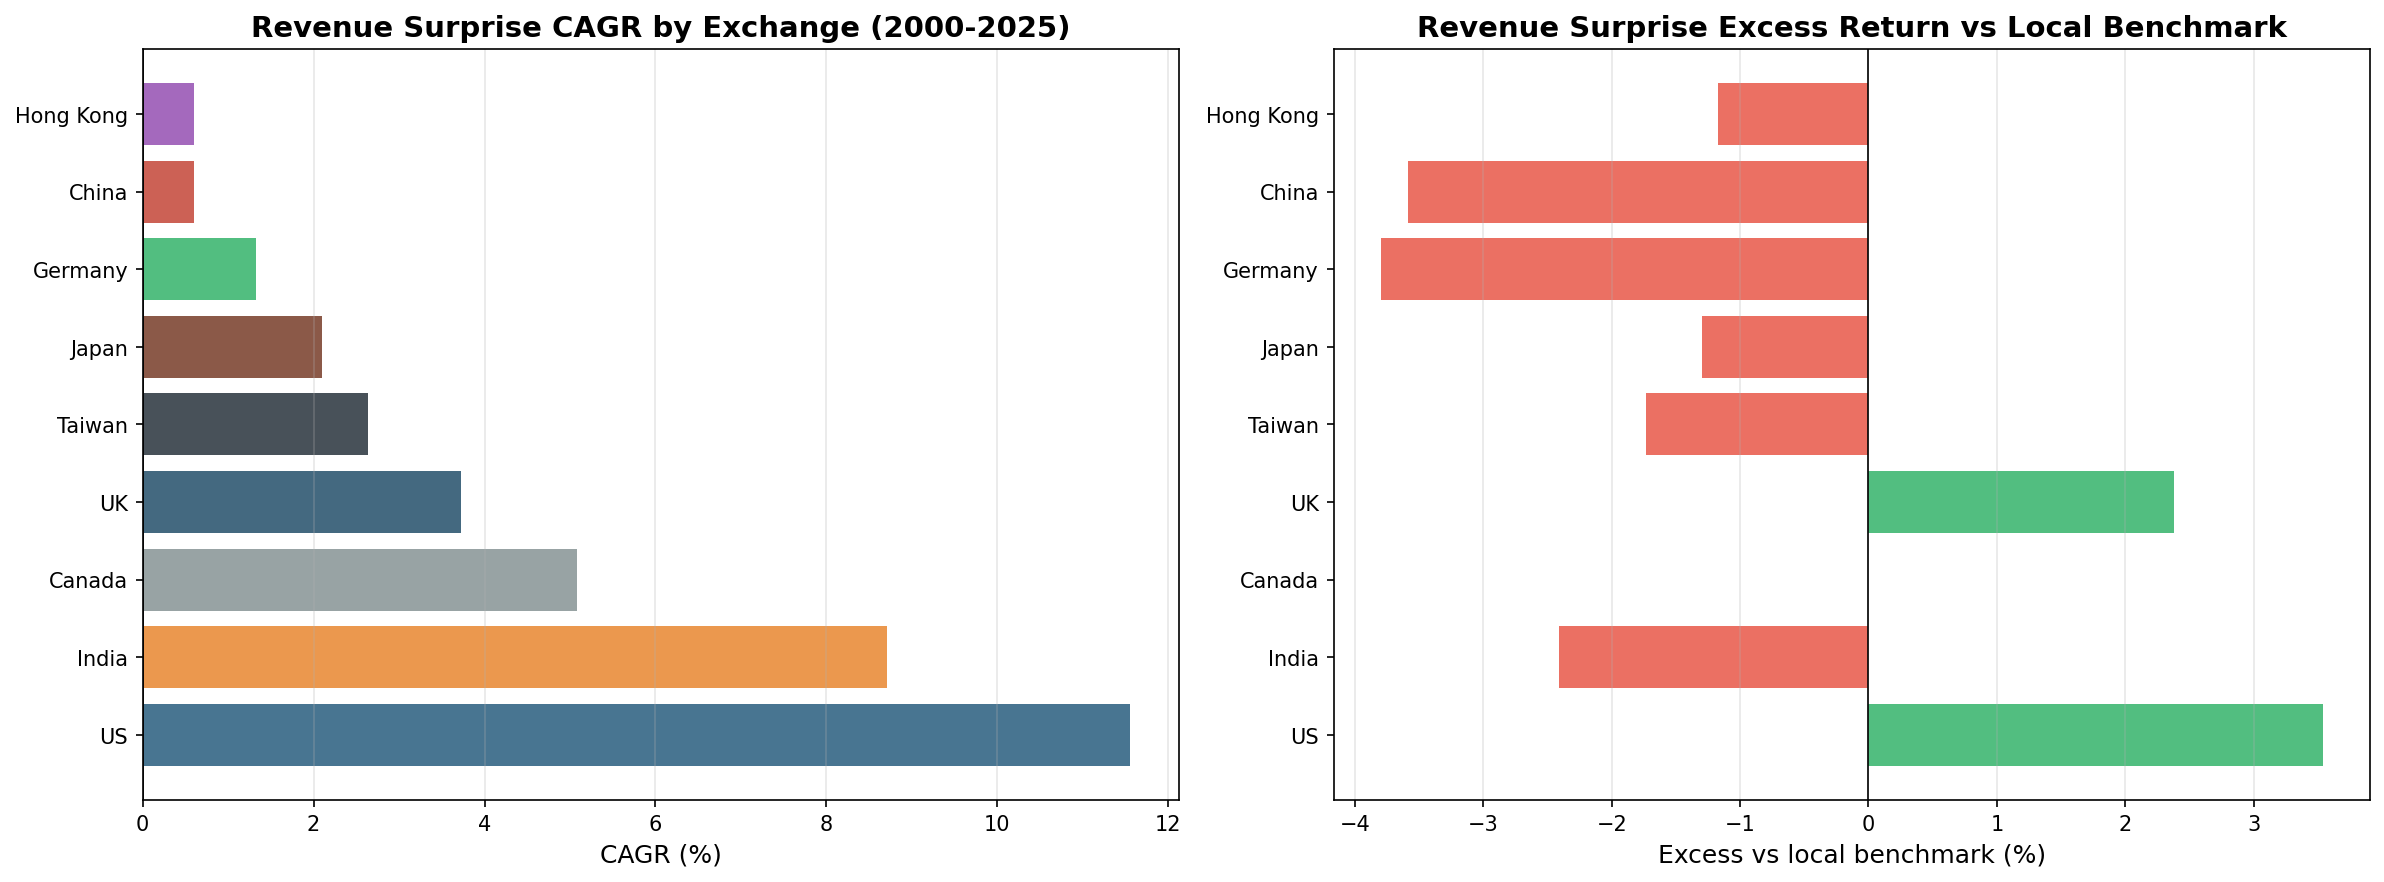
We ran revenue surprise momentum (buying stocks that beat quarterly analyst revenue estimates) on 9 stock exchanges worldwide from 2000 to 2025. Using local currency benchmarks for each market, two exchanges show positive excess: the US (+3.54% vs S&P 500) and the UK (+2.38% vs FTSE 100). Canada lands exactly on its benchmark. Every other exchange underperforms its local index, and several do so with heavy cash periods because the underlying data doesn't exist historically.
Contents
- Method
- What We Found
- US and UK show positive excess. Everyone else doesn't.
- Max Drawdowns
- The Data Availability Problem
- US: The Cleanest Result
- UK: Positive Excess, With Caveats
- India: High Absolute Return, Negative vs Sensex
- Germany: Mostly a Listing Artifact
- What This Means
- Individual Exchange Posts
- References
The data infrastructure problem is real, but it's not the only story.
Data: FMP financial data warehouse, 2000–2025. Rerun August 2026 on refreshed data. Numbers differ from the March 2026 version of this post, most of all for the UK, where analyst coverage has since been backfilled.
Method
Data source: Ceta Research (FMP financial data warehouse) Period: 2000–2025 (25.8 years, 103 quarterly periods) Rebalancing: Quarterly (January, April, July, October), equal weight Benchmark: Local currency index for each exchange (Sensex for India, FTSE 100 for UK, DAX for Germany, etc.) Transaction costs: Size-tiered model (0.1–0.5% one-way based on market cap) Cash rule: Hold cash if fewer than 10 stocks qualify at a rebalance date Execution: MOC (signal from prior quarter's filings, executed at next trading day's close)
Revenue surprise signal (all filters must pass):
| Filter | Threshold |
|---|---|
| Revenue surprise | 0% < surprise < 50% (beat estimates, exclude outliers) |
| ROE | > 8% |
| Debt/Equity | < 2.5 |
| Market cap | Exchange-specific threshold (local currency) |
The strategy requires two data sources joined together: quarterly revenue actuals from income_statement (periods Q1/Q2/Q3/Q4) and quarterly analyst consensus estimates from analyst_estimates (period='quarter'). This join is where most international markets fall apart.
These benchmarks leave dividends out. Portfolio returns here use dividend-adjusted prices, so they include dividends. Most of the indices we measure against do not. The FTSE 100, Hang Seng, Nikkei 225, SSE Composite, Sensex, TAIEX and TSX Composite are price indices, so excess return against them is overstated by roughly the local dividend yield, which has run between about 1.3% and 3.5% in these markets. Those comparisons are like for like: the S&P 500 figure runs through SPY, which is dividend-adjusted; the DAX is a performance index. Treat any edge thinner than the local yield as a tie rather than a win.
What We Found
US and UK show positive excess. Everyone else doesn't.
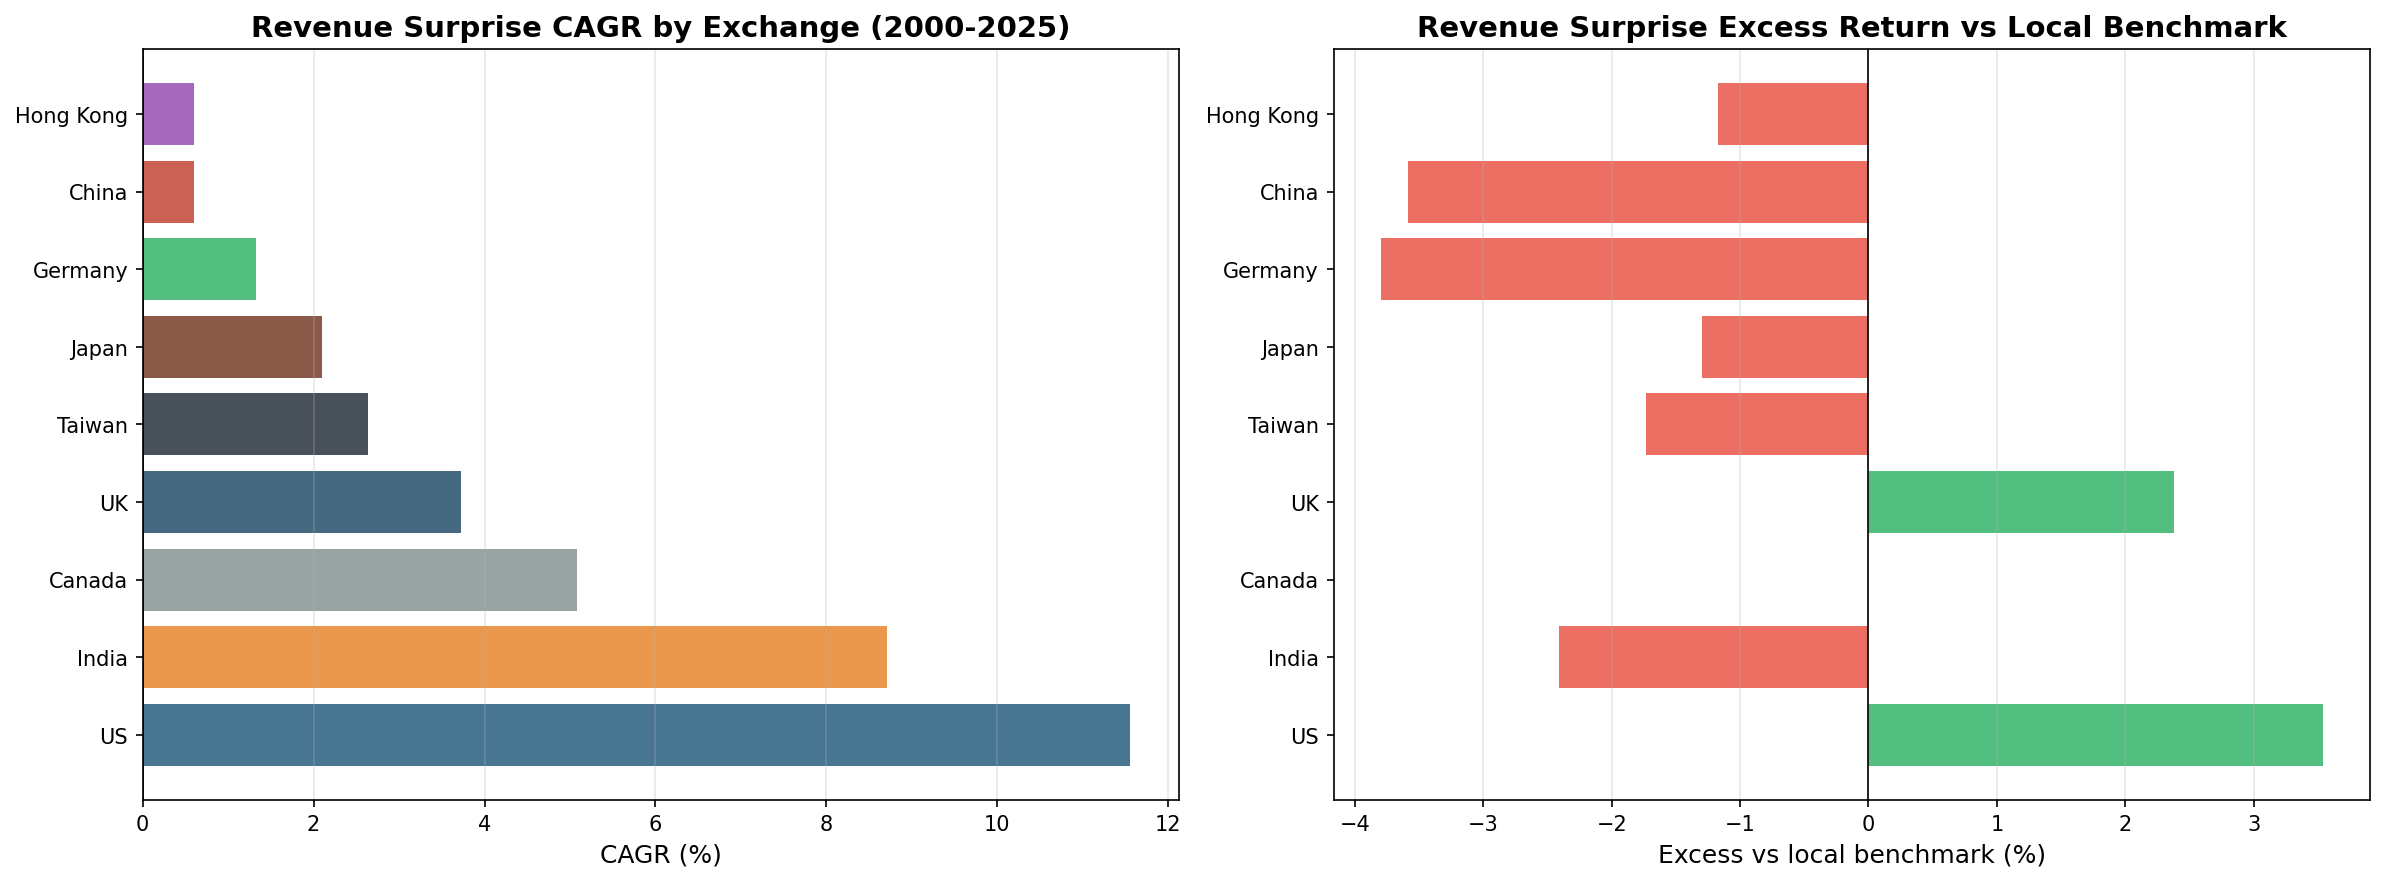
| Exchange | CAGR | Benchmark | Bench CAGR | Excess | Sharpe | Cash % | Avg Stocks |
|---|---|---|---|---|---|---|---|
| US (NYSE+NASDAQ+AMEX) | 11.55% | S&P 500 | 8.02% | +3.54% | 0.466 | 0% | 28.4 |
| UK (LSE) | 3.73% | FTSE 100 | 1.36% | +2.38% | 0.011 | 6% | 10.6 |
| Canada (TSX) | 5.08% | TSX Composite | 5.08% | -0.00% | 0.151 | 12% | 27.8 |
| Hong Kong (HKSE) | 0.60% | Hang Seng | 1.77% | -1.17% | -0.128 | 42% | 26.3 |
| Japan (JPX) | 2.10% | Nikkei 225 | 3.40% | -1.30% | 0.238 | 75% | 28.8 |
| Taiwan (TAI+TWO) | 2.64% | TAIEX | 4.38% | -1.73% | 0.161 | 75% | 29.8 |
| India (NSE) | 8.71% | Sensex | 11.12% | -2.41% | 0.121 | 45% | 28.2 |
| China (SHZ+SHH) | 0.60% | SSE Composite | 4.19% | -3.59% | -0.194 | 75% | 29.3 |
| Germany (XETRA) | 1.32% | DAX | 5.12% | -3.80% | -0.037 | 0% | 18.3 |
Returns are in each market's local currency and measured against that market's own index, so the CAGR column is not comparable across rows. The excess column is.
Max Drawdowns
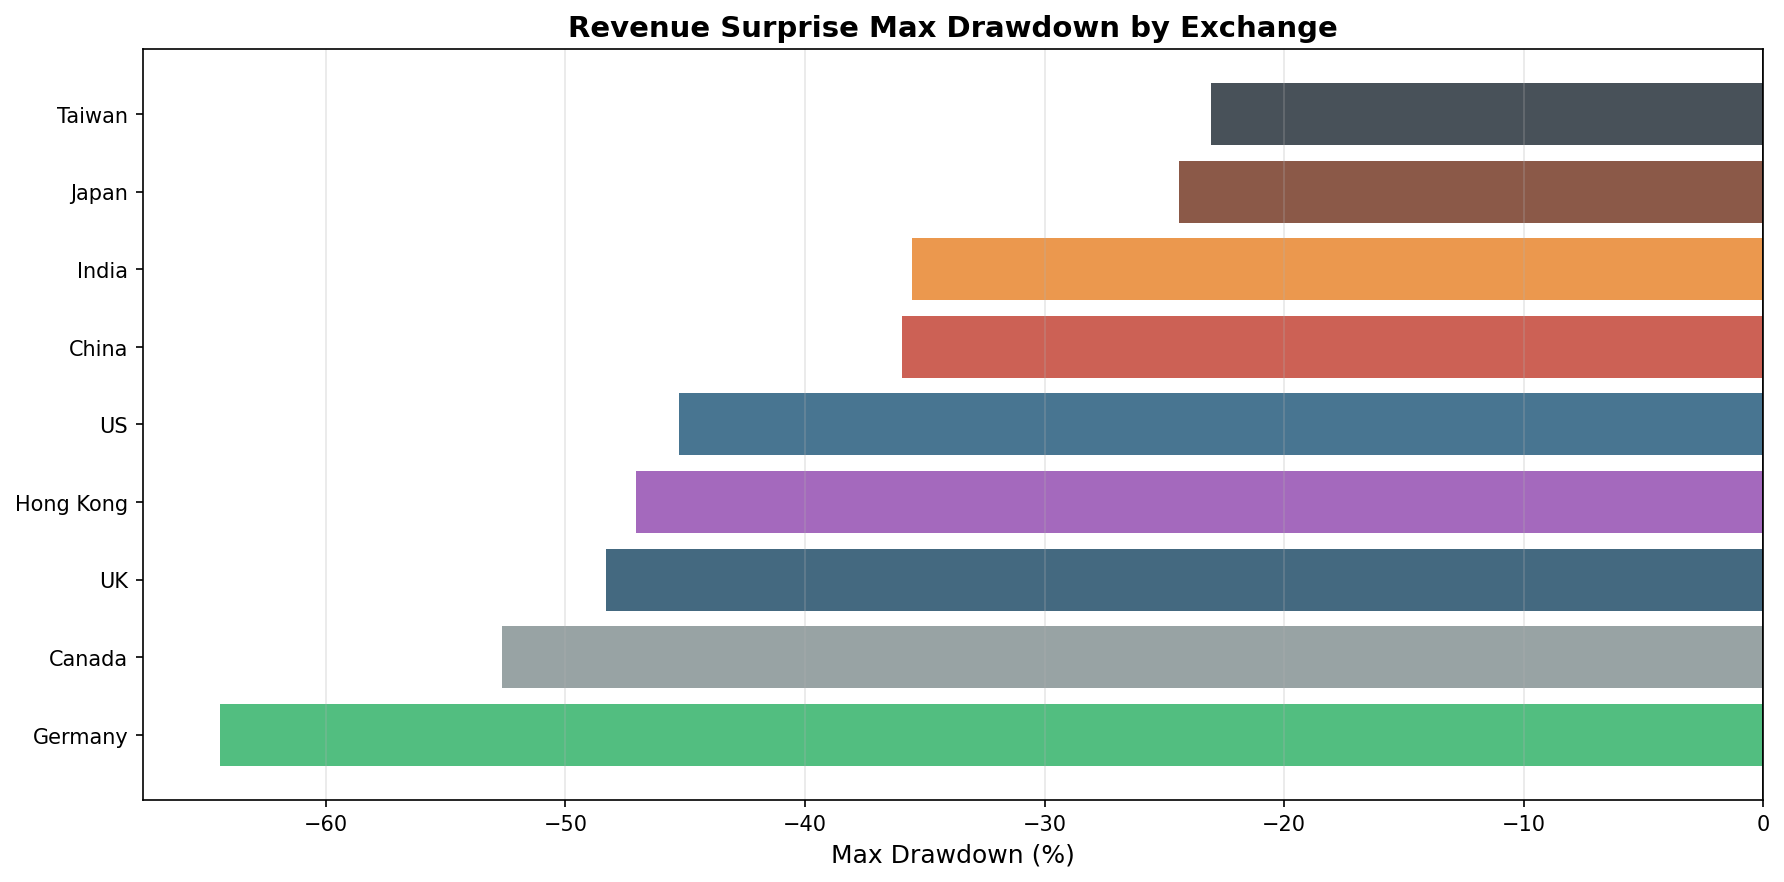
| Exchange | Max Drawdown | Invested % |
|---|---|---|
| Germany (XETRA) | -64.4% | 100% |
| Canada (TSX) | -52.6% | 88% |
| UK (LSE) | -48.3% | 94% |
| Hong Kong (HKSE) | -47.1% | 58% |
| US (NYSE+NASDAQ+AMEX) | -45.3% | 100% |
| China (SHZ+SHH) | -36.0% | 25% |
| India (NSE) | -35.6% | 55% |
| Japan (JPX) | -24.4% | 25% |
| Taiwan (TAI+TWO) | -23.1% | 25% |
Japan and Taiwan show shallow max drawdowns (-23 to -24%) because the portfolio held cash for 75% of the period. Both were mildly profitable when invested (2.10% and 2.64% CAGR, with losing quarters under 9% of the record), they simply weren't exposed often enough or long enough to build a deep drawdown. A shallow drawdown here measures absence from the market, not resilience in it.
Germany's -64.4% is the most concerning result for a fully-invested exchange. It's also the one number in this table that turns out to be mostly an artifact of who is listed on the exchange rather than how the strategy behaves. See the Germany section below.
The Data Availability Problem
The core issue for non-US exchanges isn't strategy design for most markets. It's the data pipeline.
Revenue surprise requires quarterly analyst consensus revenue estimates: not annual estimates, not forward guidance, but backward-looking consensus estimates for each fiscal quarter. In the US, this data exists comprehensively from the early 1990s onward. Elsewhere it arrived later and thinner, counting symbols that carry any quarterly revenueAvg estimate and the year the earliest one appears:
| Exchange | Symbols with quarterly estimates | First estimate | Cash % |
|---|---|---|---|
| US (NYSE+NASDAQ+AMEX) | 6,076 | 1992 | 0% |
| Germany (XETRA) | 798 | 1996 | 0% |
| UK (LSE) | 2,257 | 1996 | 6% |
| Canada (TSX) | 717 | 1996 | 12% |
| Hong Kong (HKSE) | 1,112 | 1996 | 42% |
| India (NSE) | 1,429 | 1996 | 45% |
| China (SHZ+SHH) | 3,319 | 2011 | 75% |
| Japan (JPX) | 2,140 | 2016 | 75% |
| Taiwan (TAI+TWO) | 763 | 2011 | 75% |
Japan, Taiwan, and China spend 75% of the test in cash, and the reason is visible in the "first estimate" column: nothing before 2011, and for Japan nothing before 2016. Those markets built analyst research around annual earnings models, and quarterly revenue consensus only arrived recently. The 25% of invested periods cluster in the last decade.
Hong Kong and India are a different failure. Estimates go back to 1996 there, but not enough symbols carry them in any given quarter to fill a 10-stock portfolio, so the strategy sits in cash roughly 45% of the time despite the data nominally existing.
The date of the first estimate is a weak measure of usable depth. One covered company in 1996 doesn't let a screen run. The cash column is the honest one: it's the share of quarters where this specific strategy couldn't assemble a portfolio.
US: The Cleanest Result
The US runs 103 of 103 quarters fully invested, no cash. The signal fired every quarter for 25 years. CAGR 11.55%, S&P 500 8.02%, excess +3.54%, Sharpe 0.466.
Up capture 114.0%, down capture 85.2%. The strategy captures more market upside and meaningfully less downside. Over 25 years that asymmetry compounds to a 1,570% total return vs the market's 628%. Jensen's alpha is 3.35% against a beta of 1.032, so the excess isn't coming from extra market exposure.
The two worst stretches: 2013-2015 (QE multiple expansion undercut fundamental signals) and 2020-2021 (Fed stimulus inflated multiples while revenue surprises on beaten-down names meant less). Outside those periods, the strategy tracks reasonably close to the market with a consistent positive tilt.
UK: Positive Excess, With Caveats
The UK is the one non-US market where revenue surprise shows positive excess vs the local benchmark: +2.38% vs FTSE 100, over 25 years.
This is the row that changed most since we first published. In March the UK ran 45% in cash, because FMP's historical quarterly analyst coverage for LSE names was thin before roughly 2010. That coverage has since been backfilled. The same code on the same period now holds cash in only 6 of 103 quarters, so the strategy is invested 94% of the time instead of 55%.
That doesn't make the result solid, it moves where the weakness is. The portfolio now averages 10.6 stocks against a minimum-qualifying floor of 10. Most quarters clear the diversification bar by one or two names, which is a thin portfolio to draw conclusions from. The Sharpe ratio is 0.011, effectively zero.
The benchmark also deserves context. The FTSE 100 returned only 1.36% CAGR over this period. UK large-caps significantly underperformed global equities over 2000-2025 due to sector composition (energy, materials, financials, consumer staples) and the structural headwinds from Brexit uncertainty. Beating 1.36% annually is a lower bar than beating the S&P 500.
The honest interpretation: the UK now has the data, and the sign is positive and stable across two runs a year apart. But a 10-stock portfolio earning a near-zero Sharpe against a weak index is not something to allocate against.
India: High Absolute Return, Negative vs Sensex
India (NSE) returned 8.71% CAGR, which looks strong until you compare it to the Sensex, which returned 11.12% CAGR over the same period. Excess return vs the local benchmark: -2.41%.
Measured against SPY instead, Indian stocks would show positive excess, because the Indian market structurally outperformed US equities over this period. That's a market and currency comparison artifact, not alpha. Using the local benchmark reveals the strategy underperformed India's own index.
The cash drag is where that gap comes from, and it's worth being precise about it. The signal doesn't fire in India until 2011, so the strategy sat in cash through the Sensex's strongest run: 2003 (+79%), 2005 (+41%), 2006 (+48%), 2007 (+47%) and 2009 (+76%) all accrued to the benchmark and none to the portfolio. In the quarters it was actually invested, from 2011 onward, the strategy beat the Sensex comfortably. The full-period -2.41% is a statement about 46 quarters of missing data, not about the signal failing when it runs.
That distinction cuts both ways. It means India isn't evidence against revenue surprise. It also means we can't present India as evidence for it, because the invested window is 57 quarters starting in 2011, which is a different and much shorter test than the 25 years the US result rests on.
Germany: Mostly a Listing Artifact
Germany (XETRA) ran 0% cash, with enough qualifying stocks every quarter for 25 years. Results look bad: 1.32% CAGR vs 5.12% DAX, excess -3.80%, and a maximum drawdown of -64.4%, the worst in the table.
That number is not really about German companies. A screen selects every company listed on an exchange, and XETRA lists a lot of foreign ones: of 2,665 symbols in the universe, only 715 are companies headquartered in Germany. The other 73% are secondary listings of businesses domiciled elsewhere.
Re-running the identical screen restricted to German-domiciled companies changes the picture substantially:
| As screened (listed) | German-domiciled only | |
|---|---|---|
| Universe | 2,665 symbols | 715 |
| CAGR | 1.32% | 3.50% |
| Excess vs DAX | -3.80% | -1.62% |
| Sharpe | -0.037 | 0.094 |
| Max drawdown | -64.4% | -31.1% |
| Cash quarters | 0 of 103 | 35 of 103 |
| Avg stocks held | 18.3 | 27.1 |
The drawdown halves and the underperformance more than halves. The "0% cash, always invested" claim also turns out to be misleading: the listed universe passes the 10-stock minimum every quarter, but only 18.3 names on average survive to actually get priced and held, against 27.1 in the domicile-restricted run. Foreign secondary lines were clearing the screen and then dropping out for want of usable price data, quietly thinning the portfolio.
Germany still doesn't beat the DAX on either universe, so the conclusion holds. But the size of the failure, and the drawdown headline in particular, belonged mostly to companies that aren't German. Every other number in this post uses the exchange-listed universe, consistently across all nine markets.
What This Means
Revenue surprise momentum is reliable in the US and marginal in the UK. For every other exchange tested, the signal either lacks the historical data to fire consistently, or fires but doesn't produce positive excess vs the local market.
The explanation isn't the same for all markets: - Japan, Taiwan, China: data problem. Signal can't run in three quarters of the period. - India: the signal doesn't start until 2011, and the full-period gap is mostly the Sensex compounding through years the portfolio spent in cash. Positive while invested, too short a window to lean on. - Germany: the headline failure is mostly foreign secondary listings. On German companies the gap narrows to -1.62%, still negative. - Canada: the signal runs in 88% of quarters and lands exactly on the TSX Composite. No edge, no penalty. - UK: positive and now well-populated with data, but the portfolio averages 10.6 stocks and the Sharpe is 0.011.
For investors in US equities: the signal works. 3.5% excess CAGR over 25 years is real, it survives risk adjustment, and the mechanism is sound.
For investors in other markets: check whether quarterly consensus revenue estimates exist in sufficient depth for your target market. If they don't, the signal won't fire. If they do, check what's actually in your universe. On XETRA, nearly three quarters of the listed names are foreign, and that single fact accounted for more than half of Germany's apparent underperformance and most of its drawdown.
Run the US revenue surprise screen on Ceta Research
Individual Exchange Posts
- Revenue Surprise Momentum: US Results (11.55% CAGR, +3.54% excess, 25 years fully invested)
References
- Jegadeesh, N. & Livnat, J. (2006). "Revenue Surprises and Stock Returns." Journal of Accounting and Economics, 41(1–2), 147–171.
- Bushee, B. & Raedy, J. (2005). "Factors Affecting the Implementability of Stock Market Trading Strategies." Working Paper, University of Pennsylvania (SSRN 384500). (Context: data availability constraints on implementability)
- Griffin, J., Ji, X. & Martin, S. (2003). "Momentum Investing and Business Cycle Risk: Evidence from Pole to Pole." Journal of Finance, 58(6), 2515–2547. (Cross-market momentum analysis)
Data: Ceta Research, FMP financial data warehouse. 9 exchanges, quarterly rebalance, equal weight, transaction costs included, MOC execution, 2000–2025. Returns in local currency vs local index benchmark.
Past performance does not guarantee future results. This is educational content, not investment advice.

