
Revenue Acceleration in Canada: 8.39% a Year, and the Real Story is Downside
Canada is the best result in our 15-exchange study, at 8.39% CAGR against 7.33% for the S&P 500. The alpha is thin, but the 43% down capture held up in five of six down years.

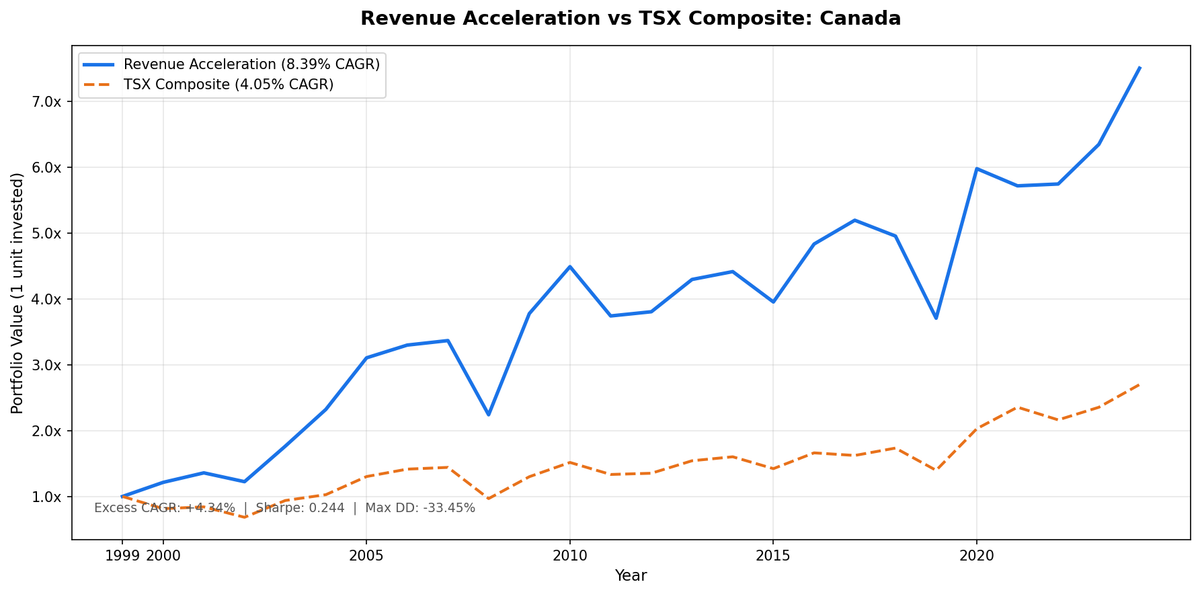
Canada is the best result in our 15-exchange revenue acceleration study. The strategy returned 8.39% a year against 7.33% for the S&P 500 and 4.05% for the TSX Composite. A $10,000 stake grew to $75,017, against $58,591 for the S&P 500.
Contents
- Method
- What We Found
- A positive result built on downside protection.
- Year-by-Year Returns
- The defensive pattern is real.
- The late-cycle failure is still there.
- What explains Canada's different profile?
- Limitations
- Takeaway
- Part of a Series
- Run This Screen Yourself
- References
The headline alpha still isn't the interesting number. The down capture is 43.2%: averaged across the years the S&P 500 fell, Canadian revenue accelerators absorbed well under half the decline. They beat the index in five of its six down years.
Data: FMP financial data warehouse, 2000–2025. Updated August 2026.
Method
Data source: Ceta Research (FMP financial data warehouse) Universe: TSX (Toronto Stock Exchange), market cap > CAD 500M Period: 2000–2025 (25 years) Rebalancing: Annual (April 1), equal weight Execution: Next-day close. The screen is computed on the rebalance date and filled at the following session's close Benchmark: S&P/TSX Composite, with the S&P 500 (SPY) reported as a secondary cross-market yardstick Risk-free rate: 2.5% (Canada 10-year), applied to both the portfolio and the benchmark Sharpe. This is why the S&P 500's Sharpe reads 0.229 here and 0.253 in the US post: same index, different local risk-free rate Cash rule: Hold cash if fewer than 10 stocks qualify Transaction costs: Size-tiered model (0.1–0.5% one-way based on market cap)
Signal: revenue growth acceleration across 3 consecutive annual filings, filtered for ROE > 10%, debt/equity < 1.5, and minimum market cap. Top 30 by acceleration magnitude.
Read the TSX Composite comparison carefully. The portfolio's returns include dividends. The TSX Composite is a price index and doesn't. Canadian equities have paid roughly 2.5% to 3% a year in dividends over this period, so a meaningful slice of the +4.34% gap against the Composite is just the dividends the index leaves out. On a like-for-like total-return basis the Canadian edge is closer to +1.5%, in line with the +1.07% we measure against the S&P 500, which is total-return. Both columns are shown below so you can see the difference.
What We Found
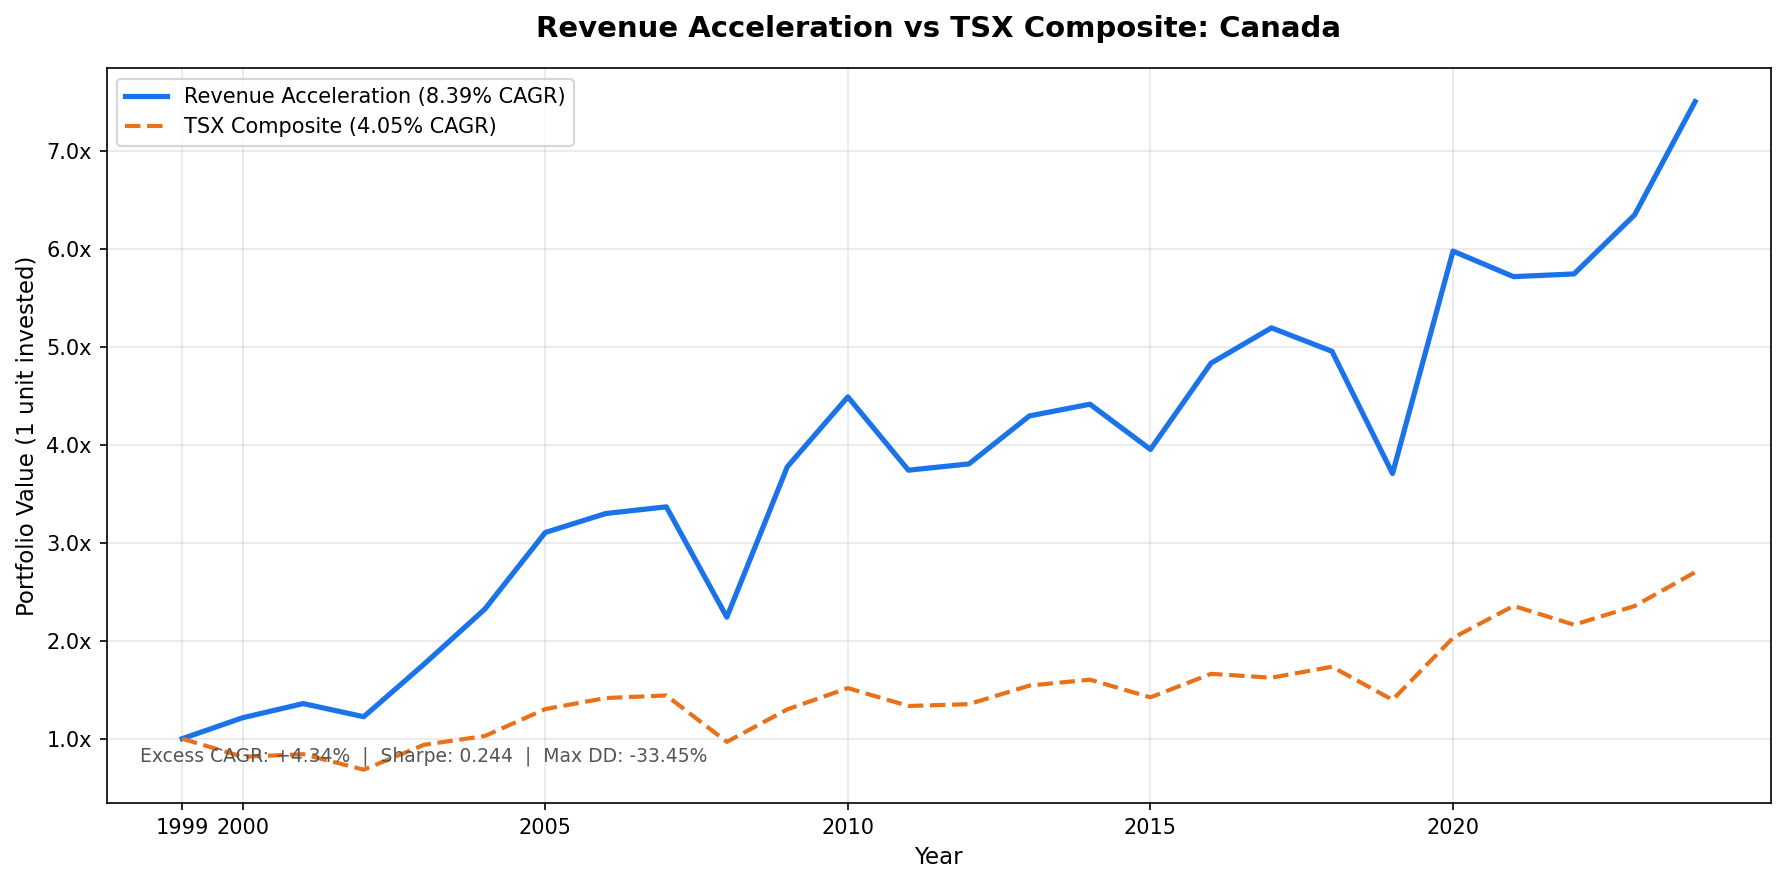
A positive result built on downside protection.
| Metric | Revenue Accel (TSX) | TSX Composite | S&P 500 |
|---|---|---|---|
| CAGR | 8.39% | 4.05% | 7.33% |
| Total Return | 650% | 170% | 486% |
| Max Drawdown | -33.45% | -32.86% | -39.33% |
| Volatility (ann.) | 24.18% | N/A | 21.07% |
| Sharpe Ratio | 0.244 | 0.082 | 0.229 |
| Up Capture (vs SPY) | 93.8% | N/A | N/A |
| Down Capture (vs SPY) | 43.2% | N/A | N/A |
| Win Rate (vs SPY) | 52.0% | N/A | N/A |
| Cash Periods | 0 of 25 | N/A | N/A |
| Avg Stocks | 21.8 | N/A | N/A |
The Sharpe ratio of 0.244 edges the S&P 500's 0.229, which is a change from how this looked before we corrected the execution assumptions. Up capture of 93.8% means the strategy kept most of the bull-market gains rather than sitting them out. Down capture of 43.2% is the standout: in years when the benchmark fell, this portfolio fell less than half as much on average.
Zero cash periods and 21.8 average qualifying stocks confirm consistent coverage. Canada's revenue data quality is strong across the full 25-year period.
Year-by-Year Returns
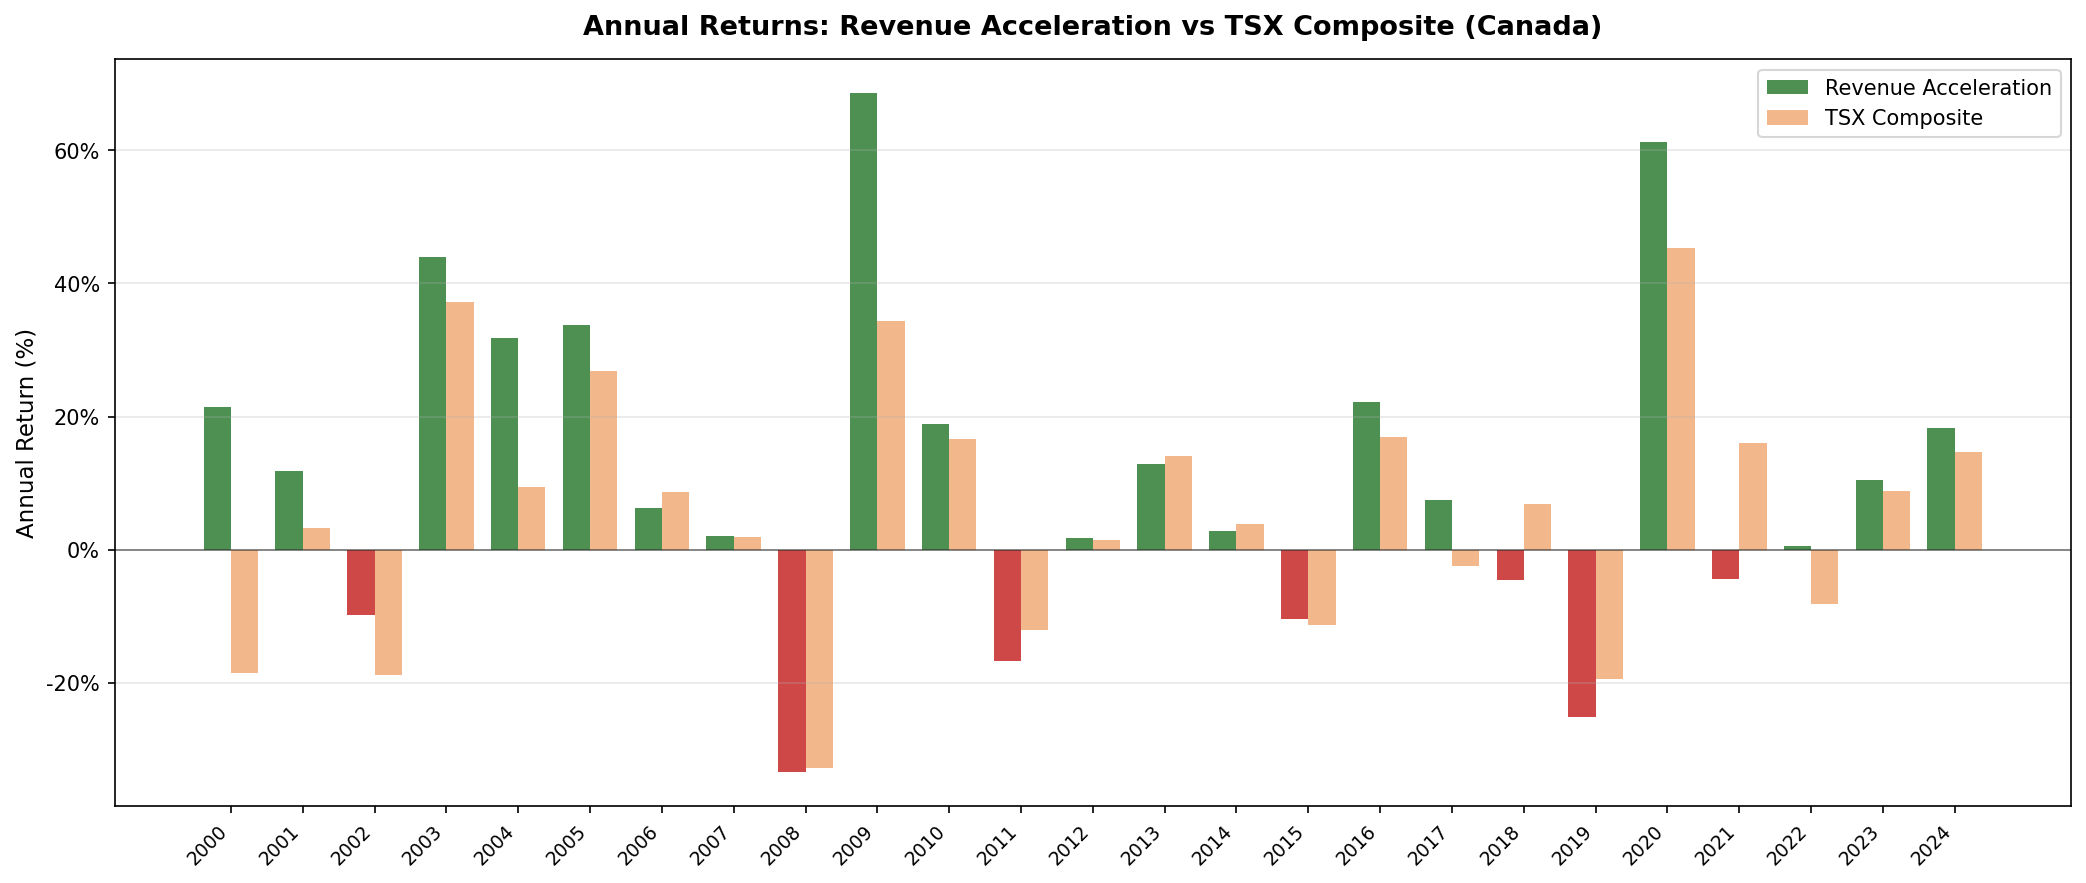
Each row runs April to April, so "2019" means April 2019 to April 2020.
| Year | Rev Accel (TSX) | TSX Composite | Excess vs TSX | S&P 500 | Excess vs S&P 500 |
|---|---|---|---|---|---|
| 2000 | +21.42% | -18.48% | +39.9% | -23.68% | +45.1% |
| 2001 | +11.88% | +3.28% | +8.6% | +1.07% | +10.8% |
| 2002 | -9.87% | -18.78% | +8.9% | -21.34% | +11.5% |
| 2003 | +43.95% | +37.24% | +6.7% | +32.14% | +11.8% |
| 2004 | +31.76% | +9.46% | +22.3% | +4.61% | +27.1% |
| 2005 | +33.70% | +26.79% | +6.9% | +12.25% | +21.5% |
| 2006 | +6.23% | +8.64% | -2.4% | +11.60% | -5.4% |
| 2007 | +2.07% | +1.87% | +0.2% | -1.97% | +4.0% |
| 2008 | -33.45% | -32.86% | -0.6% | -37.36% | +3.9% |
| 2009 | +68.55% | +34.31% | +34.2% | +45.19% | +23.4% |
| 2010 | +18.87% | +16.67% | +2.2% | +14.44% | +4.4% |
| 2011 | -16.67% | -12.04% | -4.6% | +8.68% | -25.3% |
| 2012 | +1.71% | +1.40% | +0.3% | +13.02% | -11.3% |
| 2013 | +12.88% | +14.01% | -1.1% | +22.87% | -10.0% |
| 2014 | +2.78% | +3.92% | -1.1% | +11.43% | -8.7% |
| 2015 | -10.45% | -11.25% | +0.8% | +2.04% | -12.5% |
| 2016 | +22.26% | +16.86% | +5.4% | +16.46% | +5.8% |
| 2017 | +7.47% | -2.38% | +9.8% | +11.49% | -4.0% |
| 2018 | -4.62% | +6.90% | -11.5% | +13.22% | -17.8% |
| 2019 | -25.18% | -19.47% | -5.7% | -10.14% | -15.0% |
| 2020 | +61.25% | +45.27% | +16.0% | +63.95% | -2.7% |
| 2021 | -4.36% | +16.08% | -20.4% | +13.89% | -18.2% |
| 2022 | +0.49% | -8.18% | +8.7% | -8.51% | +9.0% |
| 2023 | +10.48% | +8.86% | +1.6% | +28.08% | -17.6% |
| 2024 | +18.22% | +14.64% | +3.6% | +10.19% | +8.0% |
The defensive pattern is real.
Take the six years the S&P 500 finished negative. The Canadian portfolio beat it in five of them: 2000 (+21.4% while the index fell 23.7%), 2002, 2007, 2008 (-33.5% vs -37.4%), and 2022 (+0.5% while the index fell 8.5%). The one exception is 2019, the April-to-April window that swallowed the COVID crash, where the portfolio fell 25.2% against the index's 10.1%.
2022 is the cleanest example. The portfolio finished slightly positive in a year the S&P 500 lost 8.5%. That's not muted downside, it's the absence of downside.
The late-cycle failure is still there.
Canada shares the weakness that sinks this strategy elsewhere. Its worst year against the local index is 2021, at -20.4%: the portfolio lost 4.4% while the Composite gained 16.1%. Against the S&P 500 the worst is 2011, at -25.3%.
The pattern is the same one visible in the US data. Revenue acceleration finds companies at peak growth velocity, and when the cycle turns, especially in a commodity-heavy market like Canada, the unwinding is sharp.
What explains Canada's different profile?
A plausible explanation: Canadian revenue acceleration selects heavily from energy, materials, and industrials, sectors tied to commodity cycles. When commodity prices accelerate, which shows up as revenue acceleration, these companies are genuinely cheap on fundamentals relative to their growth trajectory. They also tend to be more defensive in general market downturns because their earnings don't correlate as tightly with US tech and growth.
The US version picks more tech-heavy names. Canadian filters at the same thresholds land in a different sector mix.
This is speculation, not a proven mechanism. The backtest doesn't break down portfolio composition by sector. But the return profile is consistent with the theory.
Limitations
The TSX Composite is a price index. It excludes dividends, so the +4.34% excess against it overstates the real edge by roughly the Canadian market's dividend yield. The +1.07% against the total-return S&P 500 is the more conservative read.
Currency translation not applied. Portfolio returns are in CAD, the S&P 500 column in USD. In periods of significant CAD/USD movement this comparison overstates or understates true relative performance for a USD investor. The TSX Composite comparison is currency-clean.
Small market effect. TSX is a smaller exchange than NYSE+NASDAQ+AMEX. With 21.8 average stocks in a concentrated exchange, idiosyncratic company risk is higher.
Survivorship bias. Current listings only. Companies that delisted during the period aren't tracked through failure.
The universe includes closed-end funds. Funds report investment income in the revenue field and can post huge "acceleration." Canada is lightly affected, with 0 to 4 funds in the screened 30 across the years we checked, and excluding them entirely moves the CAGR from 8.39% to 8.52%.
The excess is not statistically significant. Twenty-five annual observations at 24% volatility is nowhere near enough to conclude that this strategy reliably outperforms. The excess could be noise. The downside protection is more robust: it shows up consistently across multiple down years rather than in one or two.
Takeaway
Canada is the strongest revenue acceleration result we found, at 8.39% a year against 7.33% for the S&P 500 and 4.05% for the price-only TSX Composite. Don't overweight the alpha. With 25 annual observations and this much volatility, +1.07% doesn't confirm the signal works here.
What the data does show is a 43.2% down capture that held up across multiple market downturns, alongside 93.8% up capture. That combination is a different result from the US version of the identical screen, which captured 107% of the downside, and it points at Canada's sector composition rather than at the signal itself.
If you want a portfolio that participates in bull markets while limiting crash exposure, the Canadian version of this signal produced that historically. Whether it continues to is a separate question.
Part of a Series
This post is part of our Revenue Acceleration global exchange comparison:
- US: 3.56% CAGR, -3.77% vs the S&P 500, 107% down capture. The identical screen, the opposite result
- Germany: 7.71% CAGR, +3.20% over the DAX, and the shallowest drawdown in the study at -21.52%
- Revenue Acceleration: 15-Exchange Global Comparison: from Canada +1.07% to Hong Kong -11.49% against the S&P 500
Run This Screen Yourself
The current revenue acceleration screen for Canadian stocks. It adds guards the backtest doesn't use: funds and ETFs are dropped, share classes deduped, and growth and ROE bounded so restatement artifacts don't take the top rows.
WITH inc AS (
    SELECT symbol, revenue, dateEpoch,
           ROW_NUMBER() OVER (PARTITION BY symbol ORDER BY dateEpoch DESC) AS rn
    FROM income_statement
    WHERE period = 'FY' AND revenue > 0
),
rev_calc AS (
    SELECT r1.symbol,
           (r1.revenue - r2.revenue) / NULLIF(r2.revenue, 0) AS growth_current,
           (r2.revenue - r3.revenue) / NULLIF(r3.revenue, 0) AS growth_prior,
           (r1.revenue - r2.revenue) / NULLIF(r2.revenue, 0)
             - (r2.revenue - r3.revenue) / NULLIF(r3.revenue, 0) AS acceleration
    FROM inc r1
    JOIN inc r2 ON r1.symbol = r2.symbol AND r2.rn = 2
    JOIN inc r3 ON r1.symbol = r3.symbol AND r3.rn = 3
    WHERE r1.rn = 1
),
met AS (
    SELECT symbol, returnOnEquity, marketCap,
           ROW_NUMBER() OVER (PARTITION BY symbol ORDER BY dateEpoch DESC) AS rn
    FROM key_metrics WHERE period = 'FY'
),
rat AS (
    SELECT symbol, debtToEquityRatio,
           ROW_NUMBER() OVER (PARTITION BY symbol ORDER BY dateEpoch DESC) AS rn
    FROM financial_ratios WHERE period = 'FY'
)
SELECT rc.symbol,
       p.companyName,
       p.sector,
       ROUND(rc.growth_current * 100, 1) AS current_growth_pct,
       ROUND(rc.growth_prior * 100, 1) AS prior_growth_pct,
       ROUND(rc.acceleration * 100, 1) AS acceleration_ppt,
       ROUND(m.returnOnEquity * 100, 1) AS roe_pct,
       ROUND(r.debtToEquityRatio, 2) AS de_ratio,
       ROUND(m.marketCap / 1e9, 1) AS mktcap_b
FROM rev_calc rc
JOIN met m ON rc.symbol = m.symbol AND m.rn = 1
JOIN rat r ON rc.symbol = r.symbol AND r.rn = 1
JOIN profile p ON rc.symbol = p.symbol
WHERE rc.growth_current > rc.growth_prior
  AND rc.growth_current > 0.05
  AND rc.growth_current < 3.0
  AND rc.growth_prior > -0.5
  AND m.returnOnEquity > 0.10
  AND m.returnOnEquity < 1.0
  AND r.debtToEquityRatio >= 0
  AND r.debtToEquityRatio < 1.5
  AND m.marketCap > 500000000
  AND p.exchange IN ('TSX')
  AND p.isFund = false AND p.isEtf = false AND p.isActivelyTrading = true
QUALIFY ROW_NUMBER() OVER (PARTITION BY p.companyName ORDER BY rc.symbol) = 1
ORDER BY rc.acceleration DESC
LIMIT 30
Run this screen on Ceta Research
References
- Chan, L. K. C., Jegadeesh, N., & Lakonishok, J. (1996). "Momentum Strategies." Journal of Finance, 51(5), 1681–1713.
- Lakonishok, J., Shleifer, A., & Vishny, R. (1994). "Contrarian Investment, Extrapolation, and Risk." Journal of Finance, 49(5), 1541–1578.
Data: Ceta Research, FMP financial data warehouse. Universe: TSX. Annual rebalance (April), next-day close execution, equal weight, transaction costs included, 2000–2025. Not investment advice.

